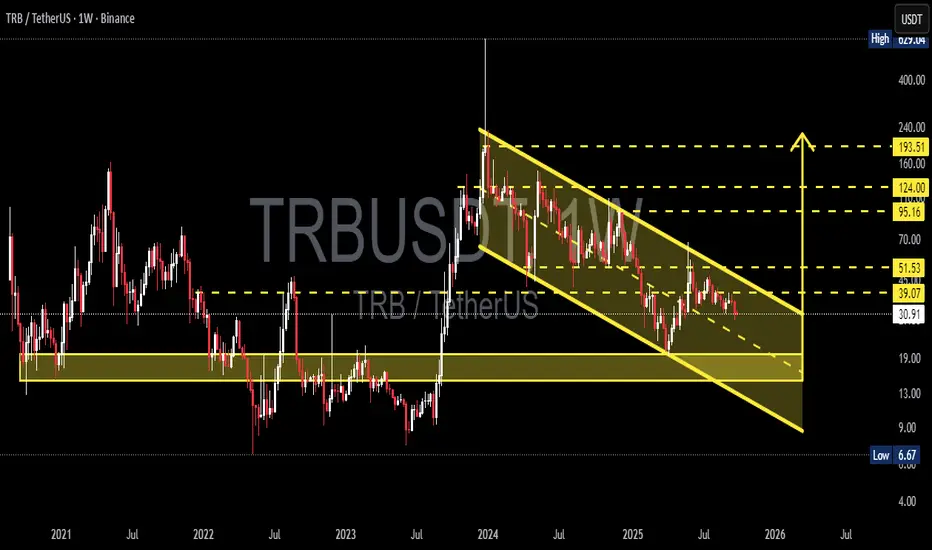
TRB/USDT — Breakout Toward 124 or Breakdown to 13?TRB (Tellor) is now entering a crucial phase. After the massive rally in 2024, the market has pushed TRB into a structured correction forming a clear descending channel on the weekly timeframe. This chart reflects the ongoing battle between long-term accumulation and medium-term selling pressure.
---
🔎 Technical Structure
1. Descending Channel (Bearish Structure):
Price continues to form lower highs & lower lows, confirming sellers remain dominant.
The channel can act either as a distribution phase before further breakdown, or a long-term accumulation phase before reversal.
2. Historical Support Zone (13 – 19 USDT):
This area has served as a major turning point multiple times since 2021.
A breakdown below this level could trigger a capitulation move toward the channel bottom near 9 USDT.
3. Key Resistance (39 – 51 USDT):
This is the “first gateway” for bullish validation.
A strong breakout here with volume could unlock a rally toward 95 – 124 USDT.
4. Fibonacci / Historical Levels:
95.16 → Strong psychological resistance.
124.00 → Potential major profit-taking zone.
193.51 → Long-term target if a full bullish trend resumes.
---
🚀 Bullish Scenario (Potential Reversal)
Confirmation: Weekly close above the descending channel with a successful retest.
Targets (Stage 1): 39.07 → 51.53.
Targets (Stage 2): 95.16 → 124.00.
Narrative: A breakout from the channel signals the end of the long correction, opening the door for buyers to step in aggressively above 51 USDT.
---
📉 Bearish Scenario (Continuation)
Confirmation: Strong rejection at the channel upper boundary + breakdown below 30 USDT.
Targets (Stage 1): 19 USDT (minor support).
Targets (Stage 2): 13 USDT → 9 USDT (channel bottom).
Narrative: As long as price remains within the channel, bearish sentiment dominates. A breakdown of historical support means a potential capitulation before the next accumulation cycle.
---
🧭 Trading Strategy
Conservative Traders: Wait for a weekly breakout + retest before going long (low risk – high reward).
Aggressive Traders: Scale into the 13 – 19 zone with tight stops below 13.
Short Traders: Look for rejection at the upper/midline channel for swing shorts targeting support zones.
Risk Management: TRB is highly volatile (as seen in 2024) — always cap risk at 1–3% per position.
---
📌 Conclusion
TRB is at a major crossroads. While the descending channel still favors the bearish trend, a confirmed breakout would be a game-changer, signaling the end of correction and opening the way toward 95–124 USDT. On the flip side, failure to hold above 30 could drag price back to 13–19 or even 9 USDT.
This setup is not just about chart patterns, but also about market psychology: Is TRB ready for long-term accumulation, or is one more leg down still ahead?
---
#TRB #TRBUSDT #Crypto #Altcoin #PriceAction #TechnicalAnalysis #DescendingChannel #Breakout #SwingTrading #SupportResistance
Trbusdc
Short Entry upon Wedge Breakdown for TRBGreetings, Snipers!
TRB has risen over 200% in less than a month during a bear market
The pump and dump forms a rising wedge
In the shorter timeframe, there is a clear diagonal support
We can short once there is a breakdown of this support.
TP1 at $24.4
TP2 at $16.6
Please ensure risk management and stop-loss (trailing $31, $34, $36 for futures) as this coin has a pump-and-dump nature. There is a price discrepancy with TRB futures, so beware of the funding rate.
Happy Sniping!

TRB quick H&STellor just formed Head and Shoulders 🤷 pattern on 15m and also broke the yellow uptrendline IF price breaks the Neckline 39.15 and stays below for a few bars, I will set SELL LIMIT order to the neckline level to catch the backtest as I think there is chance for drop to 35.9 later.
ENTRY : backtest of the Neckline @ 39.1
STOPLOSS (SL) : Left Shoulder @ 40.47
TARGET (TP) : Inverted H&S target projection @ 35.9
REWARD RISK RATIO (RRR) : 2.5
INVALIDATION : when SL level hit
Check my other stuff in related ideas.
Please boost🚀, comment🗣️, follow me✒️, enjoy📺!
⚠️Disclaimer: I'm not financial advisor. This is not a financial advice. Do your own due dilingence.

TRB has great potential. :)Hello, I am publishing today my first idea on the pair TRBUSDT , time frame 2h. As always I will be mentioning a few scenarios and for each I am giving the reasons why I think that way.
FIRST SCENARIO- The market has been hurt these days by BTC. But TRB seems to recover so fast in the area between 87-96.5$. Even though we can clearly see a downtrend in this time frame, looking at the RSI, it shows a small sign of a bullish trend. However a lot of volume is needed, because if not, The RSI may show a bearish divergence. However I expect at first a small drop between 76-86 area, in which is a very buying opportunity. I think there will be at least another drop in price. In that area is a great moment to buy. If you want to have a SL, I would recommend it to be under 74$. But TRB recovers very fast, and to me it has great potential with this movement it is doing.
SECOND SCENARIO- If the daily candle closes as a hammer, probably in a few hours we could see movement in the area between 87-94$. We could be witnessing a trend reversal and the price may hit the TP of 125-127$. However it is critical to see how the daily candle stick will close and if there will be another drop of BTC and all the coins. Trade with caution and be careful while trading. TRB is very good, and recently it has recovered quite better. Be patient. If you do not feel like trading in this volatile market, step aside. Hope you liked my idea and you are free to comment for everything. :)

$TRB - gonna popThis chart looks very nice, looks to be ready to pop out this bottom range - a 5 month area of consolidation
The coin only released very late August 2020, with only a 1,7 million supply
It's another DeFi project that works in decentralised lending, where they work on providing solution for oracles and collarorations with ChainLink.
Technically a very nice chart, and fundamentally very sound too, fill the bags boys
