#TRB/USDT About to Explode or Fake Out Everyone Again ?#TRB
The price is moving within a descending channel on the 1-hour frame, adhering well to it, and is heading for a strong breakout and retest.
We have a bearish trend on the RSI indicator that is about to be broken and retested, which supports the upward breakout.
There is a major support area in green at 30.00, representing a strong support point.
We are heading for consolidation above the 100 moving average.
Entry price: 32.00
First target: 33.28
Second target: 34.50
Third target: 36
Don't forget a simple matter: capital management.
When you reach the first target, save some money and then change your stop-loss order to an entry order.
For inquiries, please leave a comment.
Thank you.
TRBUSDTPERP

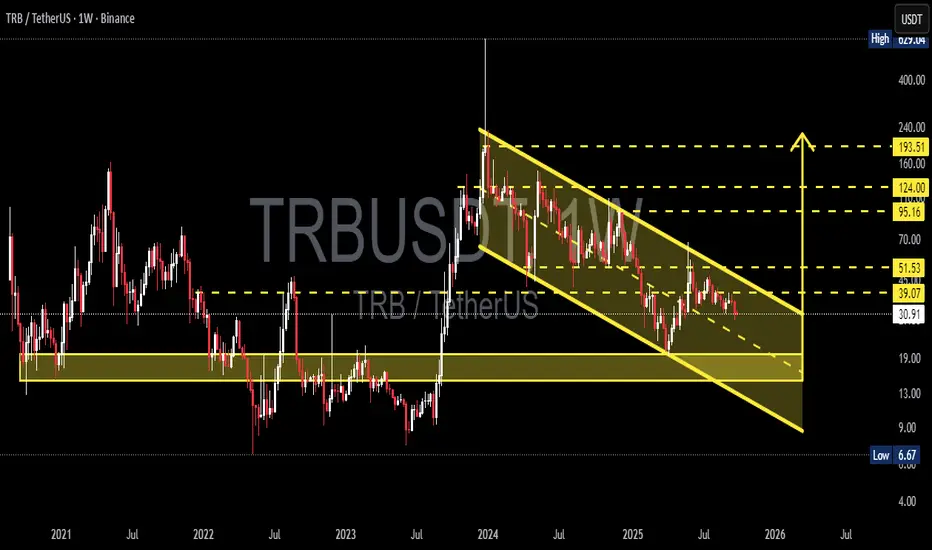
TRB/USDT — Breakout Toward 124 or Breakdown to 13?TRB (Tellor) is now entering a crucial phase. After the massive rally in 2024, the market has pushed TRB into a structured correction forming a clear descending channel on the weekly timeframe. This chart reflects the ongoing battle between long-term accumulation and medium-term selling pressure.
---
🔎 Technical Structure
1. Descending Channel (Bearish Structure):
Price continues to form lower highs & lower lows, confirming sellers remain dominant.
The channel can act either as a distribution phase before further breakdown, or a long-term accumulation phase before reversal.
2. Historical Support Zone (13 – 19 USDT):
This area has served as a major turning point multiple times since 2021.
A breakdown below this level could trigger a capitulation move toward the channel bottom near 9 USDT.
3. Key Resistance (39 – 51 USDT):
This is the “first gateway” for bullish validation.
A strong breakout here with volume could unlock a rally toward 95 – 124 USDT.
4. Fibonacci / Historical Levels:
95.16 → Strong psychological resistance.
124.00 → Potential major profit-taking zone.
193.51 → Long-term target if a full bullish trend resumes.
---
🚀 Bullish Scenario (Potential Reversal)
Confirmation: Weekly close above the descending channel with a successful retest.
Targets (Stage 1): 39.07 → 51.53.
Targets (Stage 2): 95.16 → 124.00.
Narrative: A breakout from the channel signals the end of the long correction, opening the door for buyers to step in aggressively above 51 USDT.
---
📉 Bearish Scenario (Continuation)
Confirmation: Strong rejection at the channel upper boundary + breakdown below 30 USDT.
Targets (Stage 1): 19 USDT (minor support).
Targets (Stage 2): 13 USDT → 9 USDT (channel bottom).
Narrative: As long as price remains within the channel, bearish sentiment dominates. A breakdown of historical support means a potential capitulation before the next accumulation cycle.
---
🧭 Trading Strategy
Conservative Traders: Wait for a weekly breakout + retest before going long (low risk – high reward).
Aggressive Traders: Scale into the 13 – 19 zone with tight stops below 13.
Short Traders: Look for rejection at the upper/midline channel for swing shorts targeting support zones.
Risk Management: TRB is highly volatile (as seen in 2024) — always cap risk at 1–3% per position.
---
📌 Conclusion
TRB is at a major crossroads. While the descending channel still favors the bearish trend, a confirmed breakout would be a game-changer, signaling the end of correction and opening the way toward 95–124 USDT. On the flip side, failure to hold above 30 could drag price back to 13–19 or even 9 USDT.
This setup is not just about chart patterns, but also about market psychology: Is TRB ready for long-term accumulation, or is one more leg down still ahead?
---
#TRB #TRBUSDT #Crypto #Altcoin #PriceAction #TechnicalAnalysis #DescendingChannel #Breakout #SwingTrading #SupportResistance
Today's signalHello friends🙌
🔊After the good growth of this currency, you can see that the price has corrected at the top of the channel and now that we are near the bottom of the channel, there is a good opportunity to buy in stages and with capital and risk management and move with it to the specified goals.
🔥Join us for more signals🔥
*Trade safely with us*

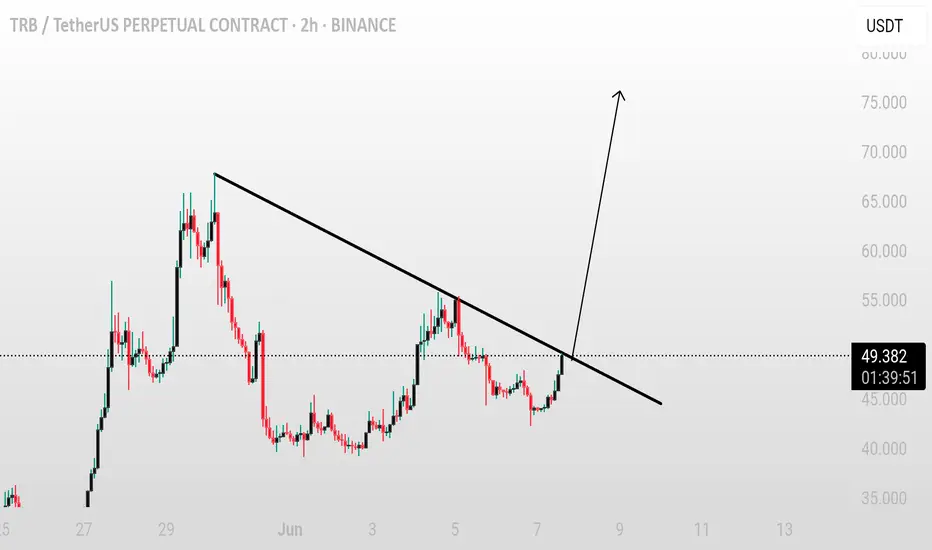
TRB/USDT – Attempting Trendline BreakoutTRB/USDT – Attempting Trendline Breakout
TRB is currently testing a key trendline resistance and attempting a breakout. If the price manages to break and hold above the trendline with strength, it could trigger a bullish move.
A confirmed breakout may lead to a 15–30% bounce in the short term.
Key levels to monitor:
– Trendline resistance
– Breakout confirmation with volume
– Immediate resistance zones above
Keep an eye on TRB — confirmation above the trendline could open the door for a strong upside move.
SMT divergence marked the top. The rest was just execution.Price doesn’t move randomly — it responds to design.
That SMT divergence at the high wasn’t a signal to short. It was a sign to prepare for the shift.
TRB printed a clean inefficiency on the 4H before distributing from the highs. The displacement candle that followed made the intent clear — Smart Money was offloading above the FVG, into passive buyers. Textbook trap.
Now we’re in the reaction phase.
We’ve tagged the 42 handle, and below it sits a 4H OB nested at 38.76. If price returns to that zone, I’m watching for signs of absorption and reaccumulation. That’s my re-entry area. Not before.
Above, the 47.24 OB is where liquidity starts pulling — it’s the first logical exit. If price reclaims that zone cleanly, the next draw becomes the 53.42 inefficiency. That FVG hasn’t been touched, and it won’t stay untouched for long.
Key levels to control the move:
🔑 Entry interest: 38.76 or lower
🧠 Watch 36.04 as final discount before reversal
🎯 Targets: 47.24 → 53.42 (unmitigated inefficiency)
❌ Invalidation: Full body break below 36 — Smart Money would be repositioning lower
This isn’t about prediction. It’s about knowing what the market must do.
You don’t need to believe in me. Just look at the chart.

TRBUSDT 2D AnalysisTRB ~ 2D Analysis
#TRB Buy after successfully breaking this resistance line with a short-term target of at least 15%+ and a long-term target of $300++

Tellor Tributes TRB price analysis⁉️ We don't know what caused yesterday's rise in the price of #TRB, but it is a very, very manipulative asset, just remember the “short squeeze” liquidation on New Year's night 2024.
Now the price of OKX:TRBUSDT has come to the zone where longs had been taking for more than six months, with the hope that the growth trend is about to resume.... but no...
🔽 You shouldn't short it, because it's a very manipulative asset - see p.1
🔼 But whether to take longs with the hope of increasing the deposit or sitting in a drawdown is a matter of individual choice.
We depicted our thoughts at the chart.
_____________________
Did you like our analysis? Leave a comment, like, and follow to get more

#TRB/USDT#TRB
The price is moving within a descending channel on the 1-hour frame, adhering well to it, and is heading for a strong breakout and retest.
We are seeing a bounce from the lower boundary of the descending channel, which is support at 30.84.
We have a downtrend on the RSI indicator that is about to be broken and retested, supporting the upward trend.
We are looking for stability above the 100 Moving Average.
Entry price: 28.20
First target: 29.00
Second target: 29.87
Third target: 30.84

TRBUSDT 1WTRB ~ 1W Analysis
#TRB Buy back from here with a short -term target of at least 20%+ from here.

TRBUSDT 1WTRB ~ 1W Analysis
#TRB Back to this support,. Buy from here if you still have a Conviction on this coin with a minimum target of 20%++

TRB new ath or dump?TRB pumped over 1000% in a few months. What next? BINANCE:TRBUSDT.P
Possible Targets and explanation idea
➡️Weekly chart. Fib relevant. We bounce after long accumulation around 0.27 zone
➡️Now tested and got reaction at 0.5 lvl. Red block marked sellers zone
➡️Why exactly red block because its around 0.78 + 124.56 and its a 0.5 lvl of wick fib
➡️Interesting we still not see any signals to sell like it was in 2021.
➡️It means whales can push price higher to new ath and only after that dump to main block
➡️Main block for correction will be Monthly FVG what we will forming in October
➡️Based on Money Power indicator in June 2023 we got touch of bottom on money inflow
➡️Green circle - MACD div on weekly timeframe
➡️Now we are in distribution zone where whales can start take profit (look on previous times how this zones playing out)
Hope you enjoyed the content I created, You can support with your likes and comments this idea so more people can watch!
✅Disclaimer: Please be aware of the risks involved in trading. This idea was made for educational purposes only not for financial Investment Purposes.
---
• Look at my ideas about interesting altcoins in the related section down below ↓
• For more ideas please hit "Like" and "Follow"!

TRBUSDT Analysis: Big Picture, Big WinnersFolks, I know you’re not used to these high timeframe zones , but let me tell you, the biggest winners always come from these. That’s right, TRBUSDT is all about patience and vision. This is a monthly analysis , and I want to see the real traders step up and follow this closely.
Here’s Why It’s Huge:
High Timeframe Zones: Not for the faint-hearted. This is where legends are made.
Massive Potential: You can’t beat the rewards these zones bring—pure gold, folks.
The Tools: I’m using CDV, liquidity heatmaps, volume profiles, and volume footprints to nail these levels. Only the best techniques for the best trades.
Learn From a Winner: I can teach you how to master CDV, liquidity heatmaps, volume profiles, and volume footprints . DM me if you’re serious about winning.
Remember This: The patient trader always wins. These zones demand respect, and the rewards are unmatched.
If this resonates with you, boost it, comment on it, and follow me. Let’s find the biggest trades together!
Let me tell you, folks, this is amazing. Nobody does analysis like I do. Believe me. If this helps you, don't forget to boost and comment! It’s a big deal, motivates me to share even more winning insights with you. Tremendous insights.
I keep my charts the best—clean, simple, and clear. You know it, I know it, clarity leads to better decisions. No question about it. My approach? Built on years of tremendous experience. Incredible track record. I don’t claim to know it all, but I spot high-probability setups like nobody else. Trust me.
Want to learn how to use the heatmap, cumulative volume delta, and volume footprint techniques I use to determine demand regions with stunning accuracy? Send me a private message—totally free, folks. That’s right. I help anyone who wants it, absolutely no charge. Unbelievable value.
Here’s the list—long list, great list—of some of my previous incredible analyses. Each one, a winner:
🎯 ZENUSDT.P: Patience & Profitability | %230 Reaction from the Sniper Entry
🐶 DOGEUSDT.P: Next Move
🎨 RENDERUSDT.P: Opportunity of the Month
💎 ETHUSDT.P: Where to Retrace
🟢 BNBUSDT.P: Potential Surge
📊 BTC Dominance: Reaction Zone
🌊 WAVESUSDT.P: Demand Zone Potential
🟣 UNIUSDT.P: Long-Term Trade
🔵 XRPUSDT.P: Entry Zones
🔗 LINKUSDT.P: Follow The River
📈 BTCUSDT.P: Two Key Demand Zones
🟩 POLUSDT: Bullish Momentum
🌟 PENDLEUSDT.P: Where Opportunity Meets Precision
🔥 BTCUSDT.P: Liquidation of Highly Leveraged Longs
🌊 SOLUSDT.P: SOL's Dip - Your Opportunity
🐸 1000PEPEUSDT.P: Prime Bounce Zone Unlocked
🚀 ETHUSDT.P: Set to Explode - Don't Miss This Game Changer
🤖 IQUSDT: Smart Plan
⚡️ PONDUSDT: A Trade Not Taken Is Better Than a Losing One
💼 STMXUSDT: 2 Buying Areas
🐢 TURBOUSDT: Buy Zones and Buyer Presence
🌍 ICPUSDT.P: Massive Upside Potential | Check the Trade Update For Seeing Results
🟠 IDEXUSDT: Spot Buy Area | %26 Profit if You Trade with MSB
📌 USUALUSDT: Buyers Are Active + %70 Profit in Total
🌟 FORTHUSDT: Sniper Entry +%26 Reaction
🐳 QKCUSDT: Sniper Entry +%57 Reaction
📊 BTC.D: Retest of Key Area Highly Likely
And that’s just the start. The list goes on and on, folks. It’s a tremendous list, the best. I stopped adding because, frankly, it’s tiring. So many wins. People are amazed. You can check my profile and see for yourself—winning moves, all the time. Believe me, nobody does it better.

$TRBUSDT DUMP PLAN - Limit DIP !Hello,
I would love to share my analysis with you on TRBUSDT for at least 100% move within a week.
If BTC dumps to 78-80k which is likely to dump then I have placed TRB limit without any doubt here.
Confluences:
- Weekly Liquidity Lying On My Order Block
- 1D Impulse Order Block
- Institutional Area Of Interest

TRBUSDT 1WTRB ~ 1W
#TRB If you still have Conviction on this coin,. Buy gradually within this support block,. with a short term target of at least 20%++

#TRB/USDT Ready to go up#TRB
The price is moving in a descending channel on the 1-hour frame and sticking to it well
We have a bounce from the lower limit of the descending channel, this support is at 65.90
We have a downtrend, the RSI indicator is about to break, which supports the rise
We have a trend to stabilize above the moving average 100
Entry price 67.20
First target 68.64
Second target 70.00
Third target 71.24

#TRB/USDT#TRB
The price is moving in a descending channel on the 1-hour frame upwards and is expected to continue.
We have a trend to stabilize above the moving average 100 again.
We have a downtrend on the RSI indicator that supports the rise by breaking it upwards.
We have a support area at the lower limit of the channel at a price of
62.
Entry price 70.10.
First target 77.23.
Second target 86.91.
Third target 97.86.

#TRB Double Bottom Structure📊#TRB Double Bottom Structure 📈
🧠From a structural perspective, we broke through the neckline, which means that the bullish double bottom structure is established. The ideal target area for this structure is 121.74-146.527. At present, the price has returned to the neckline support area again. You can pay attention to the long trading opportunities in this area.
Let's see 👀
🤜If you like my analysis, please like 💖 and share 💬
💕 Follow me so you don't miss out on any signals and analyze 💯
BITGET:TRBUSDT.P

TRBUSDTTRB ~ 1W
#TRB Make purchases gradually on this support block. with a short term target of at least 20%++. So far this support block continues to hold the price.

TRB/USDT is showing strong bullish potential!🚀 TRB/USDT is showing strong bullish potential! 📈💎
The TRB/USDT pair has recently broken out on smaller time frames and is now undergoing a retest of the breakout zone. This key level is acting as support, and if it holds, we could see a significant upward movement in the coming days. Volume is starting to pick up, indicating growing buying pressure, which could lead to a major breakout toward higher levels. 📊🔥
The trend is currently bullish, with key resistance levels above that could be tested soon. Traders may look for confirmation of the breakout with higher highs and strong volume to signal a continuation of the bullish trend. 🌕🚀
⚠️ This is not financial advice. Always do your own research (DYOR) before making any trading decisions. 🔍

#TRB/USDT#TRB
The price is moving in a descending channel on the 12-hour frame and is sticking to it very well and is about to break upwards
We have a bounce from the lower limit of the channel at a price of 54
We have an upward trend on the RSI indicator that is about to break, which supports the rise
We have a trend to stabilize above the moving average 100
Entry price 67.00
First target 85.00
Second target 96.91
Third target 114.70

Tellor Tributes TRB price pumping again. What next ?We personally do not want to trade a manipulative asset like $TRB.
Because we have a clear save picture of the ‘show’ in my head, when everyone was celebrating the New Year on 31/12, a team of enthusiasts bravely pumped up the #TRBUSDT price from $250 to $710 in a matter of minutes. Poor shorts man...
So:
👉 would we buy #TRB now - no
👉 is there a chance that #TRBUSD will continue to rise to $170-180 - yes
Where is it safe to buy TRB ? - not before the price reaches $70-80

Trb/usdt Breakout TRB/USDT is showing a breakout pattern on the 8-hour time frame, suggesting a potential significant bullish movement in the near future. This information is for educational purposes only and should not be considered financial advice. It is recommended to conduct your own research (DYOR) before executing any trading actions.

#TRB/USDT#TRB
We have a bearish channel pattern on a 4-hour frame, the price moves within it and adheres to its limits well
We have a green support area at the price of 100 after the price touched it and bounced from it
We have a tendency to stabilize above moving average 100
We have a downtrend on the RSI indicator that supports the price higher with a breakout
Entry price is 108.00
The first target is 122.00
The second goal is 134.00
the third goal is 145.24
