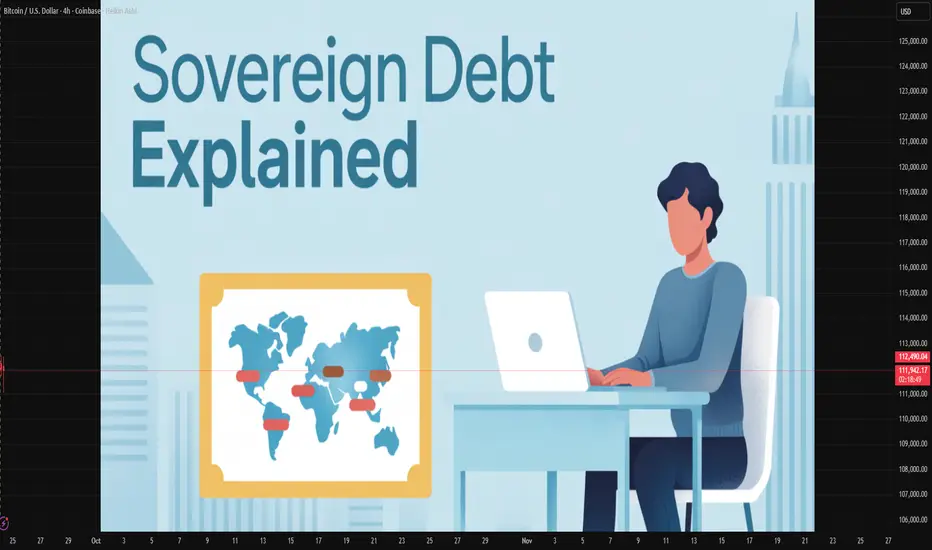
Role of Sovereign Debt in Trade Financing1. Understanding Sovereign Debt
1.1 Definition
Sovereign debt is the financial obligation of a government that arises from borrowing. It can be:
Domestic debt: Borrowed within the country, usually in local currency.
External debt: Borrowed from foreign lenders, often in international currencies like the US dollar or Euro.
1.2 Instruments of Sovereign Debt
Governments use various instruments to borrow:
Government Bonds: Tradable securities issued to investors.
Loans from Multilateral Institutions: Such as the IMF, World Bank, or regional development banks.
Bilateral Loans: From other governments.
1.3 Why Governments Borrow
Governments borrow for multiple reasons:
Financing budget deficits.
Investing in infrastructure.
Stabilizing currency and foreign reserves.
Supporting trade-related industries.
2. What is Trade Financing?
Trade financing is the set of financial instruments and products that facilitate international trade. It bridges the gap between exporters and importers by providing liquidity, mitigating risks, and ensuring smooth transactions.
Examples of trade finance include:
Letters of Credit.
Export credit guarantees.
Supplier credit.
Factoring and forfaiting.
Currency swaps and hedging tools.
Without trade financing, global trade would shrink drastically, as exporters need assurance of payment and importers need credit lines to buy goods.
3. The Link Between Sovereign Debt and Trade Financing
Sovereign debt affects trade financing in multiple ways:
3.1 Building Trust and Creditworthiness
A government that responsibly manages sovereign debt earns higher credit ratings from agencies like S&P or Moody’s. This boosts investor confidence and lowers borrowing costs for both the government and domestic firms engaged in trade. A strong sovereign credit profile ensures domestic banks and exporters can access international trade finance at affordable rates.
3.2 Foreign Exchange Reserves
Governments often borrow in foreign currency to build reserves. These reserves are crucial in trade financing because international transactions require currencies like the US dollar. Without adequate reserves, a country cannot pay for imports, and private firms struggle to secure trade financing.
3.3 Trade-Related Infrastructure Investment
Sovereign debt enables governments to invest in ports, railways, highways, and logistics networks. These investments directly reduce transaction costs in trade, making exports more competitive and imports more efficient. For example, China’s Belt and Road Initiative is partly funded by sovereign debt and has transformed trade routes globally.
3.4 Export Credit Agencies (ECAs)
Many governments issue sovereign guarantees through ECAs to support exporters. These guarantees are often underpinned by sovereign debt capacity, allowing domestic firms to secure foreign contracts. For instance, India’s Export Credit Guarantee Corporation (ECGC) provides insurance backed by sovereign borrowing capacity.
3.5 Counter-Cyclical Role
During economic downturns, sovereign debt allows governments to inject liquidity into the economy, ensuring that trade flows are not completely disrupted. For example, during the COVID-19 crisis, many governments borrowed heavily to support exporters and maintain import supply chains.
4. Historical Role of Sovereign Debt in Trade Financing
4.1 19th Century: Colonial Trade and Sovereign Borrowing
In the 19th century, European powers issued sovereign debt to finance colonial trade ventures. Countries like Britain used government borrowing to fund shipping fleets, insurance systems, and colonial infrastructure, enabling dominance in global trade.
4.2 Post-WWII Period
After World War II, war-torn economies like Germany and Japan relied on sovereign borrowing—often from the Marshall Plan—to rebuild infrastructure and revive exports. This borrowing directly laid the foundation for their transformation into export powerhouses.
4.3 Latin American Debt Crisis
In the 1980s, many Latin American countries borrowed excessively to finance development and trade imports. However, poor debt management led to defaults, which froze trade financing as credit dried up. This shows how mismanagement of sovereign debt can choke trade.
4.4 Asian Financial Crisis (1997)
Several Southeast Asian nations faced debt-driven currency collapses. Their sovereign debt vulnerability led to sudden withdrawal of foreign trade finance, highlighting how sovereign debt credibility underpins access to trade capital.
5. Benefits of Sovereign Debt in Trade Financing
5.1 Expanding Trade Volumes
By financing infrastructure, technology, and industrial growth, sovereign debt increases a country’s trade volumes. More ports, better logistics, and advanced industries translate into stronger export capacity.
5.2 Enabling Developing Countries
For many low-income nations, sovereign debt is the only way to access the capital needed to participate in global trade. Without it, they would remain excluded from international markets.
5.3 Reducing Cost of Trade Financing
When sovereign debt is well-managed, it reduces the sovereign risk premium, lowering costs for private firms seeking trade credit from global banks.
5.4 Strategic Trade Support
Sovereign debt allows governments to selectively support key export industries—agriculture, manufacturing, technology—by providing subsidies, credit guarantees, and infrastructure.
5.5 Crisis Resilience
Sovereign borrowing during crises (pandemics, wars, or recessions) helps stabilize trade flows and prevent collapse in essential imports like food and energy.
6. Risks and Challenges of Using Sovereign Debt for Trade Financing
While sovereign debt supports trade, it also brings significant risks:
6.1 Debt Overhang
Excessive sovereign debt creates a situation where future trade revenues are used to repay past debt instead of funding new trade growth. This reduces long-term competitiveness.
6.2 Currency Mismatches
Many developing nations borrow in dollars but earn export revenue in local currency. If the local currency depreciates, debt repayments become costlier, straining trade financing.
6.3 Dependency on External Credit
Over-reliance on sovereign borrowing can create vulnerability. If global lenders withdraw support, trade collapses. This happened in Argentina multiple times due to sovereign defaults.
6.4 Trade-Off with Domestic Priorities
When governments borrow heavily to support trade, they may neglect domestic welfare spending. This creates social tensions that indirectly harm trade competitiveness.
6.5 Risk of Default and Credit Freeze
A sovereign default not only isolates a country from capital markets but also directly freezes trade finance as banks avoid lending to exporters from risky nations.
7. Contemporary Examples
7.1 China’s Belt and Road Initiative (BRI)
China has used sovereign debt strategically, lending to developing nations for infrastructure that boosts global trade corridors. While it expands trade, it also risks creating “debt traps” for weaker economies.
7.2 African Nations and Commodity Trade
Many African countries borrow using sovereign bonds to build ports and export systems for oil, minerals, and agriculture. This sovereign debt has helped Africa’s trade integration but also raised concerns about unsustainable debt burdens.
7.3 India’s Sovereign Borrowing for Trade Growth
India frequently uses sovereign borrowing for building ports (like Jawaharlal Nehru Port), rail freight corridors, and renewable energy projects that support trade competitiveness.
7.4 Eurozone Debt Crisis
Countries like Greece saw their trade financing capacity collapse due to unsustainable sovereign debt levels. Import financing dried up, highlighting the delicate link between sovereign credibility and trade.
8. Sovereign Debt and Multilateral Institutions in Trade Financing
8.1 IMF and World Bank
Both institutions provide sovereign loans with trade-related conditionalities. For example, IMF stabilization packages often require reforms to maintain trade balance and ensure debt sustainability.
8.2 Regional Development Banks
The Asian Development Bank, African Development Bank, and others provide sovereign loans specifically for trade infrastructure like highways, ports, and digital connectivity.
8.3 Export-Import Banks
EXIM banks, often backed by sovereign guarantees, play a direct role in facilitating trade by financing exporters and importers.
9. Future of Sovereign Debt in Trade Financing
9.1 Green and Sustainable Debt Instruments
Sovereign “green bonds” are increasingly being issued to finance eco-friendly trade infrastructure. This links debt sustainability with global trade decarbonization.
9.2 Digital Trade Financing
Governments may issue sovereign-backed digital currencies or blockchain-based bonds to make trade financing more transparent and efficient.
9.3 Multipolar Debt Markets
As emerging economies like China, India, and Brazil deepen their sovereign debt markets, trade financing will no longer depend only on Western capital flows.
9.4 Debt-for-Trade Swaps
Innovative agreements may allow debt restructuring in exchange for trade concessions, giving a new dimension to sovereign borrowing in the trade domain.
10. Conclusion
Sovereign debt is more than just a fiscal tool—it is a cornerstone of trade financing. By enabling governments to invest in infrastructure, support exporters, stabilize currencies, and attract global capital, sovereign debt serves as the backbone of global trade. However, it is a double-edged sword. When managed responsibly, it promotes integration into global markets, reduces financing costs, and sustains growth. When mismanaged, it leads to debt crises, trade collapse, and economic stagnation.
The challenge for policymakers lies in balancing sovereign borrowing with trade competitiveness and debt sustainability. In the coming decades, innovations like green bonds, digital finance, and multilateral cooperation will redefine how sovereign debt supports trade. Ultimately, the role of sovereign debt in trade financing reflects the broader truth of globalization: finance and trade are inseparable, and the health of one determines the strength of the other.
Trdaingview
Global Supply Chain Shifts & Trade RoutesPart 1: Understanding Supply Chains and Trade Routes
What is a Supply Chain?
A supply chain is the complete journey of a product, from sourcing raw materials to manufacturing, distribution, and finally reaching consumers. It includes:
Raw materials (e.g., lithium for batteries, crude oil for fuel).
Manufacturing & assembly (factories, plants, workshops).
Logistics & transport (shipping, trucking, railways, air cargo).
Warehousing & distribution (storage, retail, e-commerce hubs).
End consumers (you and me).
What are Trade Routes?
Trade routes are the physical pathways (land, sea, or air) that connect countries and regions for commerce. Historically, these routes were shaped by geography and politics—like the Silk Road or the Spice Route. Today, they are dominated by major shipping lanes, railways, and digital trade corridors.
Part 2: Historical Evolution of Global Trade Routes
Ancient Trade Networks
Silk Road connected China with Europe, spreading silk, spices, and culture.
Maritime Spice Routes linked India, Southeast Asia, and the Middle East.
Trans-Saharan Routes carried gold, salt, and slaves across Africa.
Colonial Era & Maritime Dominance
European powers built sea empires, controlling trade in spices, tea, and cotton.
The discovery of sea routes around Africa and to the Americas reshaped global trade.
Colonization integrated global economies but created exploitative patterns.
Industrial Revolution & Global Integration
Railways and steamships shortened trade times.
The Suez Canal (1869) and Panama Canal (1914) became game-changers.
New manufacturing hubs emerged, fueling trade growth.
20th Century & Globalization
After World War II, institutions like WTO, IMF, and World Bank promoted open trade.
Containerization in the 1950s revolutionized logistics.
Asia, particularly China, became the world’s factory.
Part 3: Modern Supply Chains – How They Work
Modern supply chains are highly globalized and interdependent. For example:
An iPhone involves design in the U.S., chip production in Taiwan, assembly in China, and raw materials from Africa.
A car may have parts from Germany, software from India, steel from Japan, and be assembled in Mexico.
Features of Modern Supply Chains
Just-In-Time (JIT) Systems – reduce inventory costs but create vulnerabilities.
Multi-Country Production – different stages spread worldwide.
Specialization – each region focuses on what it does best (e.g., Vietnam in textiles, Taiwan in semiconductors).
Speed & Efficiency – enabled by digital tracking, AI, and automation.
Part 4: Major Shifts in Global Supply Chains
Global supply chains are not static. Recent decades have seen shifts driven by multiple forces:
1. Geopolitical Realignments
US-China trade war led to tariffs, restrictions, and diversification.
Countries like Vietnam, India, and Mexico became alternative manufacturing hubs.
New blocs (e.g., BRICS+, ASEAN) are reshaping trade patterns.
2. Pandemic Disruptions
COVID-19 exposed vulnerabilities: shipping delays, factory shutdowns, semiconductor shortages.
“Resilience” became a buzzword, with firms adopting China+1 strategies.
3. Technological Advancements
Automation, AI, and robotics reduce reliance on cheap labor.
Digital supply chains improve tracking and forecasting.
3D printing could localize production.
4. Environmental Pressures
Climate change affects shipping (melting Arctic routes, droughts in Panama Canal).
Push for green supply chains with lower carbon footprints.
ESG regulations are changing corporate strategies.
5. Regionalization & Nearshoring
Companies are moving closer to consumer markets.
Example: U.S. firms shifting from China to Mexico (nearshoring).
Europe considering North Africa and Eastern Europe.
Part 5: Key Global Trade Routes Today
1. Maritime Routes (80% of world trade by volume)
Suez Canal (Egypt) – shortcut between Europe and Asia.
Panama Canal (Central America) – connects Atlantic and Pacific.
Strait of Malacca – vital for oil and goods between Asia & the Middle East.
Strait of Hormuz – critical chokepoint for global oil supply.
2. Land Routes
China’s Belt and Road Initiative (BRI) – massive rail, road, and port infrastructure across Eurasia.
Trans-Siberian Railway – links Europe to Asia.
North-South Transport Corridor (Russia-Iran-India) – an emerging alternative.
3. Air Routes
Used mainly for high-value goods (electronics, medicines, luxury products).
Major hubs: Dubai, Singapore, Hong Kong, Frankfurt, Chicago.
4. Digital Routes
Undersea fiber-optic cables connect internet trade.
Digital trade is growing faster than physical trade.
Conclusion
The world’s supply chains and trade routes are in the middle of a historic transformation. Globalization once pushed for efficiency, low costs, and interconnectedness. Now, resilience, security, sustainability, and regional balance are the new priorities.
The Silk Roads of the past have evolved into today’s digital highways and maritime super-routes. As countries compete for influence, companies adapt strategies, and technologies redefine possibilities, the global supply chain will remain both a driver of prosperity and a barometer of geopolitical shifts.
The coming decades will not eliminate globalization but reshape it—making trade networks more regional, sustainable, and technologically advanced. In this new era, supply chains will not only determine economic success but also shape the balance of global power.

Global IPO & SME IPO TrendsIntroduction
Initial Public Offerings (IPOs) have always been a symbol of ambition, growth, and transformation. They represent the moment when a company decides to move beyond private ownership and open its doors to the public capital markets. IPOs not only provide companies with capital for expansion but also give investors an opportunity to participate in wealth creation.
Over the last few decades, IPOs have evolved significantly, shaped by globalization, technological change, regulatory reforms, and shifting investor behavior. In addition to traditional large-cap IPOs, the rise of Small and Medium Enterprise (SME) IPOs has been a defining trend in recent years, especially in developing markets like India, Southeast Asia, and parts of Africa.
This paper explores global IPO trends and SME IPO dynamics, examining how the landscape has transformed, the challenges and opportunities it presents, and what the future holds.
Part I: The Global IPO Landscape
1. Historical Overview
Early IPOs: The concept of public share issuance dates back to the 1600s with the Dutch East India Company, which allowed investors to buy shares in overseas trade.
20th Century Boom: IPOs became mainstream in the U.S. and Europe during the industrial boom, with companies in oil, steel, and manufacturing driving listings.
Dot-Com Bubble (1990s-2000s): Technology IPOs surged in the late 1990s, many without strong fundamentals, leading to the dot-com crash in 2000.
Post-2008 Era: After the global financial crisis, IPO markets slowed but revived with technology giants like Facebook, Alibaba, and Uber entering the public space.
2. Regional IPO Hotspots
United States: Still the largest IPO market by value. Nasdaq and NYSE dominate global tech and unicorn listings.
China & Hong Kong: Became global leaders in IPO volumes, especially in technology, fintech, and manufacturing. Hong Kong has been a preferred listing destination for Chinese firms.
Europe: More selective, with strong activity in London, Frankfurt, and Amsterdam.
India: A rising star, with both large-cap IPOs and booming SME IPOs. Retail participation is strong.
Middle East: Saudi Arabia’s Aramco IPO (2019) became the world’s largest, showing the region’s growing importance.
3. Global IPO Trends in Numbers
IPO activity tends to move in cycles, often tied to macroeconomic conditions, liquidity availability, and investor sentiment.
2020-2021: Record IPO activity, fueled by low interest rates, stimulus-driven liquidity, and tech growth during COVID-19.
2022-2023: IPO slowdown due to inflation, interest rate hikes, and geopolitical tensions (Ukraine war, US-China rivalry).
2024-2025: Signs of revival, with AI, EV, renewable energy, and fintech companies leading the pipeline.
Part II: Factors Shaping IPO Markets
1. Macroeconomic Environment
Interest Rates: Low rates encourage risk-taking and IPOs; high rates deter them.
Liquidity: Abundant global liquidity fuels IPO demand.
Geopolitics: Wars, trade disputes, and regulatory crackdowns influence cross-border IPOs.
2. Sectoral Trends
Technology: AI, semiconductors, SaaS, and fintech dominate listings.
Green Energy: EVs, solar, wind, and hydrogen IPOs attract ESG-focused investors.
Healthcare & Biotech: Rising due to pandemic learnings and aging populations.
Consumer & Retail: Still strong, but facing disruptions from e-commerce.
3. Regulatory Environment
The U.S. SEC, Europe’s ESMA, and Asian regulators have tightened disclosure norms.
China has restricted overseas listings of sensitive tech companies.
India’s SEBI has become stricter but supportive of SME and tech listings.
Part III: Rise of SME IPOs
1. Why SME IPOs Matter
SMEs are the backbone of most economies, contributing 30–60% of GDP in many countries.
Access to capital markets allows SMEs to reduce dependence on banks and private equity.
SME IPOs democratize wealth creation by involving retail investors.
2. India as a Case Study
India has emerged as a global leader in SME IPOs.
Platforms like NSE Emerge and BSE SME Exchange have hosted hundreds of SME listings.
Retail investors flock to SME IPOs due to small ticket sizes and potential for multi-bagger returns.
In 2023–2025, SME IPOs in India often delivered stronger short-term gains than large IPOs.
3. Global SME IPO Landscape
China: Has STAR Market for tech-driven SMEs.
Europe: AIM (Alternative Investment Market) in London supports SME listings.
U.S.: Nasdaq SmallCap and OTC markets exist, but venture capital dominates.
Africa & Middle East: Nascent SME IPO frameworks are being developed.
4. Key Challenges
Liquidity Issues: SME IPOs often face thin trading volumes.
Governance: Risk of weak disclosure and manipulation.
Investor Education: Retail investors sometimes underestimate risks.
Part IV: Investor Behavior & Market Psychology
1. Institutional vs Retail Investors
Institutional investors dominate large-cap IPOs.
Retail investors are increasingly active in SME IPOs.
Behavioral biases — such as FOMO (Fear of Missing Out) — drive oversubscriptions.
2. IPO Pricing & Valuation Dynamics
Companies often price aggressively, leading to mixed post-listing performance.
The “listing pop” culture attracts traders seeking quick gains.
3. The Role of Anchor Investors
Anchor investors provide credibility to IPOs and influence demand.
Part V: Risks and Challenges in IPO Markets
Volatility: IPOs are highly sensitive to market sentiment.
Regulatory Crackdowns: Sudden changes (like China’s tech crackdown) disrupt IPO pipelines.
Post-IPO Underperformance: Many IPOs fail to sustain valuations beyond the first year.
Speculative Bubbles: Retail-driven hype can inflate SME valuations unsustainably.
Part VI: The Future of IPOs & SME IPOs
1. Technology’s Role
Digital Platforms: E-IPO applications and online brokerages increase retail participation.
Blockchain & Tokenized IPOs: A possible future trend where companies raise funds via tokenized shares.
AI in Valuation: Algorithms now play a role in IPO pricing and demand analysis.
2. ESG & Sustainable Finance
Investors increasingly prefer companies with Environmental, Social, and Governance (ESG) credentials.
Green IPOs (renewable energy, EV, sustainability tech) will dominate.
3. Globalization vs Protectionism
While globalization pushes for cross-border listings, geopolitics may encourage companies to list domestically.
India, China, and Middle East will become more self-reliant IPO hubs.
4. SME IPOs Outlook
SME IPOs will expand rapidly in Asia and Africa, where small businesses dominate.
Regulatory reforms and investor education will decide sustainability.
Conclusion
The global IPO market is a mirror of the world economy, reflecting growth cycles, technological revolutions, and investor sentiment. While traditional large-cap IPOs continue to capture headlines, the rise of SME IPOs represents a deeper democratization of finance.
SMEs, once constrained by limited access to capital, are now using public markets to scale up, attract visibility, and create wealth for investors. Markets like India, China, and the Middle East are emerging as epicenters of SME IPO growth, while the U.S. and Europe remain leaders in large-cap listings.
Going forward, IPO trends will be shaped by AI, ESG, fintech innovations, and shifting geopolitics. Investors and regulators must balance opportunity with caution, especially in SME IPOs where risks are higher but so are the rewards.
In short, IPOs — both global and SME-focused — will continue to remain a critical engine of capital formation, innovation funding, and wealth creation in the evolving global economy.
Cross-Border Listings and Dual-Listed CompaniesIntroduction
In today’s interconnected financial world, companies are no longer confined to raising capital solely in their domestic markets. Increasing globalization, advancements in technology, and integration of capital markets have paved the way for businesses to list their shares beyond their home country. Two significant strategies that companies adopt to tap international investors are cross-border listings and dual listings.
A cross-border listing occurs when a company lists its equity shares on a stock exchange outside its home country. For example, Alibaba, a Chinese company, listing its shares on the New York Stock Exchange (NYSE) in 2014 is a classic case of cross-border listing.
On the other hand, a dual listing (sometimes called a "dual-listed company" or DLC structure) is when a company is simultaneously listed on two stock exchanges, usually in different countries, and both sets of shares represent the same ownership rights. For instance, Royal Dutch Shell historically operated under a dual-listed structure between the UK and the Netherlands before unifying in 2022.
This essay explores the concepts of cross-border listings and dual-listed companies in detail, analyzing motivations, processes, challenges, advantages, risks, case studies, and their broader impact on global capital markets.
Part 1: Understanding Cross-Border Listings
What is a Cross-Border Listing?
A cross-border listing refers to the practice where a company headquartered in one country seeks to have its shares traded on an exchange in another country, in addition to or instead of its home market. This is often achieved through mechanisms such as:
Direct Listing – where shares are directly listed on the foreign exchange.
Depositary Receipts (DRs) – such as American Depositary Receipts (ADRs) in the U.S. or Global Depositary Receipts (GDRs) in Europe, which represent shares of foreign companies.
Cross-border listings provide visibility, credibility, and access to broader pools of investors.
Motivations for Cross-Border Listings
Access to Larger Capital Pools
Listing on global exchanges like NYSE, NASDAQ, or London Stock Exchange (LSE) allows firms to attract institutional investors and hedge funds that may not invest in emerging or smaller domestic markets.
Enhanced Liquidity
International listings improve trading volumes and reduce bid-ask spreads, providing shareholders with more liquidity.
Prestige and Visibility
Being listed on prestigious exchanges boosts the company’s brand recognition and signals financial strength. For example, many tech companies aim for a U.S. listing for global visibility.
Diversification of Investor Base
Companies can mitigate reliance on a single country’s investor sentiment by tapping into international investors with different risk profiles.
Strategic Expansion
Firms expanding globally may list abroad to strengthen their presence in target markets. For instance, Tata Motors listed ADRs in the U.S. as it acquired Jaguar Land Rover to align with Western investors.
Improved Valuation
Investors in developed markets often assign higher valuations due to better liquidity, lower perceived risk, and stronger corporate governance requirements.
Mechanisms of Cross-Border Listing
American Depositary Receipts (ADRs)
Non-U.S. companies issue ADRs to trade on U.S. exchanges. ADRs are denominated in USD and simplify investment for U.S. investors. Example: Infosys trades as ADRs on NYSE.
Global Depositary Receipts (GDRs)
Used primarily in European and Asian markets, GDRs allow companies to raise funds in multiple regions.
Direct Listings
Companies directly register their ordinary shares in a foreign market.
Secondary Listings
Some companies maintain a primary listing in their home country while pursuing secondary listings abroad.
Advantages of Cross-Border Listings
Cheaper capital costs – Broader investor demand reduces the cost of equity.
Global credibility – Enhanced corporate reputation and international media coverage.
Investor protection perception – Stricter regulatory environments provide comfort to foreign investors.
Potential currency hedging – Raising funds in multiple currencies may help offset forex risks.
Challenges in Cross-Border Listings
Regulatory Burden
Complying with multiple jurisdictions (e.g., U.S. SEC rules like Sarbanes-Oxley Act) can be costly and complex.
Accounting Standards
Firms may need to reconcile financial statements between different accounting standards (e.g., IFRS vs. U.S. GAAP).
Costs
Listing fees, legal advisory costs, auditing, and compliance expenses are significantly higher.
Risk of Overexposure
Greater scrutiny from international investors, analysts, and media can pressure management.
Delisting Risks
If trading volumes are low, foreign exchanges may consider delisting (e.g., Chinese firms facing U.S. delisting threats in 2020–22).
Part 2: Understanding Dual-Listed Companies (DLCs)
What is a Dual Listing?
A dual-listed company structure involves two corporations incorporated in different countries agreeing to function as a single entity for strategic and economic purposes while maintaining separate legal entities. Shares of both companies trade on their respective stock exchanges, but shareholders share common ownership and voting rights.
For example:
Royal Dutch Shell (Netherlands & UK, until 2022).
BHP Group (Australia & UK).
Why Choose Dual Listings?
Market Accessibility
Dual listings allow companies to raise funds simultaneously in multiple regions.
Regulatory Flexibility
Companies may avoid high costs of cross-border compliance by splitting structures.
National Interests
Governments may push for dual listings to protect local investor participation and maintain corporate identity.
Mergers and Acquisitions
Dual structures often arise from cross-border mergers (e.g., BHP and Billiton).
Advantages of Dual-Listed Structures
Equal Treatment of Shareholders
Shareholders in both countries maintain equal economic and voting rights.
Investor Base Expansion
Encourages domestic investors in both regions to invest without currency or foreign-exchange hurdles.
Synergies Without National Loss
Companies retain national identity while operating as one entity, politically acceptable in sensitive sectors.
Strategic Flexibility
Helps maintain listings in home and host countries simultaneously.
Challenges of Dual Listings
Complex Corporate Governance
Coordinating two boards, shareholder meetings, and legal jurisdictions is administratively heavy.
Arbitrage Opportunities
Share prices in both markets may diverge due to currency fluctuations or investor sentiment, inviting arbitrage.
Taxation Complexities
Differing tax regimes can complicate dividend distribution and profit allocation.
Eventual Simplification Pressure
Many DLCs eventually simplify into a single listing due to inefficiencies (e.g., Unilever ended its dual listing in 2020).
Part 3: Cross-Border Listings vs. Dual Listings
Feature Cross-Border Listing Dual-Listed Company
Structure Single entity listed abroad Two entities operating as one
Investor Base International investors Both domestic and foreign investors
Governance Centralized Complex, two boards
Liquidity Concentrated in one market Split between two markets
Examples Alibaba (NYSE), Infosys (NYSE ADRs) BHP (Australia & UK), Shell (UK & NL)
Regulatory Compliance Multiple jurisdictions for one entity Two legal systems, harmonized by agreements
Part 4: Case Studies
Case Study 1: Alibaba’s U.S. Listing (2014)
Alibaba raised $25 billion in its NYSE IPO, the largest in history at the time. The listing gave Alibaba global visibility, access to U.S. investors, and enhanced credibility. However, political tensions and U.S. scrutiny later forced Alibaba to also pursue a dual primary listing in Hong Kong (2019) to hedge regulatory risks.
Case Study 2: Royal Dutch Shell
Shell operated for decades as a dual-listed company with separate UK and Dutch entities. While this allowed national identity retention, it eventually simplified in 2022 into a single UK-based entity to cut administrative costs and simplify dividend taxation. This demonstrates the long-term inefficiencies of DLC structures.
Case Study 3: Infosys ADRs in the U.S.
Infosys pioneered the ADR model among Indian IT firms. By listing on NYSE in 1999, Infosys attracted U.S. institutional investors, boosted transparency through U.S. GAAP compliance, and improved its global brand recognition.
Case Study 4: BHP Billiton Dual Listing
BHP (Australia) and Billiton (UK) merged in 2001 using a dual-listed company structure to respect national interests. The DLC allowed both companies to share profits and operate as one without full legal merger. In 2022, however, BHP simplified by unifying its structure in Australia, citing complexity costs.
Part 5: Impact on Global Capital Markets
Integration of Capital Markets
Cross-border listings and DLCs bring investors from multiple geographies into closer alignment.
Corporate Governance Improvements
To qualify for international listings, companies often adopt stricter governance standards, benefiting shareholders globally.
Capital Flow Diversification
Emerging market companies gain access to developed market capital, reducing dependency on local investors.
Political and Regulatory Frictions
As seen in U.S.-China tensions, foreign listings can become entangled in geopolitical disputes.
Part 6: Future Trends
Rise of Asian Financial Centers
Hong Kong, Singapore, and Shanghai are emerging as attractive alternatives to New York and London.
Technological Advancements
Blockchain-based securities and digital exchanges may redefine how companies pursue cross-border listings.
Regulatory Harmonization
Efforts like the EU’s capital markets union and IFRS adoption may simplify compliance for multinational companies.
Shift Toward Secondary Home Listings
Many firms may adopt secondary listings in home regions (like Alibaba in Hong Kong) as a hedge against foreign political risks.
Conclusion
Cross-border listings and dual-listed companies are powerful mechanisms enabling firms to expand investor bases, access global capital, and enhance international presence. While cross-border listings emphasize visibility and liquidity in foreign markets, dual listings balance political, cultural, and economic interests across nations.
Both models bring opportunities—such as higher valuations and global credibility—and challenges—like regulatory burdens, governance complexity, and geopolitical risks. Over time, trends show that while cross-border listings remain popular, dual-listed structures often simplify into single listings due to inefficiencies.
Ultimately, as capital markets continue to globalize and technology reduces geographic barriers, the future will likely see innovative models of cross-border capital raising that blend the strengths of these existing approaches while minimizing their limitations.
Gold next move 💥💥👇hello trader’s what do you think about Gold usd ) analysis ideas 💡??
…………………………………………………🧐
Gold usd …………………………….🧐
Analysis …………………………………🧐
Support levels………2068———🎚️
Support levels………2026———🎚️
Resistance levels ………2147
Trader’s follow support and )resistance levels 👍🏻💡)
Pales like 👍🏻 and comments)

BANK NIFTY INTRADAY LEVELS FOR 01/08/2023BUY ABOVE - 45680
SL - 45600
TARGETS - 45800,45940,46100
SELL BELOW - 45600
SL - 45680
TARGETS - 45470,45290,45100
Previous Day High - 45680
Previous Day Low - 45360
If Bank Nifty breaks that trend line... We will see fast momentum into Downside
I am sharing BANK NIFTY levels this levels acts as important support & resistance for intraday. if you want to trade with this levels wait for 15 min Candle closing above that levels. You can trade with breakout and reversal both.
Based on price action major support & resistance's are here, the red lines acts as resistances, the green lines acts as supports. If the price breaks the support/resistance, it will move to the next support/resistance line. White lines indicates previous day high & low, high acts as a resistance & low acts as a support for next day.
Trendlines are also significant to price action. If the price is above/below the trendlines, can expect an UP/DOWN with aggressive move.
Please NOTE: this levels are for intraday trading only.
Disclaimer - All information on this page is for educational purposes only,
we are not SEBI Registered, Please consult a SEBI registered financial advisor for your financial matters before investing And taking any decision. We are not responsible for any profit/loss you made.
Request your support and engagement by liking and commenting & follow to provide encouragement
HAPPY TRADING 👍

Btcusdt Hello dea trader or investor
Today we share btcusdt
It’s back hit already 30k$
So according to us he will go fly more it’s our perdition
What’s you think about it?

BtcusdtHello dear Trader Or Investor
This chart related about btcusdt so according to this chart btcusdt try to more fall
What you think about it?
Like and comment plz

ADANIPOWER - ABCD PatternAdani power is sustaining 240-345 levels from the past few trading sessions, stock prices also look good on the daily and weekly timeframe.
Hance sustaining 340 levels, the stock could move towards 355 - 360 levels in the coming trading session.
Type of Trade: Swing Trade
Buy on the dip and build up on the way up.
CMP: 348
Buying zone 345-344
Stop loss below 340
Target : 355- 360

BTC/USDT Norozeton mobarak bashe man fek konam ta akhare sal trad konam dame sale tahvil dashtam Bitcoin short mikardam
Sale khobi dashte bashid hamegi
While trading always manage your position
Still short

USOIL rises to highest since 2014, What's next !Hello everyone, as we all know the market action discounts everything :)
_________________________________Make sure to Like and Follow if you like the idea_________________________________
Oil prices rose for a fifth day on Wednesday to their highest since 2014 amid global concerns about energy supply on signs of tightness in crude, natural gas, and coal markets.
WTI earlier rose to $79.47 a barrel this started from $73.62 5 days ago, almost an 8% increase in value.
Possible Scenarios for the market :
Scenario 1 :
The market is trading at 78.91 at the time of this post, Bears has been quiet for the last 5 days which leads us to believe that any time soon they will be ready to step in and drop the price, most likely they will have 2 goals for the next period of time. The first one will be the support line at 77.95 and the main goal for the week will be the 73.86 support zone.
Scenario 2 :
The bulls are trying to keep this upper momentum as much as they can but today's candle is red at the time of the post, Which shows the ongoing battle between the Bulls and Bears.
The Bulls will try to push the price above the first resistance located at the $80.00 level so they can set up a support base and from there they will try to push the market more in hope of reaching the $82.00 by the end of the week
Technical indicators show :
1) The market is above the 5 10 20 50 100 and 200 MA and EMA (Strong Bullish sign)
2) The MACD is above the 0 line indicating that the market is in a Bullish state, With a positive crossover between the MACD line and the Signal line.
3) The ADX is at 22.20 showing that the market is trending with a positive crossover between the DI+ and DI-
Daily Support & Resistance points :
support Resistance
1) 77.95 1) 79.95
2) 76.78 2) 80.78
3) 75.95 3) 81.95
Fundamental point of view :
OPEC+ agreed to adhere to its July pact to boost output by 400,000 barrels per day (bpd) each month until at least April 2022, phasing out 5.8 million bpd of existing production cuts.
Late last month, the OPEC+ Joint Technical Committee (JTC) said it expected a 1.1 million bpd supply deficit this year, which could turn into a 1.4 million bpd surplus next year.
Oil prices have surged more than 50% this year, adding to inflationary pressures that crude-consuming nations such as the United States and India are concerned will derail recovery from the COVID-19 pandemic.
Despite pressure to ramp up output, OPEC+ was concerned that a fourth global wave of COVID-19 infections could hit the demand recovery, a source told Reuters a little before Monday's talks.
However, inventory data from the United States, the world's biggest oil consumer, showed some signs of slowing fuel demand.
The American Petroleum Institute reported U.S. oil inventories rose by 951,000 barrels in the week to Oct 1. According to Reuters
This is my personal opinion done with technical analysis of the market price and research online from Fundamental Analysts and News for The Fundamental point of view, not financial advice.
If you have any questions please ask and have a great day !!

VirnetX Holding CorpI recommend investing in this, which is expected to rise this entire week, depending on our analysis
VirnetX Holding Corp : is a publicly traded Internet security software and technology company based in Zephyr Cove, Nevada. VirnetX has been described as being a patent troll, accused of marketing no actual products or services and instead earning its revenue through licensing patents and suing anyone that infringes them.The company has won intellectual property litigation against various technology companies.The firm is run by Kendall Larsen and his family.
