BTC Pullback: Key Support at $99,800 – Next Move?#Bitcoin is currently experiencing a pullback, likely triggered by news, such as President Trump’s tariff announcement on China.
The price is hovering around $110,500, but it doesn’t look strong enough to hold at this level, so a move toward $99,800 is possible. The 0.5 Fibonacci retracement at $99,800 acts as a key demand zone. However, the RSI isn't oversold yet, which means there’s potential for further downside if this support breaks.
In my opinion, the best approach right now is to wait for some confirmation.
Stay tuned and follow for more updates, and if you're stuck in any coin, feel free to DM me I’ll do my best to help you out.
CRYPTOCAP:BTC BITSTAMP:BTCUSD BINANCE:BTCUSDT
Treandanalysis

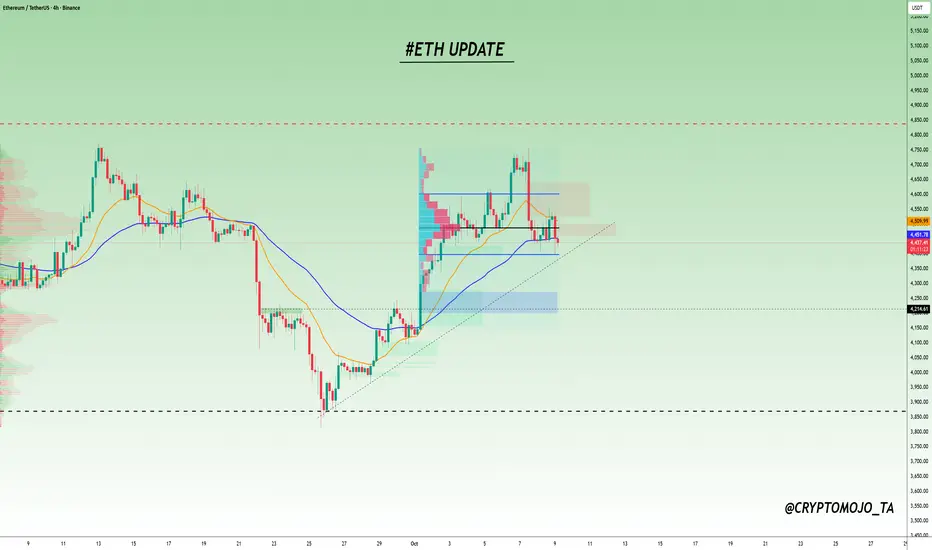
$ETH Update !!CRYPTOCAP:ETH Update
#Ethereum is facing significant resistance between $4,450 and $4,550. After rejecting the recent local highs, it’s currently holding the 55 EMA (green) as short-term support. However, it’s getting squeezed between the 21 EMA (yellow) above and a high-volume node on the Volume Profile, which acts as a heavy liquidity zone.
If ETH fails to reclaim the high-volume node and starts closing below the 55 EMA, we might see further downside towards the $4,200 support area.
ETH has already broken structure to the downside, showing weakness. If price closes below $4,397 (Value Area Low of the current range), we could see a continuation toward the $4,200 bullish FVG zone.
Key Levels to Watch:
Resistance: $4,450–$4,550
Support: $4,250
A break below $4,397 confirms more downside toward $4,200.
CRYPTOCAP:ETH BITSTAMP:ETHUSD BINANCE:ETHUSDT
TOTAL 3 UPDATE !!The TOTAL3 chart is showing some cautionary signs but has not yet broken the key trendline. The price is testing this support level, and a breakout below the trendline will be crucial for determining the next move. Currently, the price is holding above the trendline, but if we see a close below this level, it would signal further weakness in the altcoin market.
Key Levels to Watch:
> The trendline is still intact, but a 4-hour candle close below this could trigger downside pressure.
> The first major support sits around $1.09T. If the price reaches this level and reacts positively, we could see a bounce.
> The next potential support zone is at $1.07T, where more significant buying might come into play.
For now, we remain cautious and need confirmation through price action for any further moves down.
#Altcoins #CryptoTrading

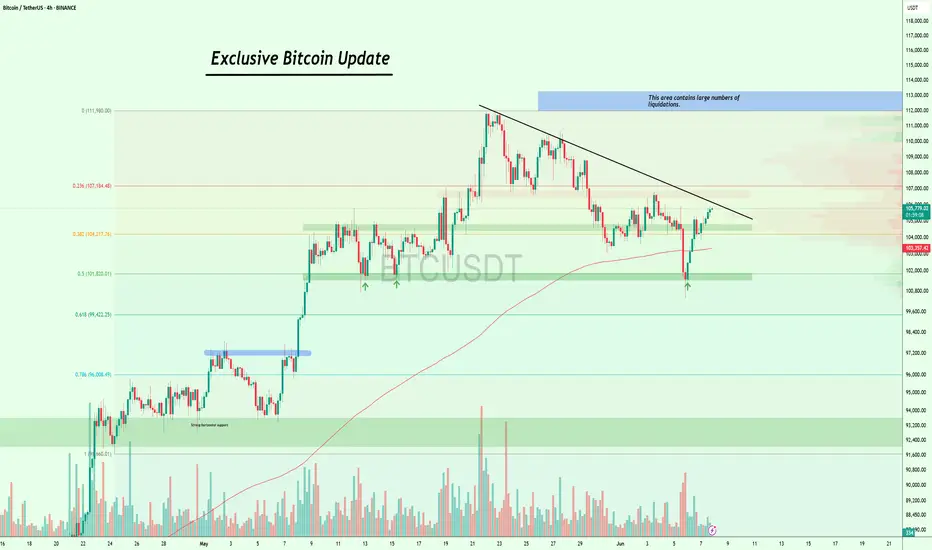
#Bitcoin Weekly Update !!#BTC UPDATE
#Bitcoin has printed a new weekly high, confirming the ongoing strength of the broader uptrend. Both the 21 EMA (yellow) and the 55 EMA (green) are trending upward, indicating that medium-term momentum remains bullish.
The key structural level to focus on is the former weekly resistance around $120,000, which Bitcoin has successfully broken above. As long as the price holds above this level on a closing basis, the bullish bias will remain intact.
If the breakout holds, the next potential target lies in the mid-$130K range.
However, if Bitcoin closes below $120,000, the move would be neutralized, potentially opening the door for a retest of the EMAs in the $112K–$114K zone.
For now, both the trend structure and EMAs suggest that the continuation of this bullish trend is likely.
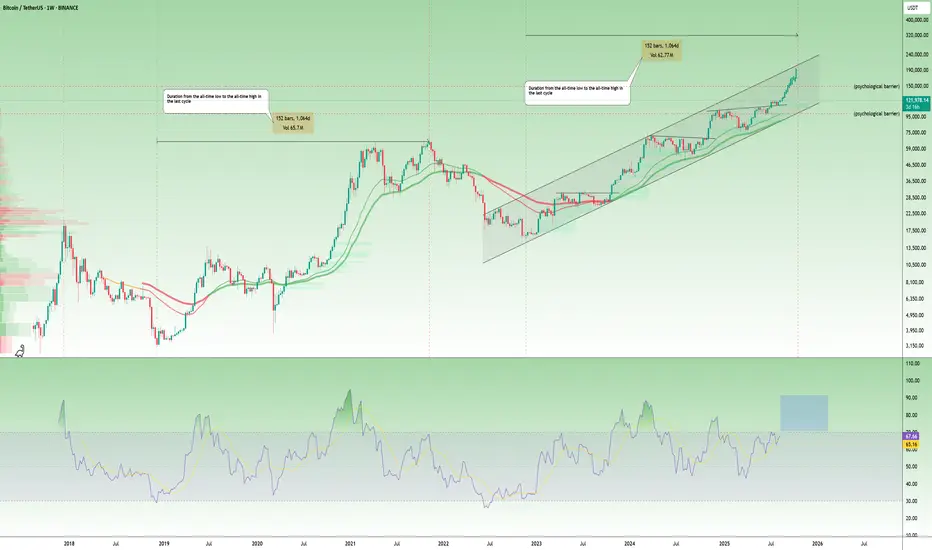
$BTC is repeating history, and it’s doing it with precision.CRYPTOCAP:BTC is repeating history, and it’s doing it with precision. 📈
In the last cycle, it took Bitcoin 1,044 days to move from the bear market bottom to a new all-time high. This cycle is on the same timeline, and we’re now well into that phase.
Price is staying inside the long-term rising channel, and momentum is building. If this continues, a macro top could form between late October and early November, maybe even by the first week of October if the rally speeds up.
The RSI is also climbing toward the same overbought levels seen before past tops. The cycle pattern isn’t random.
It’s the guide.
Q3 Could Be Big for #ETH, Breakout Watch ON#ETH bounced exactly from the 0.5 level of Fib Retracement, as expected.
Now it appears to be gearing up for its next breakout move!
After weeks of chopping inside a falling channel, ETH is showing signs of strength. It's reclaiming key levels and slowly pushing toward the breakout zone near $2,520.
A breakout above this resistance could trigger a sharp move toward $2,880 and beyond.
However, bulls need to hold the $2,300 zone, a drop below might delay the pump.
Structure is bullish, just needs confirmation.
IMO, Q3 could be massive for ETH.
Like & retweet for more updates.
#Ethereum

$BTC Consolidating Before the Next Big Move?CRYPTOCAP:BTC consolidating after a strong bounce!
Bitcoin is holding well above the 106K support zone and forming a tight range just below resistance.
After a false breakout above 100K, the price is compressing just below key resistance at 108100.
This consolidation between 106500 and 108100 looks like a pause, not a top.
If BTC breaks 108100, the next targets are 110500 and ATH.
Market structure is still bullish.
A retest of 106500–105650 is possible before liftoff.
Are you positioned for the breakout?
If you find my updates helpful, don’t forget to like and follow for more!
DYOR, NFA
#BitcoinRecovery

GOLD Bouncing from Trendline, Breakout Ahead?GOLD BOTTOM IS HERE 🔥
Gold has taken support from the rising trendline and is now close to breaking a key resistance. The chart is showing an ascending triangle, which usually means a big move is coming.
If price breaks above the resistance, we might see a strong rally of 13% or more.
The setup looks positive as long as the support stays strong.
Looks like Gold is ready to shine again!
Retweet if you're bullish.
Like and follow for more updates!
#GOLD TVC:XAU

#Ethereum Update!!CRYPTOCAP:ETH has broken below the $2,308 resistance zone and is now trading lower.
Price is approaching a key demand area around $2,132–$2,000, where we’ve seen strong buyer reactions in the past.
IMO, if bulls step up and defend this zone, we could see a recovery bounce aiming for $2,526, the next major resistance ahead.
I’ll keep you updated as things develop.
If you find my updates helpful, don’t forget to like and follow for more! DYOR, NFA

#Bitcoin is approaching a strong demand zone!#Bitcoin is approaching a strong demand zone!
This level has acted as solid support several times in the past.
According to the Fibonacci levels, we’re currently at the 0.5 level, which makes this area even more significant.
In my opinion, we’re likely to see a bounce from here.
However, if the price fails to hold this level, there’s a good chance we’ll retest the $92K zone.
But for that to happen, we need a daily close below $100K.
Until then, we’re still in a safe zone.
I’ll keep you updated as things develop.
If you find my updates helpful, don’t forget to like and follow for more!
DYOR, NFA

$PNUT in Freefall – Can $0.20 Hold as Support?$PNUT is dropping like a falling knife!🚨
Technically, we have support around $0.22 and $0.20.
According to the Fibonacci levels, the 0.786 level may
act as strong support near $0.20, making that area a key zone to watch.
So unless this support range is reached, the price may continue to drop toward that zone.
If you're currently stuck in this coin, you could consider adding funds and setting your liquidation point below $0.18 for safety.
If you're looking to enter or accumulate, the range between $0.22 and $0.20 is ideal for accumulation.
However, even with these support levels, we still need to wait for clear reversal patterns before expecting a trend reversal in the shorter time frame.
Thank you so much for reading, I hope my updates help you in your trading journey.
DYOR, NFA

No Change in Plan! $BTC Targeting Major Liquidation ZoneAs I warned you guys, CRYPTOCAP:BTC came down to the $100K exactly as expected, and then we bounced from the $100K level!
That lower trendline once again acted as strong support, just as expected.
Now #Bitcoin is pushing back up toward the major trendline and eyeing the $107K–$112K zone, which holds large liquidations.
No changes in the game plan, watching the daily and weekly closes closely.
If Bitcoin breaks above this trendline clearly, we could see a strong move up. 🚀
I’ll keep you posted as things unfold. If you find my updates helpful, don’t forget to like and follow for more!
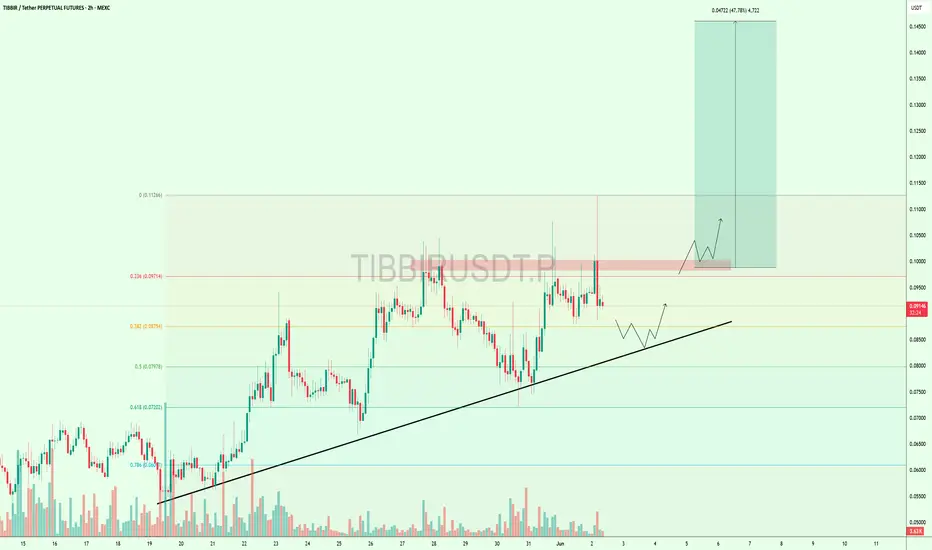
Price Cooling Off – But $TIBBIR Still Looks Bullish$TIBBIR is trying to break above the 0.097 resistance, but it hasn’t succeeded yet.
The price is now pulling back and might test the uptrend support line around 0.085–0.087. This area has helped the price bounce before.
If the support holds and price moves back up, we could see a strong move toward 0.1126 that’s nearly +47% higher.
Keep watching a breakout could come soon! 👀
Buyers Stepping In – Is $XAUUSD Ready to Move?Gold is still holding the key support zone around $3,285–$3,290 and slowly gaining strength.
As long as this level holds, we could see the price move up to $3,320, and if momentum stays strong, maybe even $3,340+.
The structure looks good, and buyers are stepping in.
Keep an eye on a possible breakout above the dotted trendline. 👀
#XAUUSD

Gold Holding Pattern – Key Resistance AheadHey, friends
On the 4-hour time frame, TVC:XAU is forming a symmetrical triangle pattern, but we haven’t seen any breakout yet, we’re still trading inside the triangle.
If we look at the LTF, we’re currently at the 0.236 FIB level, which isn’t a very strong buying zone, but technically, we’ve broken out of a falling wedge and are now retesting it.
That looks pretty good, and if this setup plays out well, we could see an upward move toward $3,470.
However, there’s a strong resistance around $3,350 to $3,370 that we need to break first. If we break that, it will also confirm the breakout of the symmetrical triangle from the 4-hour chart.
So keep an eye on those areas!
#GOLD #forextrading

USDT.D Forecast: Time to Buy the Dip?#USDT DOMINANCE
This is what I’d like to see happen in the next 2 days.
And I believe it will. Invalidation would be a close above 4.80%.
I’m buying the dip, guys. Let’s see how this plays out.

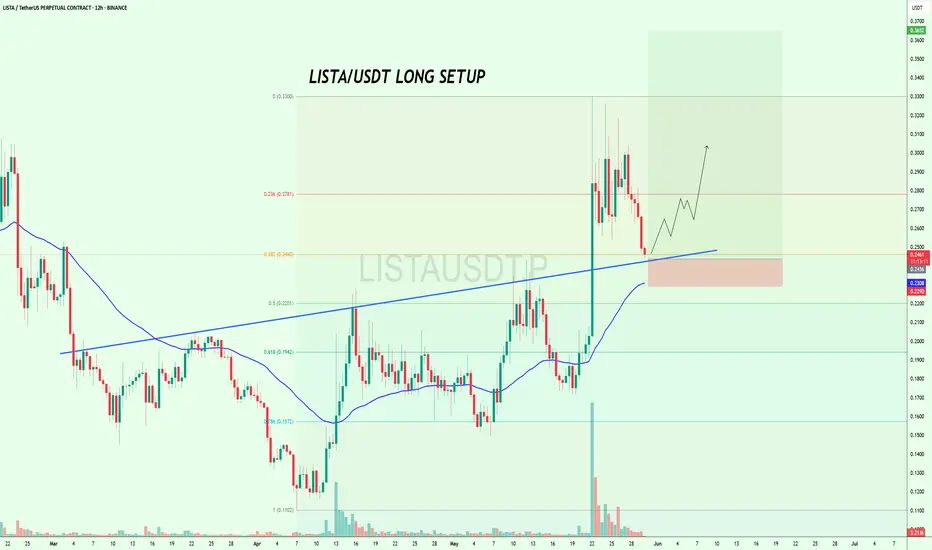
$LISTA at Key Support – Long Opportunity Loading?$LISTA looks good to long here with a short SL🚀
It is approaching a key confluence support zone right at the 0.382 Fib level (~0.2460), the rising trendline, and the 100EMA on the 12H chart.
This level held well in the last move and could once again act as the launchpad for a bullish breakout toward $0.30–$0.33.
But if it breaks below this support zone, short-term momentum could shift.
Watch how the price reacts here👀
BINANCE:LISTAUSDT
$ETH Pressing Resistance – A Break Above Could Fly!CRYPTOCAP:ETH Update
Ethereum is looking strong right now.
The price is pushing against a key resistance zone near $2,725 and forming higher lows showing pressure is building for a breakout.
If it breaks above this zone clearly, ETH could rally toward $4,000 (that’s a 55% upside).
Support to watch on the downside is around $2,465 if price pulls back.
Keep an eye on ETH, this breakout could be big.
DYOR, NFA
#ETH #Ethereum

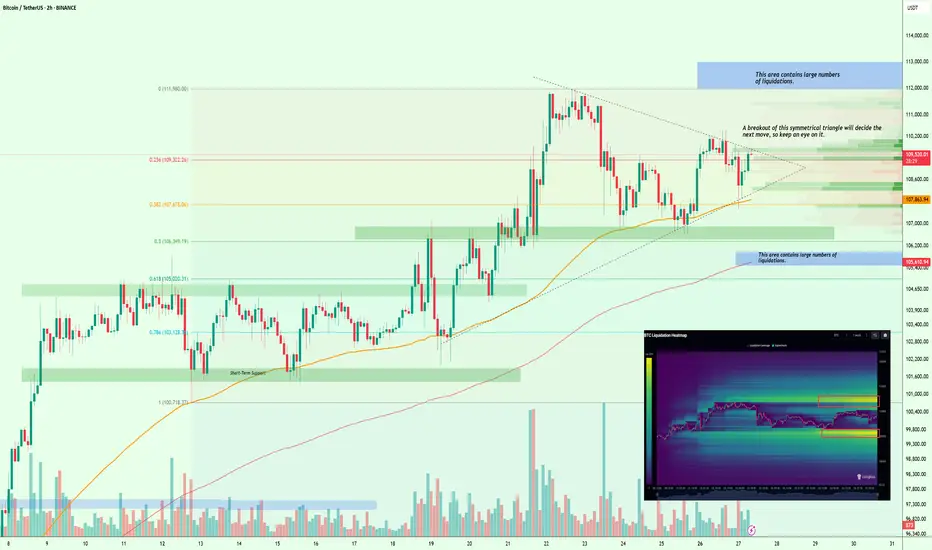
$BTC Liquidity Squeeze Incoming – Breakout or Breakdown?#Bitcoin
According to the liquidation heat map, CRYPTOCAP:BTC is building a large cluster of liquidations on both the upside and downside, creating some confusion in the market. However, the nearest major liquidation zone is around $112K–$113K, which increases the chances of a move toward that range.
Technically, BTC is forming a symmetrical triangle, and the breakout from this pattern will likely determine the next major move.
So keep a close eye on it.
I’ll keep you posted as things unfold.
If you find my updates helpful, don’t forget to like and follow for more!
$RWA Breakout Alert – Trend Reversal in Play?LSE:RWA just broke out of a falling channel with strong volume — signaling a potential trend reversal.
It’s now retesting the breakout zone near the 0.382–0.5 Fib level, which could act as a support area before the next leg up.
If this reclaim holds, upside targets extend toward $0.017+—a 40%+ move from here.
Keep it on your radar.
DYOR, NFA.

$CRO Breaks Out: Bullish Trend in Motion!CRYPTOCAP:CRO Breakout from an ascending triangle pattern and currently holding above support!
📈 Entry: Accumulate above $0.21
🎯 Targets:
Midterm: $0.32 (50% upside)
Long-term: $0.42 (100% upside)
🛡️ Stop-loss: $0.19
Available for both spot and futures trading. The pattern breakout confirms a bullish trend continuation. Manage risk carefully!
About CRO:
Cronos (CRO) powers the Crypto.com ecosystem, offering seamless payment solutions and access to decentralized finance (DeFi) tools.
Disclaimer:
This information is for educational purposes only and should not be considered financial advice. Cryptocurrency investments carry significant risk; conduct your own research (DYOR) and consult with a financial advisor before making investment decisions.
#Crypto #Altcoins #CRO

#BTCUSD 4HBTCUSD 4H Trading Setup
Buy Level: 55,600
Target Level: $66,000
The BTCUSD pair shows a promising upward trajectory on the 4-hour chart. A key buy signal is identified at the level of $55,600. This level represents a strategic entry point, aligning with current technical indicators suggesting strong support and potential for a bullish movement.
Once entered, the target level is set at $66,000, where significant resistance is expected. This target reflects a potential gain based on the current market structure and momentum.
Key Considerations:
Risk Management: Ensure proper stop-loss orders are placed to manage downside risk in case of market fluctuations.
Market Conditions: Stay updated on broader market conditions and news that might impact BTCUSD price movements.
Technical Indicators: Monitor key technical indicators such as moving averages, RSI, and MACD for any signs of trend reversal or momentum shifts.
This setup assumes favorable market conditions and is based on technical analysis; adjustments may be necessary based on evolving market dynamics.

GOLD h1 chart analysis 100%Follow the instructions.
If the price consolidates between $2502 and $2505, gold may touch the $2494 level before bouncing back to $2528. A break above the strong resistance level could potentially send gold to new all-time highs (ATH).
Bullish Opportunities:
1. 2500 - 2502
2. 2477 - 2487
Bearish Opportunities:
1. 2510 - 2512
2. 2546 - 2560 (Only if the Strong resistance level Breaks and Gold Reaches its new high).
Possibility:
waiting for geopolitical situation as it getting worsting.
I'll Update as it needs to be updated.
Use proper risk management Or money management and follow my instructions properly.
Don't forgot to support by liking or following!!
