XAUUSD Bullish Retracement Opportunity: Targeting $4,030 ?(XAUUSD) price action, focusing on a recent strong move and a potential reversal setup.
1. Key Price Action
Prior Uptrend: The chart shows a significant, powerful bullish move leading up to the $4,030–$4,040 area, evidenced by a series of large, green (bullish) candlesticks. This indicates strong buying pressure and momentum preceding the current segment.
Recent Sell-off/Correction: Following the high, the price experienced a sharp sell-off (red candlesticks), bringing it back down significantly.
Current Bounce and Retracement Area: The price has bounced off a lower area and is now currently trading around $4,012.48.
2. Proposed Trading Scenario (Technical Pattern)
The black and green arrow indicates a potential bullish reversal/continuation pattern:
Potential Retracement/Support Zone: The cyan-shaded rectangle, roughly between $3,990 and $4,005, appears to be a demand zone or a zone of prior support/resistance that the price is expected to re-test. The proposed path shows the price first pulling back to this zone before resuming its ascent.
Planned Trajectory: The indicated path suggests a "dip-buying" strategy, where a trader would wait for a pullback into the support/demand zone (the cyan box) and then enter a long position.
Target 1 (T1): $4,030.42: This is the immediate target, likely a re-test of a recent swing high or a key resistance level.
Target 2 (T2): $4,040.00: This is the secondary target, indicating an expectation for the price to break the first resistance and continue higher to test the ultimate recent high or the next significant resistance level.
3. Conclusion
The analysis suggests a bullish outlook in the short to medium term, following an initial retracement. The trading plan hinges on the cyan box holding as a key support/demand zone to facilitate a push back toward the recent high, aiming for new short-term highs at $4,030 and $4,040. This is a classic "buy-the-dip" setup within a broader context of strong upward momentum.
Trendanalys

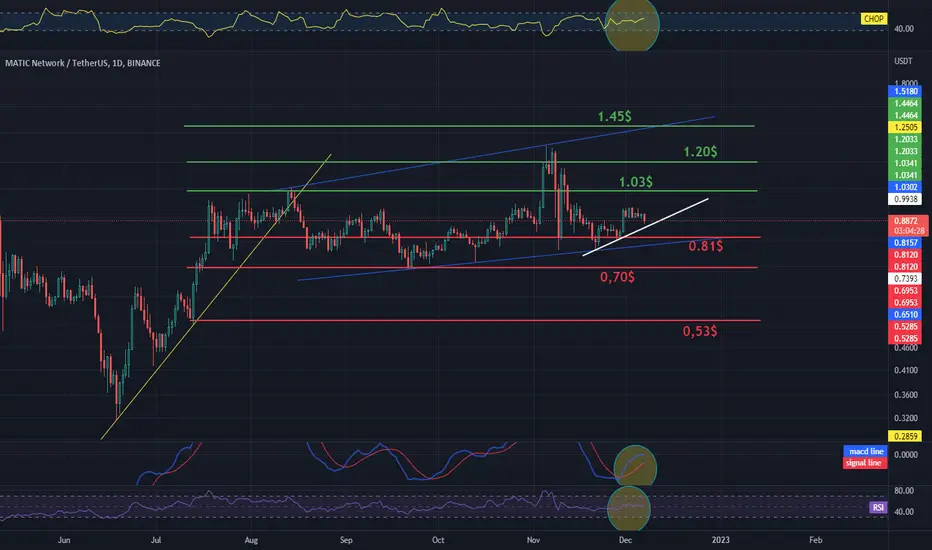
MATIC / USDT 1D chart Resistance and SupportHello everyone, let's look at the MATIC to USDT chart on a 1 day time frame. as you can see, the price, after a fairly large drop, started to return along the uptrend line and gave an increase of 227%, and then began to move in the sideways trend channel.
Now let's look at what supports MATIC has on its way and we see that we have the first support at $0.81, the second support at $0.70 and the third support at $0.53.
Looking the other way, we will check resistance points for the price that we should take into account in the longer term. The first resistance is at $1.03, the second at $1.20 and the third at $1.45.
It is also worth marking the local uptrend line above which the price is still holding.
As you can see, the CHOP index indicates that the energy is highly charged, the MACD indicates that we are in an uptrend, and the RSI shows that we are in the middle of the range, which may indicate a further sideways trend.
Köp av SintercastVäntade på köp i Sintercast och följde trendlinje
Köp på 140kr
Stop loss 136kr
Håller på medelsikt
