The Liquidity Map: How Smart Money Actually Moves
Price Doesn't Move Randomly — It Hunts Liquidity
Every time you place a stop loss, you're adding to a liquidity pool.
Every time price "randomly" spikes to hit your stop before reversing, it wasn't random at all.
Understanding liquidity is understanding why price moves the way it does — and AI is getting very good at mapping these invisible pools.
---
What Is Liquidity?
Simple Definition:
Liquidity is the ability to buy or sell without significantly moving the price.
In Practice:
Liquidity exists where orders are clustered:
Stop losses (become market orders when triggered)
Limit orders (resting buy/sell orders)
Pending orders (orders waiting to execute)
The Key Insight:
Large players need liquidity to fill their positions. They can't just buy 10,000 contracts at market — they need someone to sell to them.
Where do they find sellers? Where stop losses are clustered.
---
Types of Liquidity Zones
1. Buy-Side Liquidity (BSL)
Located ABOVE price action:
Stop losses from short positions
Buy stop orders from breakout traders
Triggered when price moves up
2. Sell-Side Liquidity (SSL)
Located BELOW price action:
Stop losses from long positions
Sell stop orders from breakdown traders
Triggered when price moves down
3. Equal Highs/Lows
Multiple touches at the same level:
Creates obvious stop placement
Attracts more orders over time
High-probability liquidity targets
4. Swing Points
Previous highs and lows:
Natural stop loss placement zones
Visible to all market participants
Frequently targeted before reversals
---
Why Price "Hunts" Liquidity
The Mechanism:
Retail traders place stops at obvious levels
These stops accumulate into liquidity pools
Large players need this liquidity to fill positions
Price is drawn to these pools
Stops trigger, providing liquidity
Large players fill their orders
Price reverses
This Isn't Conspiracy — It's Market Structure
Large orders need counterparties. If a fund wants to buy 50,000 shares, they need 50,000 shares worth of sellers. Stop losses, when triggered, become market sell orders — perfect liquidity for buyers.
---
How AI Maps Liquidity Zones
Method 1: Swing Point Detection
AI identifies:
Recent swing highs (potential BSL)
Recent swing lows (potential SSL)
Multiple touches at same level (stronger zones)
Method 2: Order Flow Analysis
Where available, AI analyzes:
Resting limit orders in the book
Historical order placement patterns
Volume profile at price levels
Method 3: Pattern Recognition
AI identifies formations that create liquidity:
Equal highs/lows (obvious stops)
Trendline touches (stops below/above)
Range boundaries (stops outside range)
Method 4: Historical Stop Placement
Machine learning on:
Where stops typically cluster relative to patterns
How far from entry traders usually place stops
Common ATR multiples for stop distance
---
Liquidity Concepts in Practice
Concept 1: Liquidity Sweep
Price moves to take out a liquidity zone, then reverses.
Identification:
Price breaks above/below a key level
Quick rejection (wick or immediate reversal)
Often accompanied by volume spike
Trading Application:
Wait for the sweep before entering in the opposite direction.
---
Concept 2: Liquidity Void (Fair Value Gap)
Areas where price moved so fast that no trading occurred.
Identification:
Gap between candle bodies
No overlap in price action
Often created during news or high momentum
Trading Application:
Price often returns to fill these voids before continuing.
---
Concept 3: Liquidity Grab
Intentional move to trigger stops before the real move.
Identification:
Sharp move into obvious stop zone
Immediate reversal
Often occurs before significant moves
Trading Application:
Don't place stops at obvious levels. Wait for grabs before entering.
---
Building a Liquidity-Aware Strategy
Step 1: Identify Key Levels
Mark on your chart:
Recent swing highs (BSL zones)
Recent swing lows (SSL zones)
Equal highs/lows
Obvious trendline touches
Step 2: Anticipate Liquidity Hunts
Before entering, ask:
Where is the nearest liquidity pool?
Is price likely to sweep that level first?
Should I wait for the sweep?
Step 3: Place Stops Intelligently
Instead of obvious levels:
Beyond the liquidity zone (not at it)
Use ATR-based stops that adapt to volatility
Consider time-based exits instead of price-based
Step 4: Use Liquidity as Entry Trigger
Enter AFTER liquidity is taken:
Wait for sweep of key level
Confirm with reversal candle or structure
Enter with stop beyond the sweep
---
Common Liquidity Mistakes
Placing Stops at Round Numbers — $100, $50, $10 — everyone sees these. So does the algorithm hunting stops.
Stops Just Below Support — If you can see the support, so can everyone else. Stops cluster just below.
Ignoring the Sweep — Entering at support without waiting for the liquidity grab often means getting stopped out on the sweep.
Fighting Liquidity Flow — If price is clearly hunting liquidity in one direction, don't stand in front of it.
---
AI-Enhanced Liquidity Trading
What AI Can Do:
Map All Liquidity Zones — Scan multiple timeframes and instruments simultaneously
Rank Zone Importance — Weight zones by age, touches, and volume
Predict Sweep Probability — Based on current momentum and zone proximity
Alert on Sweeps — Real-time notification when liquidity is taken
Optimize Stop Placement — Calculate stops that avoid obvious liquidity pools
---
Liquidity Zone Checklist
Before entering any trade:
Where is the nearest BSL (above price)?
Where is the nearest SSL (below price)?
Has recent liquidity been swept?
Is my stop at an obvious level?
Am I entering before or after the liquidity grab?
---
Key Takeaways
Liquidity zones are where stop losses and pending orders cluster
Price is drawn to liquidity — large players need it to fill positions
AI can map and rank liquidity zones across multiple timeframes
Smart traders wait for liquidity sweeps before entering
Stop placement should avoid obvious liquidity pools
---
Your Turn
Have you noticed price "hunting" your stops before reversing?
How do you currently think about liquidity in your trading?
Share your experiences below 👇
Trendingideas

AVAX - Rising Wedge at $14.12 | ETF Filings Spark +11% Rally
Executive Summary
Avalanche (AVAX) trading at $14.12 within a rising wedge on the 2H timeframe. Price surged +11% this week as institutional ETF filings sparked a rally. Now testing upper resistance with two scenarios: bullish breakout above $14.75 or pullback to $12.00-$12.75 support zone before continuation.
BIAS: NEUTRAL - Watching for Breakout or Pullback
Current Market Data
Current: $14.123 (-0.82%)
Day's Range: $14.033 - $14.516
52-Week: $9.013 - $44.575
Market Cap: $6.08B
24h Volume: $384.76M
Technical Rating: Neutral
Performance:
1W: +11.80% | 1M: +6.89% | 3M: -53.89%
6M: -23.09% | YTD: +14.80% | 1Y: -66.85%
Key Catalyst
Institutional ETF filings sparked +11% rally
AVAX among altcoins with ETF filing momentum
Fortune 100 companies expected to launch blockchains on Avalanche
Strong ecosystem for enterprise adoption
Technical Structure - 2H
Rising Wedge Pattern:
Rising support and resistance trendlines (yellow dashed)
Wedge narrowing toward apex
Can break either direction
Currently testing upper resistance
Key Levels:
Resistance:
$14.50 - $14.75 - Upper resistance / breakout level
$15.00 - Psychological resistance
$16.00+ - Extended bullish target
Support:
$14.00 - Immediate support
$12.75 - Upper support zone
$12.00 - $12.75 - Major support zone (purple)
$11.75 - Deep support (red line)
SCENARIO ANALYSIS
BULLISH: Breakout Above $14.75
Trigger: 2H close above $14.75 with volume
Targets: $15.00 → $16.00 → $18.00
Catalyst: ETF momentum continues
BEARISH: Pullback to Support Zone
Rejection at upper wedge resistance
Pullback to $12.00-$12.75 support zone
Healthy retest before continuation
Buy opportunity at support
My Assessment
Rising wedge at resistance after +11% ETF-driven rally. Two scenarios: breakout above $14.75 or pullback to $12.00-$12.75 support zone. ETF filings provide fundamental catalyst. Watch for confirmation before entry.
Strategy:
Long above $14.75 breakout → Target $15, $16, $18
Or wait for pullback to $12.00-$12.75 support
Long at support with stop below $11.75
Target $14.50+ on bounce
List your thoughts below!

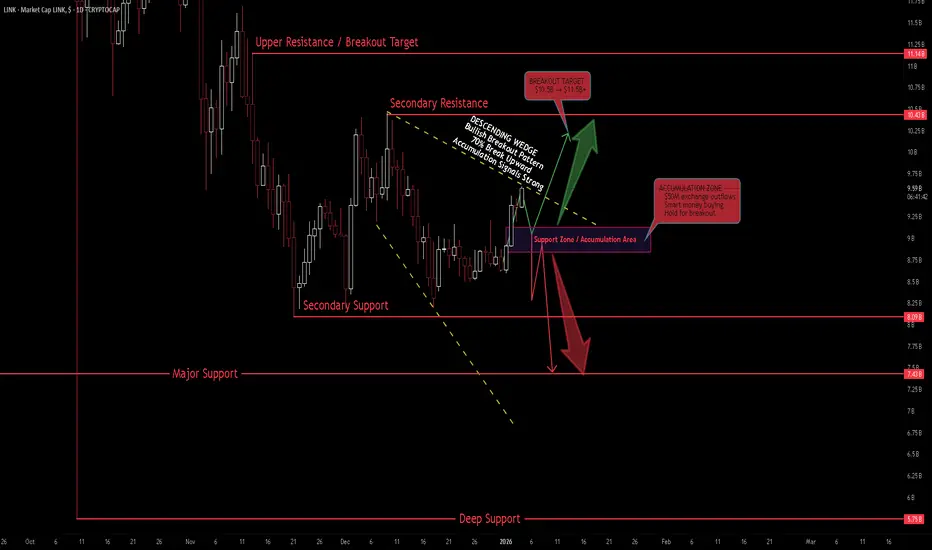
LINK Market Cap - Descending Wedge at $9.25B | Bullish Breakout Executive Summary
Chainlink (LINK) market cap trading at $9.25B within a descending wedge on the 1D timeframe. Price holding key support while forming bullish structure. Strong accumulation signals with $50M in exchange outflows from Binance. Expecting bullish breakout past the highs as selling pressure fades and smart money accumulates.
BIAS: BULLISH - Breakout Structure Forming
Current Market Context
LINK broke 21-day MA - altcoins looking for "upward run" in next 2-3 months
$50M in exchange outflows from Binance (accumulation signal)
Holding 200-day MA and long-term trendline support
Grayscale highlights LINK's role in tokenization
Top DeFi project by development activity
Cleaner setup than Hyperliquid heading into 2026
Fundamental Strength
Strong connections with policymakers and financial institutions
Founder met with US lawmakers, Federal Reserve, key political figures
Key player in compliant crypto projects
Leading role in tokenizing real-world assets (RWA)
Ranked top DeFi project by GitHub development activity
Positioned well for regulatory clarity in 2026
Technical Structure - 1D
Descending Wedge Pattern:
Falling resistance and support trendlines (yellow dashed)
Wedge narrowing - compression before breakout
Typically bullish reversal (70% break up)
Price holding support zone
Key Levels (Market Cap):
Resistance:
$9.5B - Immediate resistance
$10.5B - Secondary resistance (red line)
$11.5B - Upper resistance / breakout target
Support:
$9.0B - $9.25B - Current support zone (purple)
$8.0B - Secondary support (red line)
$7.4B - Major support (red line)
$5.7B - Deep support (red line at bottom)
SCENARIO ANALYSIS
BULLISH (Primary): Wedge Breakout
Break above descending wedge resistance
Target $10.5B, then $11.5B+
Accumulation signals support breakout
Altcoin season catalyst
BEARISH: Wedge Breakdown
If support at $9.0B fails
Drop to $8.0B, then $7.4B
Invalidates bullish thesis
My Assessment
Descending wedge with strong accumulation signals. $50M exchange outflows = smart money buying. Holding long-term support while selling pressure fades. Bullish structure forming for breakout past the highs. LINK positioned well for 2026 with regulatory clarity and RWA tokenization narrative.
Strategy:
Long on wedge breakout confirmation
Target $10.5B, then $11.5B+
Stop below $8.0B support
Accumulate at $9.0B-$9.25B support zone
Let me know what you think in the comments below for the next move!
MNQ - Range-Bound at 25,385 | Support Below, Resistance AboveExecutive Summary
Micro E-mini Nasdaq 100 futures (MNQ1!) trading at 25,385 in a range-bound consolidation on the 4H timeframe. Price rejected from the 25,900-26,000 resistance zone and is now testing lower levels. Multiple support zones below at 25,100-25,200 and 24,850-24,950. Watch for breakout direction from this consolidation range.
BIAS: NEUTRAL - Range-Bound Consolidation
Current Market Data
Current: 25,385.25 (-0.28%)
Day's Range: 25,265.25 - 25,803.50
52-Week: 16,452.50 - 26,399.50
Open Interest: 94.90K
Front Month: MNQH2026
Performance:
1W: -1.87% | 1M: -1.03% | 3M: +1.12%
6M: +10.52% | YTD: -0.29% | 1Y: +10.79%
Key Market Context
Mag 7 outperformed S&P 500 for 3rd straight year
MAG/SPX ratio showing smallest yearly rise in 3 years
Equal-weighted S&P 500 starting to outperform
January Barometer: As January goes, so goes the year (84% hit rate)
Santa Rally sputtering - weak footing into 2026
VIX subdued but could spike in Jan-Feb
Fed expected to pause at Jan 27-28 meeting (83% odds)
Technical Structure - 4H
Range-Bound Consolidation:
Price consolidating between support and resistance
Rejected from 25,900-26,000 resistance zone
Testing lower support zones
Watch for breakout direction
Key Levels:
Resistance:
25,800 - Day's high / immediate resistance
25,900 - 26,000 - Resistance zone (pink box)
26,260 - Upper resistance (red line)
26,399.50 - 52-WEEK HIGH
Support Zones (Purple):
25,100 - 25,200 - Upper support zone
24,850 - 24,950 - Lower support zone
24,850 - Major support (red line at bottom)
SCENARIO ANALYSIS
BULLISH: Break Above Resistance
Trigger: Break above 26,000 with volume
Targets: 26,260 → 26,399 (52-week high) → 26,500+
BEARISH: Test Support Zones
Price tests 25,100-25,200 first support
If fails, drops to 24,850-24,950
Break below 24,850 = bearish continuation
NEUTRAL: Range Continuation
Price oscillates between 24,850 - 26,000
Wait for breakout confirmation
Trade the range until breakout
My Assessment
Range-bound consolidation with clear support and resistance zones. Mag 7 momentum slowing, equal-weighted index gaining ground. Santa Rally weak - cautious into January. Watch support zones for bounce or breakdown.
Strategy:
Watch for bounce at 25,100-25,200 support
Long above 26,000 breakout → Target 26,260, 26,400
Short below 24,850 breakdown → Target 24,500, 24,000
Trade the range until breakout confirms
Comment your thoughts below!

ATOM - +21% Weekly Rally at $1.16B | Tokenomics Redesign
Executive Summary
Cosmos (ATOM) market cap trading at $1.16B after a massive +21.17% weekly rally on the 4H timeframe. Price surged from $880M support to test $1.18B resistance. Major catalysts ahead: tokenomics redesign (Q1 2026), Solana/Ethereum L2 IBC integrations, and THORChain cross-chain swaps live. Strong momentum but approaching resistance.
BIAS: BULLISH - Strong Momentum, Watch Resistance
Current Market Data
Current: $1.16B (+0.33%)
Day's Range: $1.14B - $1.16B
52-Week: $803.29M - $2.8B
Volume: 63.52M (above 30D avg of 53.47M)
Performance:
1W: +21.17% | 1M: +7.14% | 3M: -39.69%
6M: -31.52% | YTD: +23.37% | 1Y: -59.76%
Key Catalysts
Tokenomics Redesign (Q1 2026) - Lower inflation, fee capture from appchains
IBC Integrations - Solana and Ethereum L2s connectivity coming
THORChain Cross-Chain Swaps - Native ATOM swaps live (no bridges)
CometBFT Upgrades - Targeting 10k+ TPS for enterprise
Enterprise Blockchain Fleet Manager - SWIFT, SMBC adoption potential
Stablecoin Surge - Cosmos Labs predicts new issuers in 2026
Technical Structure - 4H
Strong Uptrend:
Clean rally from $880M to $1.16B
Higher highs and higher lows
Now testing upper resistance at $1.18B
Volume above average - confirms momentum
Key Levels (Market Cap):
Resistance:
$1.16B - $1.18B - Current resistance zone
$1.20B - Psychological resistance
$1.40B+ - Extended bullish target
Support:
$1.10B - Immediate support
$1.00B - Psychological support
$880M - Major support (red line at bottom)
SCENARIO ANALYSIS
BULLISH: Breakout Above $1.18B
Trigger: Close above $1.18B with volume
Targets: $1.20B → $1.40B → $1.60B
Catalyst: Tokenomics redesign approval, IBC integrations
BEARISH: Rejection at Resistance
Rejection at $1.18B resistance
Pullback to $1.00B-$1.10B support
Healthy consolidation before next leg
My Assessment
Strong +21% weekly rally with volume confirmation. Approaching resistance at $1.18B. Major catalysts ahead: tokenomics redesign to lower inflation and capture fees, IBC integrations with Solana/ETH L2s, and enterprise adoption push. Bullish structure intact - watch for breakout or pullback to support.
Strategy:
Long on breakout above $1.18B → Target $1.20B, $1.40B
Or buy pullback to $1.00B-$1.10B support
Stop below $880M major support
Tell me your thoughts below!

Consistency: The Real Market Hack Nobody Talks About
The Real Market Hack Isn't a New Indicator - It's Doing the Same Thing on Purpose
Everyone is hunting for the next edge:
New signal
New model
New AI feature
But if you look at traders who actually last in this game, they usually have something boring in common:
One or a few clear approaches
Defined rules
Years of showing up and doing the same thing
That's not an accident. That's the compounding effect of consistency.
---
Why Consistency Beats Constant Optimization
When you constantly change:
You never see what your edge really is
You never gather enough data on any one system
You end up chasing whatever just worked last month
In the AI era, this gets worse — because tools can generate infinite variations of a strategy in minutes. It's tempting to jump to the "latest best" version every time the equity curve dips.
Consistency looks like:
Choosing a system that is "good enough"
Defining exactly how you size, enter, and exit
Letting it play out over 50, 100, 200 trades before judging
---
Using AI to Enforce Consistency, Not Break It
AI and automation can be your enemy or your ally here.
Enemy when:
You constantly regenerate new strategies instead of refining one
You change parameters after every drawdown
Ally when:
You codify your rules into a bot and let it execute without emotion
You use AI to track execution quality ("Did I actually follow my plan?")
You schedule when you’re allowed to review and adjust — not in the middle of pain

MES - Descending Wedge at 6,900 | Support Zones Below For Bounce
Executive Summary
Micro E-mini S&P 500 futures (MES1!) trading at 6,900.50 within a descending wedge on the 4H timeframe. After the S&P 500's third consecutive year of gains (+16.56% 1Y), price is consolidating below the 52-week high of 6,995. Multiple support zones below offer potential bounce opportunities. Descending wedge typically bullish reversal pattern.
BIAS: NEUTRAL - Watching Support Zones for Direction
Current Market Data
Current: 6,900.50 (+0.12%)
Day's Range: 6,866.50 - 6,939.75
52-Week: 4,832.50 - 6,995.00
Open Interest: 130.39K
Front Month: MESH2026
Performance:
1W: -1.15% | 1M: +0.51% | 3M: +2.02%
6M: +9.41% | YTD: -0.01% | 1Y: +16.56%
Key Market Context
S&P 500 just completed 3rd consecutive year of gains
50% odds of 4th straight year based on history
Valuation indicators at extreme levels (98th percentile)
Breadth oscillators on sell signals
Equity put-call ratios rising (bearish)
VIX still complacent - bullish for stocks
Fed rate cuts expected in 2026
AAII bears at lowest since Oct 2024
Technical Structure - 4H
Descending Wedge Pattern:
Falling resistance trendline (yellow dashed)
Falling support trendline (yellow dashed)
Wedge narrowing - compression before breakout
Typically bullish reversal (70% break up)
Key Levels:
Resistance:
6,940 - Day's high / immediate resistance
6,970 - Upper resistance (red line)
6,995 - 52-WEEK HIGH
7,000+ - Psychological / breakout target
Support Zones (Purple):
6,860 - 6,880 - Upper support zone
6,800 - 6,820 - Middle support zone
6,720 - 6,760 - Lower support zone
6,675 - Major support (red line at bottom)
SCENARIO ANALYSIS
BULLISH: Wedge Breakout
Trigger: Break above 6,970 with volume
Targets: 6,995 (52-week high) → 7,000+ → 7,100
BEARISH: Test Support Zones
Price tests 6,860-6,880 first support
If fails, drops to 6,800-6,820
Deeper support at 6,720-6,760
Major support at 6,675 (must hold)
My Assessment
Descending wedge at 6,900 with multiple support zones below. Market breadth weakening but VIX complacent. Expect test of support zones before potential breakout. Watch 6,860-6,880 for bounce. Break below 6,675 invalidates bullish thesis.
Strategy:
Watch for bounce at 6,860-6,880 support
Long on wedge breakout above 6,970
Target 6,995 (52-week high), then 7,000+
Stop below 6,675 major support
List your thoughts below!

XRP | FVG Retrace Then Consolidation Before Breakout
Executive Summary
XRP is trading at $2.02 within an ascending triangle on the 4H timeframe. After reclaiming the psychological $2 level, price faces resistance at $2.02-$2.12. Expecting a short-term bearish move into the FVG (Fair Value Gap) at $1.75-$1.80, followed by consolidation, then a breakout either up or down.
BIAS: NEUTRAL - Bearish Short-Term, Then Consolidation, Then Breakout
Current Market Data
Current: $2.0231 (+0.85%)
Day's Range: $2.0059 - $2.0385
52-Week: $1.6106 - $3.6662
Market Cap: $122.74B
ETF Holdings: $1.16B+ (24 consecutive days of inflows)
Performance:
1W: +9.82% | 1M: -7.96% | 3M: -31.88%
6M: -10.94% | YTD: +9.99% | 1Y: -15.73%
Key News
XRP spot ETFs hold $1.16B+ with $1.4B total inflows
Ripple unlocked 1B XRP on Jan 1 (monthly escrow) - supply pressure
JPMorgan GTreasury integration on XRP Ledger
CLARITY Act markup scheduled for January 2026
$2 zone has rejected XRP since 2017 - major resistance
Technical Structure - 4H
Ascending Triangle:
Rising support trendline - higher lows
Horizontal resistance at $2.00-$2.02
Upper resistance at $2.12
FVG filled on left, was resistance, then broken
FVG Zone:
$1.75-$1.80 - Unfilled gap / liquidity sweep zone
Expect retrace here before consolidation
Ideal long entry if bounce confirms
Key Levels:
Resistance:
$2.00 - $2.02 - Horizontal resistance
$2.12 - Upper resistance (breakout level)
$2.20 - $2.50 - Bullish targets
Support:
$1.88 - $1.91 - Immediate support
$1.75 - $1.80 - FVG zone / liquidity sweep
$1.72 - Major support zone (bottom red line)
SCENARIO ANALYSIS
SHORT-TERM: Bearish Into FVG
Price retraces to $1.75-$1.80 FVG zone
Sweeps liquidity below $1.80
Consolidation phase begins
THEN: Breakout Either Direction
BULLISH: Break above $2.12 → Targets $2.20, $2.50
BEARISH: If no FVG bounce → Break below $1.72 → Targets $1.61, $1.45
My Assessment
Ascending triangle at $2 resistance. Short-term bearish into FVG at $1.75-$1.80, then consolidation. Wait for breakout confirmation before committing to direction. The $2 zone has rejected XRP since 2017 - this is a make-or-break level.
Strategy:
Expect short-term drop to $1.75-$1.80 FVG
Watch for consolidation and breakout direction
Long above $2.12 → Target $2.20-$2.50
Short below $1.72 → Target $1.61-$1.45
Comment your thoughts on the XRP 2026 Bull or Bear RALLY!

Options Greeks + AI: The New Era of Derivatives Trading
Options Already Feel Like 4D Chess - AI Just Adds More Dimensions
For many traders, options feel intimidating because there isn't just "price" — there are Greeks, volatility, time decay, and complex payoffs.
AI doesn't magically simplify options. What it does is help you see and manage all those moving parts at once.
---
Quick Greek Refresher (The Calm Version)
Delta (Δ) – How much the option price moves when the underlying moves
Gamma (Γ) – How fast Delta itself changes
Theta (Θ) – How much you pay or collect per day in time decay
Vega (ν) – How much the option responds to changes in implied volatility
Think of it like this:
Delta: Direction
Gamma: Acceleration
Theta: Rent for time
Vega: Sensitivity to fear/volatility
---
Where AI Actually Helps With Options
Instead of guessing, AI‑driven tools can:
Monitor your total portfolio Greeks in real‑time (net Delta, net Vega, etc.)
Run what‑if scenarios : "What happens to my P&L if we gap 3% overnight? If IV drops 10 points?"
Search across chains to find structures that fit your risk profile
You still choose the playbook. AI just gives you a clearer picture of the board.
---
Example: Using AI for Volatility, Not Just Direction
Most traders focus on "Will price go up or down?".
Options traders (and their models) often focus on:
"Will price move more or less than the market expects?" (Realized vs implied volatility)
AI can:
Compare current implied volatility to realized volatility over multiple windows
Flag when options look historically expensive or cheap
Suggest whether you should be long or short volatility for your idea
Direction is still a bet - but at least now, your bet on volatility is informed.
---

BTC - Ascending Triangle | Liquidity Sweep Before Breakout?
Executive Summary
Bitcoin is trading at $90,529 on the first trading day of 2026, testing the upper resistance of an ascending triangle on the 4H timeframe. Price has rallied +2% today as dip buyers stepped in aggressively. The structure suggests a short-term pullback to sweep liquidity below $88K before breaking the ascending pattern and bursting higher.
BIAS: BULLISH - Short-Term Dip, Then Breakout
Current Market Data
Current: $90,529 (+1.98%)
Day's Range: $88,309 - $90,927
October Peak: $126,000
Key Support: $86,000-$88,000
Fear & Greed Index: 36 (Fear → improving)
What's Driving the Rally
"January Effect" - Tax-loss selling ended, capital redeploying
Whale accumulation visible on-chain
Open interest up 2% to $130B - leveraged bulls entering
$217.82M in shorts liquidated in 24 hours
Meme coins rallying (PEPE +32%) - risk-on returning
Fed rate cuts expected by March
Key News Context
Bitcoin's four-year cycle officially broken - first red post-halving year
ETF effect pulled liquidity forward into 2024
BlackRock deposited 1,134 BTC ($101.4M) to Binance - bearish signal
But whales reducing exchange deposits - bullish signal
Zero Bitcoin obituaries in 2025 - first time since Satoshi era
Technical Structure - 4H
Ascending Triangle Pattern:
Rising support trendline (yellow dashed) - higher lows
Horizontal resistance at $90,000-$90,500 (pink zone)
Price compressing toward apex
Typically bullish breakout pattern (70%+)
Key Levels:
Resistance:
$90,000 - $90,500 - Horizontal resistance (pink zone)
$93,000 - $93,200 - Upper target zone
$100,000 - Psychological level
Support:
$88,000 - CME gap zone ($87,800-$88,000)
$86,000 - $86,500 - Major support zone (pink)
$84,000 - $84,500 - Deep support / liquidity pool
Liquidity Analysis
Heavy liquidation clusters below $88,000
More intense bands near $86,000 and $84,500
CME gap at $87,800-$88,000 - likely to be filled
Thin resistance between $91,000-$94,000 if breakout occurs
SCENARIO ANALYSIS
PRIMARY: Liquidity Sweep Then Breakout
Short-term dip to $86,000-$88,000 to sweep liquidity
Fill CME gap at $87,800-$88,000
Bounce off ascending trendline support
Break above $90,500 resistance
Target $93,000-$94,000, then $100,000
BULLISH: Direct Breakout
Trigger: 4H close above $90,500 with volume
Targets: $93,000 → $94,000 → $100,000
BEARISH: Triangle Breakdown
Trigger: Break below $86,000 and ascending trendline
Targets: $84,500 → $83,000 → $80,000
My Assessment
Ascending triangle at resistance with liquidity pools below. Expect short-term dip to sweep $86K-$88K liquidity, fill CME gap, then break ascending pattern and burst higher. Risk-on sentiment returning, whale accumulation, and January Effect support bullish thesis.
Strategy:
Wait for dip to $86,000-$88,000 zone
Long on bounce with stop below $84,500
Target $93,000-$94,000, then $100,000
Or long on confirmed breakout above $90,500
Drop your comments below on what you think is the NEXT MOVE!

USDT.D - Rising Wedge at 6.36% +47.73% YTD | Critical Crypto
Executive Summary
USDT Dominance is trading at 6.362% within a rising wedge pattern on the 4H timeframe. Up +47.73% YTD as investors rotated into stablecoins during crypto weakness. The rising wedge suggests potential bearish reversal (bullish for crypto), but the uptrend remains intact near the 52-week high of 6.749%.
BIAS: NEUTRAL - Rising Wedge at Resistance
WHY USDT.D MATTERS
USDT.D UP = Risk-off = BEARISH for crypto
USDT.D DOWN = Risk-on = BULLISH for crypto
Leading indicator for BTC, ETH, altcoins
Current Market Data
Current: 6.362% (+0.57%)
Day's Range: 6.270% - 6.399%
52-Week: 3.745% - 6.749%
Technical Rating: NEUTRAL
Performance:
1W: -0.26% | 1M: +4.67% | 3M: +44.84%
6M: +34.12% | YTD: +47.73% | 1Y: +46.90%
Stablecoin Market Context
Total stablecoin market: ~$300B (record high)
USDT: $187B (64% market share)
USDC: $76B (26% market share)
Dragonfly predicts USDT share drops to 55% in 2026
Stablecoin market expected to grow 60% in 2026
Technical Structure - 4H
Rising Wedge Pattern:
Yellow dashed trendlines forming wedge
Typically bearish reversal (70% break down)
Price compressing near apex
Breakdown = BULLISH for crypto
Key Levels:
Resistance:
6.45% - 6.55% - Upper resistance zone
6.749% - 52-WEEK HIGH
Support:
6.15% - 6.25% - Support zone / Breakdown level
5.80% - 5.95% - Major support zone
SCENARIO ANALYSIS
BEARISH USDT.D (Bullish for Crypto)
Trigger: Break below 6.15%
Targets: 6.00% → 5.80% → 5.50%
Implication: LONG crypto - risk-on rotation
BULLISH USDT.D (Bearish for Crypto)
Trigger: Break above 6.55%
Targets: 6.749% → 7.00% → 7.25%
Implication: Reduce crypto exposure - risk-off continues
My Assessment
Rising wedge at resistance suggests potential breakdown (bullish for crypto). However, +47.73% YTD momentum and risk-off sentiment could push higher. Wait for confirmation.
Strategy:
Breakdown below 6.15% = BULLISH for crypto
Breakout above 6.55% = BEARISH for crypto
Use as leading indicator for crypto trades
This is not financial advice.

From Signals to Systems: The Evolution Every Trader Must Make
Signal Chasing Feels Exciting - Systems Pay the Bills
In every market cycle, you see the same thing:
New signals
New indicators
New "can't miss" setups
But when you zoom out over a year or two, the traders who tend to last aren't the ones with the fanciest signals. They're the ones who turned a handful of ideas into simple, testable systems — and then ran those systems with discipline.
---
Signal Thinking vs System Thinking
Signal mindset: "Is this trade right?"
System mindset: "Does this trade follow my rules, and does the set of all trades have edge?"
Signal thinkers:
Jump from setup to setup
Size based on confidence or mood
Quit after a few losses, chase after a few wins
System thinkers:
Define exact entry, exit, and sizing rules
Follow them across many trades
Judge the system on 100+ trades, not 10
In the AI era, this distinction is even more important — because systems are what you can automate .
---
Building a System From Your Favorite Signals
You don't have to throw your signals away. You have to formalize them.
Write Out the Signal in Plain Language
"I like breakouts that happen after a long, tight base with rising volume."
Turn That Into Specific Conditions
Base length in bars
Tightness threshold (range %)
Minimum volume increase
Define Exits and Sizing
Where you cut losses
Where you take profits or trail
How much of your account you risk per trade
Test, Then Decide
Run it through backtests or at least detailed journaling.
Judge the system , not each isolated trade.
Once it’s defined, AI and automation can help you:
Scan for every valid signal
Ensure size and risk rules are followed
Execute entries and exits without hesitation

USDJPY - Symmetrical Triangle at 156.04 | Breakout Imminent
Executive Summary
FX:USDJPY is trading at 156.042 on December 29, 2025, compressing within a symmetrical triangle pattern on the 2H timeframe. Price is squeezed between a descending trendline from the December highs and an ascending trendline from the lows - a classic breakout setup. The pair is consolidating in a purple zone between 156.00-156.80, with key horizontal support/resistance levels defining the battlefield. A breakout is imminent as the triangle apex approaches.
BIAS: NEUTRAL - Breakout Imminent, Direction TBD
Symmetrical triangles break 50/50 either direction. Wait for confirmation. BOJ hawkishness favors downside break, yield differentials favor upside break.
Current Market Context - December 29, 2025
Current Price: 156.042
52-Week High: 158.874 | Low: 139.883
Technical Rating: NEUTRAL
Pattern: Symmetrical Triangle (Breakout Pending)
Performance Metrics - MIXED:
1 Week: -0.63% | 1 Month: -0.16% (Bearish short-term)
3 Months: +5.57% | 6 Months: +8.63% (Bullish medium-term)
YTD: -0.81% | 1 Year: -1.09%
THE PATTERN - Symmetrical Triangle
Structure:
Descending trendline from December highs (~158) connecting lower highs
Ascending trendline from lows (~154.30) connecting higher lows
Triangle compressing - apex approaching early January
Consolidation zone (purple box): 156.00-156.80
Price coiling for explosive move
Key Horizontal Levels (Red Lines):
157.86 - Upper resistance (near triangle top)
156.70 - Upper consolidation boundary
155.66 - Lower consolidation boundary
154.86 - Support zone top
154.31 - Major support (triangle bottom)
THE BULL CASE
US-Japan yield spread: 350+ bps - carry trade attractive
Risk-on environment - S&P at record highs
Ascending trendline holding - higher lows intact
Fed may delay rate cuts if inflation persists
Medium-term trend bullish (+5.57% 3M)
Bullish Breakout Target: Break above descending trendline (~157.00) → 157.86 → 158.874 (52W high)
THE BEAR CASE
BOJ rate hike cycle underway - historic policy shift
Intervention risk above 158 - MOF watching closely
Fed expected to cut 2-3x in 2026
Short-term momentum bearish (1W: -0.63%)
DXY down -9.58% YTD - Dollar weakness trend
Bearish Breakdown Target: Break below ascending trendline (~155.50) → 154.86 → 154.31 → 152.00
Technical Structure
Symmetrical Triangle Characteristics:
Converging trendlines creating compression
Decreasing volatility as apex approaches
Breakout typically occurs 2/3 to 3/4 through pattern
Measured move = height of triangle at widest point
Triangle height: ~3.5 yen (158 - 154.50)
Consolidation Zone (Purple Box):
Range: 156.00-156.80
Current price in middle of consolidation
Represents indecision/equilibrium
Break above 156.80 = bullish signal
Break below 156.00 = bearish signal
Support Zone (Red Box ~154.80-155.66):
Multiple tests of this zone
Confluence with ascending trendline
Last line of defense for bulls
Break below = bearish confirmation
SCENARIO ANALYSIS
BULLISH BREAKOUT
Trigger: 2H close above descending trendline (~157.00)
Confirmation: Break above 157.86 resistance
Targets: 157.86 → 158.50 → 158.874 (52W high)
Stop: Below 155.66
WARNING: Intervention risk extreme above 158
BEARISH BREAKDOWN
Trigger: 2H close below ascending trendline (~155.50)
Confirmation: Break below 154.86 support zone
Targets: 154.31 → 153.00 → 150.00
Stop: Above 156.80
Trade Framework
Breakout Long:
Entry: Above 157.00 (trendline break)
Stop: 155.66 (below consolidation)
Target 1: 157.86 | Target 2: 158.50 | Target 3: 158.874
Breakdown Short:
Entry: Below 155.50 (trendline break)
Stop: 156.80 (above consolidation)
Target 1: 154.86 | Target 2: 154.31 | Target 3: 152.00
Range Trade (Current):
Buy: 155.66-156.00 (consolidation bottom)
Sell: 156.70-156.80 (consolidation top)
Stop: Outside consolidation zone
Risk Management
Wait for trendline break confirmation
Don't anticipate breakout direction
Intervention risk above 158 - reduce size
Triangle breakouts can be explosive - use proper stops
January BOJ meeting (23-24) = key catalyst
Conclusion
FX:USDJPY is coiling in a symmetrical triangle, squeezed between descending resistance and ascending support. The purple consolidation zone (156.00-156.80) represents the current battleground. A breakout is imminent - direction will be determined by BOJ policy and Fed guidance. Trade the breakout, not the anticipation.
Key Levels:
157.86 - Upper resistance
156.70-156.80 - Consolidation top / Descending trendline
156.04 - Current price
155.66-156.00 - Consolidation bottom
154.86 - Support zone
154.31 - Triangle bottom / Ascending trendline
The triangle will break. Be ready for both directions.

DXY - Descending Wedge at 98.13 | -9.58% YTD
Executive Summary
The US Dollar Index (DXY) is trading at 98.130 on December 29, 2025, consolidating within a descending wedge pattern on the 2H timeframe. The Dollar is on track for its worst year since 2017 with -9.58% YTD losses, pressured by Fed rate cut expectations, dovish Fed Chair concerns, and Trump's tariff policies. However, a potential bullish reversal pattern is forming at the bottom of the wedge, with an ascending channel developing. FOMC minutes due Tuesday could be the catalyst for the next directional move.
BIAS: NEUTRAL - Watching for Breakout Direction
The Dollar is at a critical inflection point. The descending wedge suggests potential bullish reversal, but fundamental headwinds remain strong. Wait for confirmation before committing to a direction.
Current Market Context - December 29, 2025
DXY is consolidating near yearly lows:
Current Price: 98.130 (+0.08% on the day)
Day's Range: 97.915 - 98.177
52-Week Range: 96.218 - 110.176
52-Week High: 110.176
52-Week Low: 96.218
Technical Rating: SELL
Performance Metrics - MIXED:
1 Week: -0.54%
1 Month: -1.45%
3 Months: +0.22%
6 Months: +1.54%
YTD: -9.58%
1 Year: -9.21%
The Dollar is having its worst year since 2017, down nearly 10% YTD. Short-term metrics are mixed, but the longer-term trend is clearly bearish.
THE BEAR CASE - Dollar Weakness Continues
1. Fed Rate Cut Expectations
The Dollar continues to see underlying weakness as markets price in further rate cuts:
FOMC expected to cut rates by ~50 bp in 2026
Markets pricing 19% chance of -25 bp cut at January 27-28 meeting
Two rate cuts expected in 2026
Fed officials split on path forward - majority forecast single additional cut
Lower rates = weaker Dollar
2. Dovish Fed Chair Concerns
President Trump to announce new Fed Chair in early 2026
Kevin Hassett (National Economic Council Director) most likely choice
Hassett seen as most dovish candidate by markets
Trump wants next Fed chairman to lower rates
Dovish Fed Chair = bearish for Dollar
3. Fed Liquidity Injection
Fed began purchasing $40 billion/month in T-bills mid-December
Announced December 10 - $40 billion/month liquidity injection
Increased liquidity pressures Dollar lower
Quantitative easing-like effects
4. Interest Rate Differentials
FOMC expected to cut rates ~50 bp in 2026
BOJ expected to raise rates +25 bp in 2026
ECB expected to leave rates unchanged in 2026
Narrowing rate differentials = Dollar weakness
Yen strengthening on BOJ rate hike expectations
5. Trump Tariff Policies
Aggressive tariff policies pressuring Dollar
Threats to Fed independence
Trade tensions creating uncertainty
Dollar down nearly 10% YTD partly due to tariff concerns
6. Technical Rating: SELL
TradingView technicals gauge pointing toward "Sell"
Descending wedge pattern (bearish continuation possible)
Below major moving averages
Momentum indicators bearish
THE BULL CASE - Potential Reversal Forming
1. Descending Wedge Pattern (Bullish Reversal)
Descending wedge is typically a bullish reversal pattern
Price compressing at bottom of wedge
Ascending channel forming within wedge
Potential breakout to upside
Pattern suggests exhaustion of selling pressure
2. US Economic Data Still Solid
Q3 GDP came in at +4.3% - stronger than expected
Nov pending home sales rose +3.3% m/m (vs +0.9% expected)
Jobless claims unexpectedly fell
US businesses see employment growth at 4.32%
Revenue growth expectations at 3.83%
Strong data could limit Dollar weakness
3. Safe-Haven Demand
Stock market weakness boosting liquidity demand for Dollar
Geopolitical tensions (Venezuela blockade, ISIS strikes in Nigeria)
Ukraine-Russia peace deal uncertainty
Risk-off events could boost Dollar
4. Oversold Conditions
Dollar down -9.58% YTD - oversold
Mean reversion possible
Near 52-week low (96.218)
Potential for bounce
5. "US Exceptionalism" Positioning
BNY's Bob Savage: Rise above 98.15 could trigger momentum buying
"US exceptionalism positioning" could resurge
Dollar bulls waiting for catalyst
6. FOMC Minutes Catalyst
Fed minutes due Tuesday (December 30)
Could provide signals on rate cut timing
Hawkish surprise could boost Dollar
Key catalyst for next move
Technical Structure Analysis
Price Action Overview - 2 Hour Timeframe
The chart shows a complex structure with potential reversal forming:
Descending Wedge Pattern (Primary):
Clear descending wedge established from highs
Upper trendline: Falling resistance (connecting lower highs)
Lower trendline: Falling support (connecting lower lows)
Wedge narrowing - compression before breakout
Typically bullish reversal pattern
Price near apex of wedge
Ascending Channel (Secondary - Forming at Bottom):
Small ascending channel forming within wedge
Higher lows being established
Potential early reversal signal
Watch for breakout above wedge resistance
Key Zones Identified:
Upper resistance zone: ~99.25 (major resistance)
Secondary resistance: ~98.80
Current consolidation: 97.90-98.20
Support zone: ~97.85-98.00
Major support: ~97.25
52-Week Low: 96.218
Key Support and Resistance Levels
Resistance Levels:
98.177 - Day's high / immediate resistance
98.15 - BNY trigger level for momentum buying
98.80 - Secondary resistance zone
99.00 - Psychological resistance
99.25 - Major resistance zone
100.00 - MAJOR PSYCHOLOGICAL RESISTANCE
110.176 - 52-WEEK HIGH
Support Levels:
97.959 - Recent low
97.915 - Day's low / immediate support
97.85-98.00 - Support zone
97.50 - Secondary support
97.25 - Major support
96.50 - Deep support
96.218 - 52-WEEK LOW (critical)
Pattern Analysis
Descending Wedge Characteristics:
Pattern duration: Several weeks
Wedge narrowing toward apex
Volume typically decreases in wedge
Breakout direction: Usually bullish (70% of cases)
Target: Measured move = wedge height at breakout
Current position: Near bottom of wedge
Ascending Channel (Within Wedge):
Small ascending channel forming
Higher lows: Bullish sign
Could be early reversal signal
Watch for breakout above 98.80
Moving Average Analysis
Price trading below major moving averages
MAs sloping downward - bearish alignment
Short-term MAs below long-term MAs
Death cross patterns on longer timeframes
MAs providing dynamic resistance on rallies
SCENARIO ANALYSIS
BULLISH SCENARIO - Descending Wedge Breakout
Trigger Conditions:
2H close above 98.80 (wedge resistance)
Break above 99.00 psychological level
Volume confirmation on breakout
FOMC minutes hawkish surprise
Risk-off sentiment boosting Dollar
Price Targets if Bullish:
Target 1: 99.25 - Major resistance zone
Target 2: 100.00 - Psychological level
Target 3: 101.00-102.00 - Measured move target
Extended: 103.00+ (trend reversal)
Bullish Catalysts:
Descending wedge = bullish reversal pattern (70% breakout up)
Ascending channel forming at bottom
US economic data still solid (GDP +4.3%)
Oversold conditions (-9.58% YTD)
Safe-haven demand potential
FOMC minutes could be hawkish
"US exceptionalism" positioning could return
Mean reversion from extreme weakness
BEARISH SCENARIO - Wedge Breakdown / Continuation
Trigger Conditions:
Break below 97.25 major support
Close below 97.00
FOMC minutes dovish
Fed signals more aggressive rate cuts
Dovish Fed Chair announcement
Price Targets if Bearish:
Target 1: 97.25 - Major support
Target 2: 96.50 - Deep support
Target 3: 96.218 - 52-week low
Extended: 95.00-96.00 (new lows)
Bearish Catalysts:
-9.58% YTD - Worst year since 2017
Technical rating: SELL
Fed rate cuts expected (~50 bp in 2026)
Dovish Fed Chair concerns (Hassett)
Fed liquidity injection ($40B/month)
Interest rate differentials narrowing
Trump tariff policy uncertainty
Below major moving averages
NEUTRAL SCENARIO - Consolidation in Range
Most likely short-term outcome:
Price consolidates between 97.50-98.80
Thin holiday trading continues
Wait for FOMC minutes Tuesday
Wait for Fed Chair announcement
Wedge pattern continues to compress
Breakout direction unclear until catalyst
MY ASSESSMENT - NEUTRAL with Slight Bullish Bias
The evidence is mixed, but the technical pattern suggests potential reversal:
Bullish Factors:
Descending wedge = typically bullish reversal
Ascending channel forming at bottom
Oversold conditions (-9.58% YTD)
US economic data solid
Safe-haven demand potential
Near 52-week low (mean reversion)
Bearish Factors:
Technical rating: SELL
Fed rate cuts expected
Dovish Fed Chair concerns
Fed liquidity injection
Interest rate differentials narrowing
Below major moving averages
Worst year since 2017
My Stance: NEUTRAL - Wait for Confirmation
The descending wedge pattern suggests potential bullish reversal, but fundamental headwinds are strong. The Dollar could go either way from here. Wait for FOMC minutes and a clear breakout before committing.
Strategy:
Wait for breakout confirmation
Long above 98.80 with targets 99.25, 100.00
Short below 97.25 with targets 96.50, 96.218
Respect the wedge pattern
FOMC minutes Tuesday = key catalyst
Trade Framework
Scenario 1: Bullish Breakout Trade Above 98.80
Entry Conditions:
2H close above 98.80
Volume confirmation
Break above descending wedge resistance
Trade Parameters:
Entry: 98.85-99.00 on confirmed breakout
Stop Loss: 98.00 below recent support
Target 1: 99.25 (Risk-Reward ~1:0.5)
Target 2: 100.00 (Risk-Reward ~1:1.2)
Target 3: 101.00-102.00 (Measured move)
Scenario 2: Bearish Breakdown Trade Below 97.25
Entry Conditions:
2H close below 97.25
Volume confirmation
Break below major support
Trade Parameters:
Entry: 97.20-97.00 on confirmed breakdown
Stop Loss: 97.80 above recent resistance
Target 1: 96.50 (Risk-Reward ~1:1)
Target 2: 96.218 (52-week low)
Target 3: 95.50-96.00 (Extended)
Scenario 3: Range Trade (Neutral)
Entry Conditions:
Price bounces at 97.50-97.85 support
Bullish rejection candle
No breakout yet
Trade Parameters:
Entry: 97.50-97.85 at support
Stop Loss: 97.00 below major support
Target 1: 98.50 (Risk-Reward ~1:1)
Target 2: 98.80 (Wedge resistance)
Risk Management Guidelines
Position sizing: 1-2% max risk per trade
Wait for breakout confirmation
Thin holiday volumes = wider stops
FOMC minutes Tuesday = key catalyst
Don't anticipate breakout direction
Scale out at targets
Move stop to breakeven after first target
Watch for Fed Chair announcement
Invalidation Levels
Bullish thesis invalidated if:
Price closes below 96.218 (52-week low)
Descending wedge breaks down
Fed signals aggressive rate cuts
Dovish Fed Chair confirmed
Bearish thesis invalidated if:
Price closes above 99.25 (major resistance)
Descending wedge breaks up with volume
Fed signals no more rate cuts
Risk-off surge boosts Dollar
Key Events to Watch
FOMC Minutes - Tuesday, December 30
Fed Chair Announcement - Early 2026
Year-End Positioning - Through January 1
BOJ Policy Signals - January 23 meeting
ECB Policy - February 5 meeting
Conclusion
The US Dollar Index is at a critical inflection point, trading at 98.130 within a descending wedge pattern. The Dollar is on track for its worst year since 2017 with -9.58% YTD losses, but a potential bullish reversal pattern is forming.
The Numbers:
Current Price: 98.130
YTD Performance: -9.58%
1-Year Performance: -9.21%
52-Week High: 110.176
52-Week Low: 96.218
Technical Rating: SELL
Key Levels:
99.25 - Major resistance
98.80 - Wedge resistance / breakout level
98.13 - Current price
97.85-98.00 - Support zone
97.25 - Major support
96.218 - 52-WEEK LOW
The Setup:
Descending wedge pattern with ascending channel forming at bottom. Fundamentals are bearish (Fed rate cuts, dovish Fed Chair concerns), but technicals suggest potential reversal. FOMC minutes Tuesday could be the catalyst.
Strategy:
NEUTRAL stance - wait for confirmation
Long above 98.80, target 99.25, 100.00
Short below 97.25, target 96.50, 96.218
FOMC minutes Tuesday = key catalyst
Respect the pattern
The Dollar is at a crossroads. The descending wedge suggests potential bullish reversal, but fundamental headwinds remain strong. Wait for the breakout.

Regime Detection: The AI Trader's Secret Weapon
Your Strategy Didn’t "Stop Working" - The Market Regime Changed
Every trader knows the feeling:
Same signals
Same rules
Suddenly, completely different results
Most people call this "my edge stopped working".
Often, the truth is simpler: the regime changed, but your strategy didn’t.
---
What We Really Mean by "Regimes"
Regimes are just labels for how the market is behaving:
Trending vs ranging
High volatility vs low volatility
Risk‑on vs risk‑off
AI and systematic tools see this in the data:
ATR, realized volatility, and correlation spikes
Trend strength from measures like ADX
Clustered patterns in returns and volume
You feel it as:
"Breakouts keep failing now"
"Mean‑reversion is getting steamrolled"
"Options premium isn't decaying like it used to"
Same observation, different language.
---
Why Regime Awareness Is Mandatory in the AI Era
When you use AI or algo systems, you're often:
Running the same rules from last month
On today's data
If the rules were built in one regime and deployed in another, results will diverge.
AI can help by:
Classifying days/weeks into regime buckets
Tracking how each strategy performs in each bucket
Alerting you when the regime label flips
But you still have to decide how your playbook changes when the label changes.
---
A Simple Regime → Strategy Mapping
You don’t need complex ML to get started. Even a basic map helps:
Trending + Normal Vol → Trend‑following systems sized normally
Trending + High Vol → Same systems, reduced size, wider risk buffers
Ranging + Low Vol → Mean‑reversion and carry trades
Choppy + High Vol → Trade less, focus on defense, maybe only scalp
AI can refine the labels; your job is to define what each label means for you

AI Trading Fundamentals: The Trinity of Success
Most Traders Obsess Over Strategy - and Ignore the Two Things That Actually Save Them
In the AI trading era, it's easy to get lost in models, indicators, and signal quality.
But beneath every durable trading approach — manual or automated — there are only three pillars:
Edge – a real, testable reason your trades make money over time
Risk – how much you lose when you're wrong
Execution – how consistently you follow the plan
Remove any one, and the entire structure collapses.
Pillar 1: EDGE – Why This Should Work at All
In a world of AI‑generated strategies and infinite backtests, edge has to mean more than "the curve looks nice".
Ask your system:
What market behavior is this exploiting?
Why should that behavior continue ?
What market conditions break this logic?
If your only explanation is "the bot backtested well", you don't have an edge. You have a story.
Pillar 2: RISK – How You Survive Your Own Edge
Even a strong edge comes with:
Losing trades
Losing streaks
Drawdowns that feel worse live than on paper
In the AI era, risk decisions include:
Position sizing rules for each strategy
Portfolio‑level exposure caps across multiple bots/systems
Maximum drawdown and daily loss limits that auto‑trigger when hit
Edge without risk is just leverage pointed at a wall.
Pillar 3: EXECUTION – Where Most Traders Quietly Lose
Execution is simply: Did you do what your plan said, when it said to do it?
With AI tools, this becomes:
Did you take every valid signal, or did you cherry‑pick?
Did you change parameters mid‑drawdown "to feel safer"?
Did you override bots based on fear or FOMO?
AI is excellent at pure execution. Humans are not. The hack is to let algorithms handle the rules - and keep humans in charge of designing those rules and managing risk.
Putting It Together in the AI Era
When you review your trading or systems, don't just ask "Did I make money?". Ask:
Edge: Do I still understand why this works? Has the market changed?
Risk: Are my size, drawdown limits, and kill switches clear and enforced?
Execution: How often did I actually follow the plan?
For most traders, the weakest pillar isn't edge - it's risk or execution.

Your Trading Algorithm's Report Card: The Year-End Review
Forget New Year’s Resolutions — Give Your Trading a Real Audit
At the end of the year, most traders do one of two things:
Celebrate if they made money
Blame the market if they didn't
Neither of those changes anything.
In the AI era — where your tools can track every trade, every decision, every bot run — there's no excuse not to sit down once a year and ask: "What actually happened here?"
Why a Year‑End Audit Matters More With AI
When you're using AI tools or bots, you aren't just grading yourself. You're grading:
Your systems (manual or automated)
Your risk framework
Your behavior around those systems
Without an audit, it's easy to:
Blame the bot for what was actually poor risk management
Assume an edge that only worked in one regime
Miss the fact that overrides did more harm than good
Four Lenses for Your Year‑End Review
Performance – cold, hard numbers
Total return vs a simple benchmark ( AMEX:SPY , $CRYPTO:BTC, etc.).
Maximum drawdown — did it match what you thought you could handle?
Expectancy per trade and per system.
Process – did you do what you said you would?
How often did you follow your rules exactly?
How often did you override AI or system signals?
Did you journal or track reasons for trades?
Strategy – did your ideas actually have edge?
Which strategies carried the year?
Which consistently bled capital?
Did you unknowingly just ride a bull market?
Behavior – how you handled stress, FOMO, and drawdowns
Did you stick to size limits during losing streaks?
Did you revenge trade after losses?
Did you turn bots off or on based on feelings instead of rules?
Turning Reflection Into an Actual Plan
After the audit, write down three lists:
STOP – behaviors, markets, or strategies that clearly don't work for you.
START – habits you know would have helped (journaling, monthly reviews, better risk checks).
KEEP – strengths you want to double down on.
Then convert them into specific goals:
"Reduce discretionary overrides to <5% of total trades"
"Run walk‑forward tests on any new AI strategy before going live"
"Review performance on the first weekend of every month"
In the End, Data > Stories
The point of a year‑end audit isn't to beat yourself up.
It's to replace:
"I think I did okay this year"
with:
"My systems returned X%, max drawdown was Y%, my biggest leak was Z, and here’s exactly what I’m changing."
In a world where AI can track every detail of your trading, the traders who win are the ones willing to look at those details honestly.

Pattern Recognition: When Human Eyes Beat AI (And Vice Versa)
Humans are extremely good at:
Seeing context – earnings, news, macro backdrop
Interpreting imperfect structures – patterns that are "close enough"
Integrating non‑price information – sentiment, positioning, narrative
Your brain doesn't just see candles. It sees:
"This breakout is happening after a long base in a strong sector"
"This double top is forming into bad macro data"
That's powerful — but it's also where bias sneaks in.
The Machine's Pattern Edge
AI and algorithms are extremely good at:
Applying the same rules to every chart, every time
Scanning thousands of symbols and timeframes
Measuring pattern statistics across huge samples
Where we say "this looks like a flag", AI says:
Length: X bars
Pullback depth: Y%
Breakout follow‑through: average Z%
That objectivity is exactly what humans lose when they care about a trade.
When Humans Win, When AI Wins
Context‑Heavy Patterns (breakouts into news, sector flow, macro themes)
Human advantage: you can weigh "should this pattern even matter here?"
Simple, Repetitive Structures (candlestick patterns, basic ranges)
AI advantage: it will find and log them the same way at scale.
Fuzzy, Subjective Lines (trendlines, channels)
Best as collaboration: AI can test many definitions, you decide which make sense.
The future isn't about proving humans "better" or AI "better". It's about giving each the jobs they're built for.
A Practical Human + AI Workflow
Let AI Scan
Use screeners or pattern tools to surface potential flags, wedges, ranges, reversals.
Apply Human Context
Filter based on news, sector, macro, and your playbook.
Use AI Again for Confirmation
Check volume, volatility, and historical stats for similar patterns.
Execute Systematically
Turn your pattern rules into clear conditions; automate where possible.
In the AI Era, Know Your Role
Your edge as a human isn't out‑calculating the machine. It's:
Defining what "quality" patterns look like in your framework
Deciding which AI signals to care about and which to ignore
Bringing discipline and risk management to whatever patterns you trade
Let AI do the heavy lifting on scanning and counting. Save your limited attention for the handful of setups that truly deserve it.

EURUSD Key Levels: Failure vs Continuation Points Today's focus: Key structural levels that determine EURUSD's next move. No predictions—just price behaviour and structural points.
💡 Trading Philosophy:
"Trade what you SEE, not what you THINK."
This is the foundation of mechanical trading. Stop predicting. Start observing structure and reacting to what price actually does at key levels.
📊 Current EURUSD Structure:
Trading At: 1.17197 (Structural Point)
Key Observation:
We have NOT seen a failure at this level yet. Price is holding structure, which suggests selling continuation is the higher probability scenario.
🎯 Downside Levels (Selling Continuation):
Next Target: 1.17033
If 1.07197 holds as structure, this is the next downside objective.
Major Level Below: 1.16821 (Previous Momentum High - TURNCOAT)
This was former resistance that has now been tested and turned into support. This is a critical "turncoat" level—resistance became support, making it a high-probability bounce zone.
🔼 Upside Levels (If Structure Breaks):
If price fails at current structure and breaks higher, watch these levels:
Level 1: 1.1750
Level 2: 1.1762 (Momentum High)
Level 3: 1.1841 (Current Momentum High)
These become your upside targets IF the current structure fails to hold.
For Detailed Context:
Check my previous EURUSD posts for the bigger picture wave structure and how we arrived at these levels.
👍 Boost if this structural breakdown helps
👤 Follow for continued EURUSD level updates
💬 Are you trading what you SEE or what you THINK?

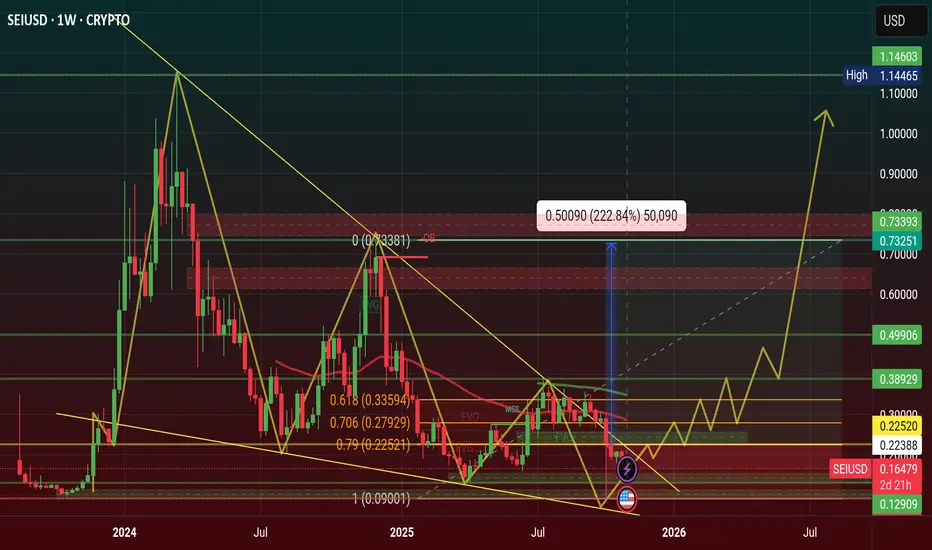
$SEI Price will hit $1.22 in 2026, Falling Wedge Pattern WeeklySEI price is showing a Bullish Pattern of Falling Wedge Pattern, when this pattern will create on chart after price will be upward direction.
Price Will hit $1.11 in 2026 and 2027 is $2.22, $3.33
Entry Point is $0.22, $0.27, $0.33 and Stoploss point $0.09
2026 Target point $0.49, $0.77, $1.11
2027 Target point $2.22, $3.33
#trending #Highlight #trendingideas #SEI #SUBROOFFICIAL
Disclaimer: This article is for informational purposes only and does not constitute financial advice. Always conduct your own research before making any investment decisions. Digital asset prices are subject to high market risk and price volatility. The value of your investment may go down or up, and you may not get back the amount invested. You are solely responsible for your investment decisions and Binance is not available for any losses you may incur. Past performance is not a reliable predictor of future performance. You should only invest in products you are familiar with and where you understand the risks. You should carefully consider your investment experience, financial situation, investment objectives and risk tolerance and consult an independent financial adviser prior to making any investment.
$XAU will hit $5,555 Incredible Price In 2026Gold Price Showing Bullish Accending Triangle Pattern in chart, this pattern move Upward Direction and price up ATH area. than price Consolidate this area than price Move Up $4,545, $4,747, $4,949 area and $5,252 area in 2026, Surprised Price Will Be $5,555 best of the year of Gold.
TVC:XAU Buy Position Setup
Three Buy Zone of Golden Fibonacci levels, areas is $3,933, $3,980, $4,029, it's a Key Support area. Stoploss area $3,815 and it's Strong Support areas.
Dynamic Resistance area Is new ATH area $4,398, and Three Target area, $4,103, $4,233, $4,375, of 11.11% Roi. if price up Retested than Breakout Key Support area.
#gold #smartmoneyconcept #highlight #XAU #SUBROOFFICIAL
Disclaimer: This article is for informational purposes only and does not constitute financial advice. Always conduct your own research before making any investment decisions. Digital asset prices are subject to high market risk and price volatility. The value of your investment may go down or up, and you may not get back the amount invested. You are solely responsible for your investment decisions and Binance is not available for any losses you may incur. Past performance is not a reliable predictor of future performance. You should only invest in products you are familiar with and where you understand the risks. You should carefully consider your investment experience, financial situation, investment objectives and risk tolerance and consult an independent financial adviser prior to making any investment.

Did you Know ?!!!Did you really think that profiting from the current bull run (a comprehensive upward market) would be easy? Don't be naive. Do you think they will let you buy, hold, and sell at low levels without any struggle? If it were that simple, everyone would be rich. But the truth is: 90% of you will lose. Why? Because the crypto market is not designed for everyone to win. They will shake you. They will make you doubt everything. They will panic you and sell at the worst possible moment. Do you know what happens next? The best players in this game buy when there is fear, not sell; because your panic gives them cheap assets. This is how the game goes: strong hands feed off weak hands. They exaggerate every dip, every correction, every sale. They make it look like the end of the world so that you abandon everything, and when the market starts up again, you'll sit there saying, "What the heck just happened?" This is not an accident. It's a system. The market rewards patience and punishes weak emotions. The big players already know your thoughts. They know exactly when and how to stir fear to make you give up. Because when you panic, they profit. They don't play the market. They play you. That's why most people never succeed. Because they fall into the same traps over and over again. People don't realize that dips, FUD (fear, uncertainty, doubt), and panic are all part of the plan. But the winners? They digest the noise. They know that fear is temporary, but smart decisions last forever. We've seen this hundreds of times. They pump the market after you sell. They take your assets, hold them, and sell them to you at the top, leaving you with nothing, wondering how it happened. Don't play their game. Play your own.
REMEMBER

$PUMP Pumping Hard this Bull Run $0.011220 in 2026 NYSE:PUMP COIN INFO
Support Level Price $0.002259 and Resistance level price $0.008969 and it's a Historical ATH level price $0.008999 , in 2026 parabalic bull run price will rising $0.011222 surge 222% Roi in 3 months
Pump.fun’s native token PUMP has quickly become one of the most talked-about memecoins in the Solana ecosystem. Built as a creator-first launchpad, Pump.fun lets communities directly back their favorite creators while sharing in their success.
With its viral “no-code” model, Pump.fun aims to disrupt traditional Web2 social platforms and carve a dominant role in Solana’s DeFi landscape.As of writing, the PUMP price has proven to be a bigger attraction after showing fantastic price action in Q3 2025. As a result, the token has surged in popularity across exchanges and social media, and many experts are raising questions about its potential to climb even higher in the coming years.
Major Developments That Fueled PUMP’s Rally
The Q3 saw many altcoin’s rally including PUMP, this happened with a trigger from Binance US listing. It turned out as a major catalyst for the surge in PUMP price, accompanied by a 350 million PUMP reward campaign that caught traders’ attention. In September alone, PUMP gained over 180% to $0.00899 creating a new ATH before a pullback.
Meanwhile, Pump.fun has been using more than 98% of its platform revenue to buy back tokens, directly supporting price action. This aggressive strategy has turned Pump.fun into one of the most profitable DeFi projects on Solana, boosting trader confidence.
PUMP.Fun Price Analysis For October 2025
From a short-term technical viewpoint, the PUMP price chart showed significant strength in Q3, marked by a breakout from a slanted double-bottom pattern. This bullish momentum successfully drove the price to an All-Time High (ATH) of $0.00899 by mid-September.
Following the ATH, a period of profit-taking began, which was severely accelerated and worsened by a massive market liquidation event from Oct. 10 to 11.
This event was triggered by the re-emergence of conflicts between the US and China over trade tariffs, which rattled not just the crypto sector but the entire financial landscape. This pressure pushed the PUMP price down sharply to the critical support area of $0.0035 to $0.0036. Investors are trying to sustain the price damages at this foundational support, as a reason why its consolidating at support, currently.
Pump.fun Price Surges – Is $0.0075 Possible?
Pump.fun has walked into October with a powerful burst, as its price jumps up by 16.55% overnight to $0.006422. With a market cap now towering at $2.26 billion and trading volume spiking 37.53% in 24 hours, Pump.fun sits squarely in the crypto spotlight. This momentum isn’t coming out of nowhere, as I’m seeing decisive moves by major holders, explosive social buzz, and promising technical signals. Let’s break down what’s fueling this trend and what could come next.
Why is PUMP’s Price Up?
Pump.fun’s recent price surge is rooted in three interconnected factors. First, whale accumulation is picking up big-time. Over 24,000 wallet addresses now hold at least 10,000 PUMP tokens, matching a massive 70% price run in September. In my view, when whales move in sync, it often sparks broader investor confidence and can preface new highs. However, with 60% of ICO-era whales still in play, there’s the risk of sudden profit-taking if these giants decide to cash out.
Second, social media is supercharging attention, but not without controversy. Solana’s Anatoly Yakovenko recently called Pump.fun a contender to rival TikTok. Thereby, citing its livestreaming tools and crypto-native monetization twist. That comment alone stoked a fresh wave of speculation and saw the token climb 90% over the past month. Still, protocol revenue has actually fallen 72% in the last two weeks, and fewer fresh tokens are launching, signaling a possible cooling off beneath all the hype.
PUMP Price Analysis
Technically speaking, Pump.fun price has reclaimed its 7-day SMA at $0.0055 and now eyes the $0.0075 resistance. The 4-hour chart shows a clear ascending channel, suggesting traders expect more upside. The RSI sits at 64.95, under the classic overbought threshold, which means there’s still some runway before euphoria peaks.
Is it safe to invest now, considering whale activity?
Whale moves can lift prices but also cause sharp drops if they exit. If Pump.fun holds above $0.0065, it could be bullish, but watch for signs of profit-taking or declining protocol engagement.
Where is resistance, and what comes next?
Immediate resistance sits around $0.0075, breaking above this could confirm a new uptrend.
#Write2Earn #BinanceSquareFamily #Binance #PUMP #SUBROOFFICIAL
Disclaimer: This article is for informational purposes only and does not constitute financial advice. Always conduct your own research before making any investment decisions. Digital asset prices are subject to high market risk and price volatility. The value of your investment may go down or up, and you may not get back the amount invested. You are solely responsible for your investment decisions and Binance is not available for any losses you may incur. Past performance is not a reliable predictor of future performance. You should only invest in products you are familiar with and where you understand the risks. You should carefully consider your investment experience, financial situation, investment objectives and risk tolerance and consult an independent financial adviser prior to making any investment.
