Am Back!!!!!After a long while guys....am back.
Without bothering u on all the details....let's get into today's breakfast(London time)...
If u saw the bullish setup before me....
Indicate below.....u must be really smart!!
If u didn't....dosent matter...(we are eating today, probably...)
Okay....EURAUD has been in a strong uptrend on the Daily and even 4H.....
A retracement to the previous pullback level just happened.(fib 50&60)
Plus.....its in an Ending Diagonal on the 4H..
The probability for a bullish recovery is high
An going in on the LTF with my killer techniques..... Feel free to join me with any entry strategy u have....
Like
......and subscribe......or I'll take ur stop loss😆
Trendlinebounce

BTCUSDT - Classic Bump and Run MethodHi Traders, Investors and Speculators of the Charts 📈📉
Ev here. Been trading crypto since 2017 and later got into stocks. I have 3 board exams on financial markets and studied economics from a top tier university for a year.
Today's analysis on Bitcoin is purely trend-based and focused on the MACRO trend. (If you're looking for a technical indicator analysis, take a look at this one : )
If you're looking for a comprehensive update on the Bump and Run Method, you can find it here:
All in all, if timelines are considered BTC is due for a Bullish cycle. This doesn't mean we can't go sideways for a while, but it seems highly likely that the accumulation phase is now over. Another reason why I am bullish on Bitcoin is due to the uncertainty regarding banks at the moment. Check out the two posts linked to related ideas below, they cover all of that information.
_______________________
📢Follow us here on TradingView for daily updates and trade ideas on crypto , stocks and commodities 💎Hit like & Follow 👍
We thank you for your support !
CryptoCheck

predictive analysis of nse torntpower in wcb.NSE:TORNTPOWER tested the upward trend channel zone and major support zone and reversed till now in wcb chart. drawn future paths according present price action and supply demand zones.

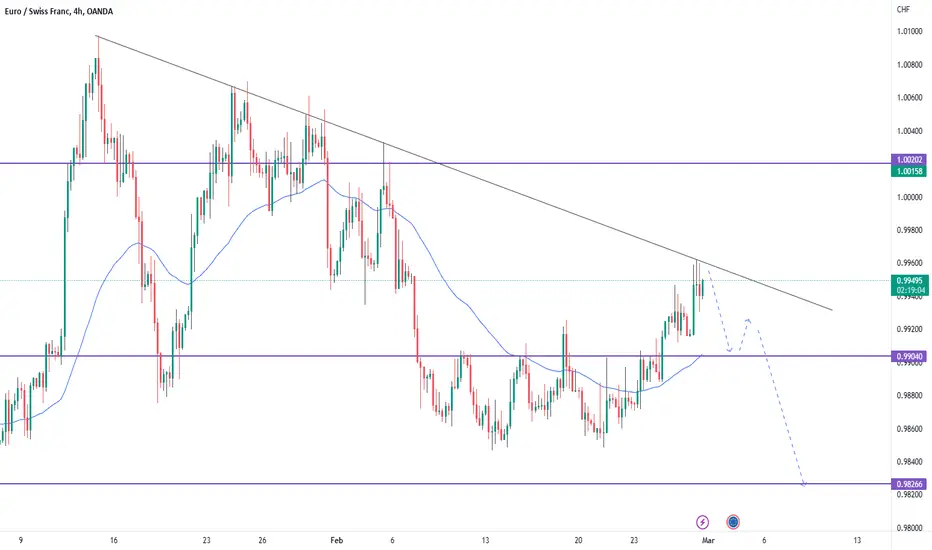
EURCHF Downtrend ContinuationEURCHF experienced bullish pressure to approach the trendline resistance at 0.99600 but could not break above it.
The bearish bounce suggests the downtrend could resume with an initial target at 0.99000 support.
A break below 0.9900 will open the way to 0.98230.
Alternatively, a break above the resistance will extend the bullish retracement towards 1.00202.
Sell EURAUD SetupHello ! According To Me , First Market Should Go Up To 1.5720 , If 4 Hour Candle Close Below Channel Resistance Line 1.5710 Then you Can Take Short Position . I Have Mention TP/SL/Entry Point In Chart . I Hope This Trade Will Give Us Good Profit .
Thank you

Ocean/USDT nice retest of trendlineOcean is showing a strong rising trendline from the start of january. Ocean broke the trenline and now retests the trendline for a SR Flip.
I am long on the retest of this trendline with the targets as published in the chart

Bitcoin Hammers ceremony in 4HHi friends.
I see about 4 hammers on a strength Trendline and i think price
will go to the upper band i have shown on my chart.
If the price surpass this 24000 resistance level
after a pullback to this level , we will see a huge increase in BTC in coming days.
Dont forget we are in a 4H time frame and this trendline is very important.
In addition this hammers shape in an important support level (22500) too.
after price reach this path i draw in my chart we should look it again to update our
analysis.
so if you enter a trade dont forget to set your SL below this support level and choose the upper
line for your TP.(I show it on my chart and its R/R is 2.6 its good i think! )
Hope you enjoy this analysis.
share me your opinion
I will be happy.
Thanks for reading my idea
Love you all

AUDNZD SELL FOR SHORT-TERM?Technically, right now price at previous SBR zone, where the zone already tested and not fresh. But it might react for 2nd to go down. However i aspect the down is just for short term as correction. So SELL for Short-Term and BUY for Long-Term is for me perfect in this situation.

XAUUSD GOLD SWING BUY ?!This is purely 100% on Technical Analysis view.
Right now price on Weekly Resistance Become Support (RBS) area, where it a potential Buy area. The same area also exactly on Daily Rally Base Rally (Demand) area. Additionally, it's fall on H4 Trendline to support the price. This 3 thing are confluence at same place.
BUT, bare in mind about Fundamental of USD.

USDJPY I Short from psychological resistance zone Welcome back! Let me know your thoughts in the comments!
**USDJPY Analysis - Listen to video!
We recommend that you keep this pair on your watchlist and enter when the entry criteria of your strategy is met.
Please support this idea with a LIKE and COMMENT if you find it useful and Click "Follow" on our profile if you'd like these trade ideas delivered straight to your email in the future.
Thanks for your continued support!

USDJPY BEARISH VIEWUSDJPY still looks bearish to me and will hold the daily trend line. Still waiting for another push to the downside

AUDCAD Trapped on Buy ChannelI personally Looking for buy opportunities at Rally Base Rally on H4 and swing until at lease previous swing high (resistance).

2020: SABIC-Agri (Bullish Setup)Completion of Harmonic Pattern
Respecting Strong Trendline Support
Entry @current level
Trade with specified Stop Loss
Enjoy the ride
Fib Levels for TPs
Manage your risk accordingly

USDJPY I Potential buy from demand zoneWelcome back! Let me know your thoughts in the comments!
**USDJPY Analysis - Listen to video!
We recommend that you keep this pair on your watchlist and enter when the entry criteria of your strategy is met.
Please support this idea with a LIKE and COMMENT if you find it useful and Click "Follow" on our profile if you'd like these trade ideas delivered straight to your email in the future.
Thanks for your continued support!

PARA: bounce play at pretty big supportPARA (Paramount)
Take the weekly chart, connect the lows since 2009 and you get a nice trend line .
Price seems to react to this area so the risk reward is quiet good here for a long swing trade .
The trend line is your support.
16 is your stop.
I'm targeting 19.40 and 20.71, then we reevaluate.
For those who want to invest for the long term, PARA offers a generous dividend.
Trade safe!

📉✌BTC Daily - Will the Market go lower?✌📈BINANCE:BTCUSDT
COINBASE:BTCUSD
Market expectations are still bearish
But the possibility of a trend change is not far from expected.
If you have a sell position, risk-free it or lower your stop-loss.
Between now and the yellow area below, you can open long position in two steps.
The optimum stop-loss is on the chart.
Please share ideas and leave a comment,
let me know what you think.
CrazyS✌

4013: Dr Sulaiman Al-Habib Medi Srvcs Grp Co TADAWUL4013 is has taken support for an upside movement
Touching bottom ascending trendline support (Very strong support since 2020)
Biased: Bullish
Take buy position with stop loss
Ride with trailing stop loss

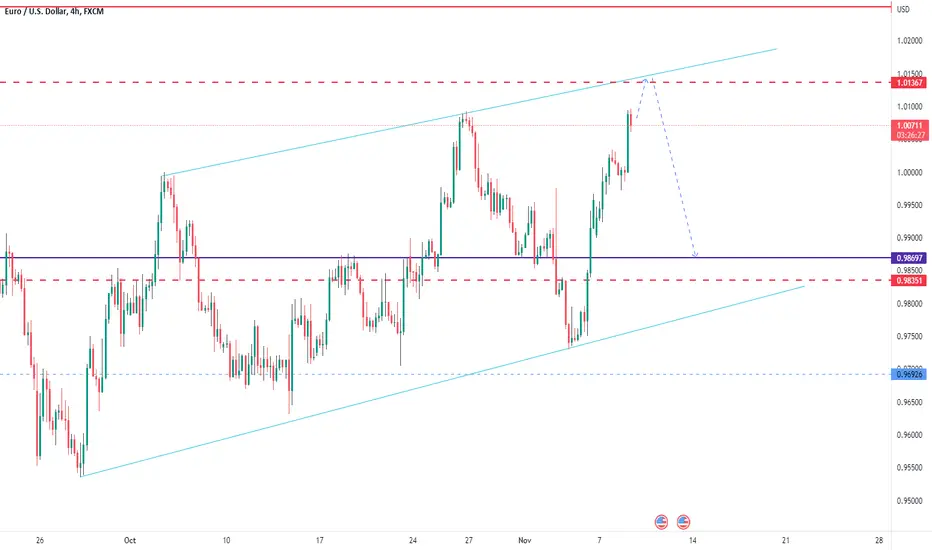
EURUSD APPROACHING RESISTANCEEURUSD has experienced strong bullish momentum and is now approaching the resistance level of 1.01370 from where we can expect a pullback.
Possible retracement targets are 0.99430 and 0.98700.
Watch for price rejection on trendline resistance before going short.
EU SELL AT RETESTPendin short based on the overall market bias for eu especially on this charts confluences...

Audcad long Am entering this high probability confluence setup......
A confluence of a demand zone, a trend line and a fib level has occurred on the 4hourly chart.....am going in for a quick 6.6R......Like and Subscribe .....maintain strict Risk and Money management and Let's ROLL.....
Peace!.

GEO daily bearish hammerOrder SELL GEO NYSE Stop 8.18 LMT 8.18 will be automatically canceled at 20230401 01:00:00 EST
GEO daily bearish hammer at short term downtrend line. Stop loss above local high, take profit at MA 100.

CADCHF - SELLOn CADCHF, we have a break and retest set up with the previous support acing as resistance on the downtrend which is also correlating with the 3rd touch trend line

Eurchf potential trend line bounceEurchf has approached a strong Hourly ascending trend line....coupled with the confluence of a demand zone, a strong bullish reaction may occur on the pair...
Like and subscribe.
