JPY/USD Descending Triangle Breakdown – Bearish Trading Setup📌 Overview: Understanding the Current Market Structure
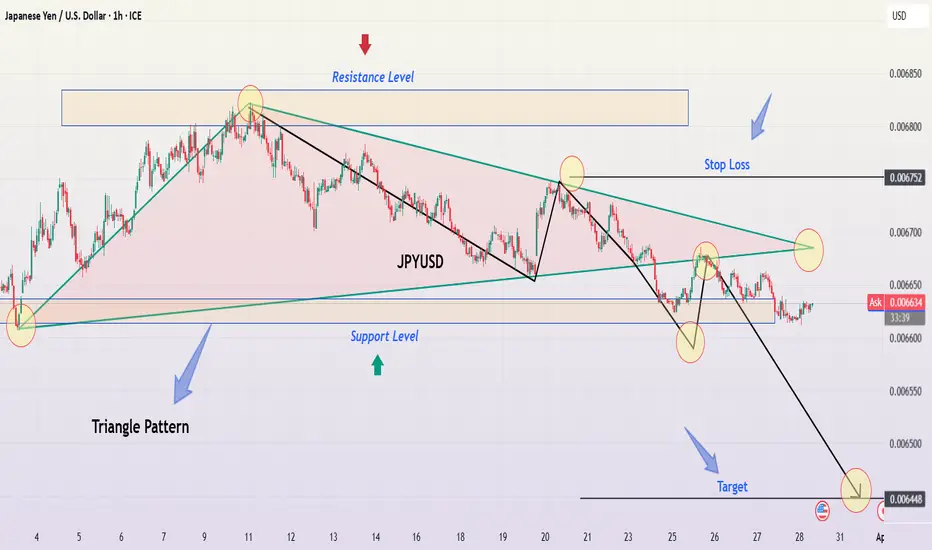
This analysis focuses on the JPY/USD pair on the 1-hour timeframe, highlighting a well-defined descending triangle pattern, a classic bearish continuation setup. The price action indicates selling pressure increasing as lower highs form, while support remained relatively stable before ultimately breaking down.
This setup suggests a potential trend continuation to the downside, making it a compelling trade opportunity for short-sellers. Let's dive deeper into the technical breakdown, trading strategy, and market expectations.
📊 Technical Breakdown: Chart Pattern Analysis
1️⃣ The Descending Triangle Pattern: A Bearish Signal
The descending triangle is one of the most reliable continuation patterns in technical analysis, often leading to a breakdown when support is breached. This chart confirms the pattern through:
✅ Downward Sloping Resistance Line:
The price tested this level multiple times but was consistently rejected.
Lower highs indicate sellers are dominating and buyers are failing to push higher.
✅ Flat Support Level:
The price found strong support at a key horizontal level, bouncing off multiple times.
However, each bounce became weaker, signaling buyers losing strength.
✅ Breakout & Confirmation:
The final breakdown below support occurred with strong momentum.
The price has now turned previous support into resistance, a bearish confirmation.
🔎 Implication:
A descending triangle breakout to the downside often results in an extended downward move, aiming for the measured move target based on the triangle’s height.
2️⃣ Key Price Levels & Trading Zones
📌 🔴 Resistance Zone (Upper Triangle Boundary):
0.006700 – 0.006750
This level acted as a strong rejection zone, confirming lower highs.
It now serves as a resistance level after the breakdown.
📌 🟢 Support Level (Triangle Base):
This level previously held price from breaking lower multiple times.
However, with each bounce becoming weaker, it finally gave way.
Break & Close below this level confirms the bearish continuation.
📌 🎯 Target Projection (Based on Triangle Breakout):
0.006448 (Final Target) – This level aligns with historical price action and the triangle’s projected move.
📌 🚨 Stop Loss Placement:
Above the last swing high (~0.006752)
If price reclaims this zone, the bearish outlook becomes invalid.
📈 Price Action & Market Sentiment
3️⃣ Bearish Momentum & Breakdown Confirmation
✅ Lower Highs Indicate Weakness:
Buyers attempted multiple recoveries but were consistently rejected at lower levels.
This pattern suggests exhaustion in buying pressure.
✅ Breakout Candle Strength & Volume Confirmation:
The price broke support with strong momentum and increased volume, confirming sellers’ control.
A breakdown without volume is often a fakeout, but this chart shows clear momentum.
✅ Potential Retest Before Further Drop:
After a breakdown, price often retests the broken support before continuing lower.
A pullback to the resistance zone (~0.006650 - 0.006700) could offer an ideal short entry.
✅ Bearish Trend Confirmation:
The price remains below key resistance and continues forming lower lows.
The downtrend structure remains intact, reinforcing the bearish sentiment.
📉 Trading Strategy: How to Trade This Setup?
🔹 Entry Strategy:
Ideal Entry: Short after a pullback to broken support (~0.006650 - 0.006700).
Aggressive Entry: Short immediately on the breakdown if momentum remains strong.
🔹 Stop Loss Placement:
Place above last swing high (0.006752) to avoid being stopped out by noise.
Ensures protection against sudden bullish reversals or fakeouts.
🔹 Take Profit Targets:
✅ First Target: 0.006500 (Psychological level)
✅ Final Target: 0.006448 (Triangle measured move)
🔹 Risk Management:
Use a Risk-to-Reward ratio (RRR) of at least 1:2 for an optimal trade setup.
Never risk more than 2% of total capital per trade.
⚠️ Market Outlook & Key Watchpoints
📌 Scenario 1: Bearish Continuation (High Probability)
If price retests the broken support and faces rejection, expect further downside.
Target remains at 0.006448.
📌 Scenario 2: Fake Breakdown & Bullish Reversal (Low Probability)
If price closes above 0.006750, it invalidates the bearish setup.
In that case, a bullish move towards 0.006800+ is possible.
📢 Final Thoughts:
The bearish breakout is clear, but waiting for a proper pullback before entry is ideal.
Volume confirmation is crucial to avoid fakeouts.
If support turns into resistance, a high-probability short trade is set up.
🔹 What’s your take on this setup? Will JPY/USD reach its target? Drop your thoughts below! 🚀
#JPYUSD #ForexTrading #TechnicalAnalysis #PriceAction
Trianglepatterns
Gold (XAU/USD) – Triangle Breakout & Bullish Trade Setup Overview
This 1-hour Gold Spot (XAU/USD) chart showcases a well-defined symmetrical triangle pattern, which has successfully broken out to the upside. This breakout indicates strong bullish momentum, setting up a potential rally towards $3,107 and beyond.
The analysis below will cover:
✅ Triangle Pattern Formation & Breakout Explanation
✅ Key Technical Levels (Support, Resistance, ATH)
✅ Entry, Stop Loss, & Take Profit Strategies
✅ Risk Management Considerations
✅ Final Trade Setup & Market Sentiment
Let’s dive into the details.
1️⃣ Chart Pattern: Symmetrical Triangle Formation
What is a Symmetrical Triangle?
A symmetrical triangle is a common continuation pattern in technical analysis that forms when price consolidates within two converging trendlines. This structure indicates a period of indecision in the market before a potential breakout occurs.
When price breaks above the upper trendline, it signals a bullish continuation.
If price breaks below the lower trendline, it suggests a bearish move.
In this case, gold has broken above the upper resistance trendline, signaling a continuation of the existing uptrend.
Pattern Breakdown (Step by Step):
Triangle Formation: The price made higher lows and lower highs, compressing within the pattern.
Price Squeeze: As the market approached the apex of the triangle, volatility decreased, indicating an imminent breakout.
Breakout Confirmation: A strong bullish candle closed above the resistance trendline, validating the pattern and confirming bullish momentum.
2️⃣ Key Technical Levels & Zones
🔹 Support & Resistance Zones:
Support Level: $3,012 - $3,020 (Highlighted as a strong demand zone where buyers stepped in).
Resistance Level: $3,080 (Previously acted as strong resistance but has now turned into support post-breakout).
All-Time High (ATH): Marked just below $3,090, where price previously struggled to break through.
🔸 Breakout Target & Price Projection
Breakout Level: The breakout happened above $3,080, confirming an uptrend continuation.
Target Calculation:
The height of the triangle is projected upwards from the breakout point.
This gives us a price target of $3,107 - $3,120 in the short term.
3️⃣ Trading Strategy Based on Breakout
✅ Entry Strategy:
Aggressive Entry: Entering immediately after the breakout candle closes above $3,080, riding the momentum.
Conservative Entry: Waiting for a potential pullback to $3,080 (now acting as support) before entering a long position.
⛔ Stop Loss Placement:
Ideal Stop Loss: Below the previous support zone at $3,012, ensuring protection against fake breakouts.
Tighter Stop Loss: Just below the breakout point at $3,065, in case of a minor retracement before moving higher.
🎯 Profit Target Strategy:
Short-Term Target: $3,107, based on the triangle’s measured move.
Extended Target: If momentum sustains, $3,120+ could be achieved, aligning with previous bullish trends.
4️⃣ Risk Management & Market Considerations
Risk Factors to Monitor:
🔸 Volume Confirmation: A breakout with high trading volume is a stronger signal than one with low volume.
🔸 Market Fundamentals: Events like US inflation data, Federal Reserve rate decisions, and geopolitical tensions can impact gold prices.
🔸 False Breakout Risk: If price falls back below $3,080, the breakout might be invalid, signaling a potential reversal.
Risk-Reward Ratio:
📌 Entry: $3,080
📌 Stop Loss: $3,012 (Approx. 68 points risk)
📌 Target: $3,107 - $3,120 (Approx. 27-40 points reward)
📌 Risk-to-Reward Ratio: 2:1+, making this a favorable trade setup.
5️⃣ Market Sentiment & Final Trade Setup
📈 Bullish Outlook:
The successful breakout above the symmetrical triangle signals continued bullish strength.
Price is holding above the previous resistance zone at $3,080, now acting as support.
The next resistance target is $3,107 - $3,120, aligning with previous swing highs.
🔴 Bearish Scenario (If Invalidated):
If price falls back below $3,080, it could indicate a false breakout.
A break below $3,065 might lead to a retest of the $3,012 support zone.
📊 Final Trading Plan:
✅ Buy (Long) at: $3,080 - $3,085
🎯 Target 1: $3,107
🎯 Target 2: $3,120+ (Extended Target)
⛔ Stop Loss: $3,012
🔥 Conclusion: Bullish Bias with Caution
Gold (XAU/USD) has successfully broken out of the symmetrical triangle, signaling a strong bullish continuation. As long as price holds above $3,080, the bias remains bullish, targeting $3,107 - $3,120.
💡 Key Takeaway: Watch for a pullback and retest of $3,080 before entering, ensuring confirmation before committing to the trade.
🚀 Final Outlook: Bullish – Gold is positioned for further upside if momentum continues!

Gold (XAU/USD) Technical Analysis – Triangle Breakout & Bullish Overview of the Chart
This chart presents a daily timeframe (1D) analysis of Gold (XAU/USD) and highlights a well-defined bullish trend supported by a breakout from a triangle pattern. The overall price action suggests a strong uptrend continuation, with clearly marked support and resistance levels, trendlines, and potential trade setups.
Gold has been consistently respecting key technical levels, forming higher highs and higher lows, which is a classic indicator of a strong bullish market. Traders can use this analysis to identify entry points, stop-loss levels, and profit targets for a strategic trading approach.
Key Technical Components in the Chart
1. Triangle Pattern Formation – The Setup for Breakout
One of the most crucial formations in this chart is the triangle pattern, which acts as a continuation pattern.
The triangle pattern (highlighted in green) represents a period of consolidation where price action was squeezing between higher lows and lower highs before a breakout occurred.
This pattern suggests that buyers and sellers were in equilibrium, building up momentum before gold made a decisive move to the upside.
The breakout above the upper boundary of the triangle confirms the bullish continuation, leading to a strong rally.
📌 Technical Significance: Triangle patterns are a reliable technical structure used by traders to anticipate breakouts. The breakout direction (upward in this case) determines the next trend phase.
2. Trendline Analysis – Defining Market Structure
The dashed black trendline represents the primary ascending trendline, which has been respected multiple times, indicating that the market remains in an uptrend.
Several minor support levels (highlighted in blue) have acted as strong demand zones, preventing price breakdowns and helping sustain the bullish momentum.
A major support zone (highlighted in beige at $2,300-$2,400) serves as the base of the uptrend, where price action historically reversed strongly, indicating heavy institutional buying.
📌 Technical Significance: As long as the price remains above these support levels, the uptrend remains intact.
3. Breakout & Price Action Structure – Momentum Confirmation
The breakout from the triangle pattern signaled the beginning of a new bullish impulse wave, and the price action structure confirms this move.
Higher Highs & Higher Lows: The black zig-zag pattern represents a strong bullish structure where each retracement finds support before continuing higher.
Price Movement Post-Breakout:
After breaking above the triangle’s resistance, gold started forming higher highs at an accelerated pace.
Minor pullbacks are bouncing off key support levels, providing re-entry opportunities for traders.
📌 Technical Significance: A breakout followed by sustained higher highs and strong buying pressure is a key bullish signal.
Trading Plan & Strategy
1. Entry Strategy – Ideal Buying Zones
Buy on Pullbacks:
Enter near minor support levels to take advantage of retracements.
This improves the risk-to-reward ratio and reduces exposure to sudden reversals.
Confirmation Signals:
Look for bullish candlestick patterns (bullish engulfing, pin bars, hammer candles).
Increased trading volume on bullish moves supports trend continuation.
2. Stop-Loss & Risk Management
📍 Stop-Loss: $2,661
Placed below the most recent minor support level to protect against downside risk.
If price breaks below this level, it may signal a trend shift or deeper correction.
📍 Why this Stop-Loss Level?
It ensures a tight risk control while allowing room for natural price fluctuations.
3. Take-Profit & Target Projection
📍 Target Price: $3,170
The measured move projection from the triangle breakout suggests a target near $3,170, which aligns with historical resistance.
If the price approaches $3,100-$3,170, traders should monitor for potential reversals or further breakouts.
4. Key Factors Supporting the Bullish Bias
✅ Uptrend Structure: The market is making higher highs and higher lows, which is a textbook sign of bullish momentum.
✅ Breakout Confirmation: The price has broken out of the triangle pattern and is sustaining higher levels.
✅ Support Levels Holding: Each pullback is being absorbed by buyers at well-defined support zones.
✅ Momentum & Volume: Increased volume and strong buying pressure indicate that the bullish trend is likely to continue.
5. Risk Management & Market Conditions
Market Sentiment:
If gold continues to hold above the support zones, further upside momentum is likely.
If price starts breaking below key support levels, it may signal a trend reversal or deeper correction.
Geopolitical & Economic Factors:
Gold prices are often affected by inflation data, interest rate changes, and global uncertainties.
Traders should monitor economic news that could impact gold’s trend.
Conclusion – A High-Probability Trade Setup
This analysis confirms that gold (XAU/USD) is in a strong bullish uptrend following a successful triangle breakout.
🚀 Trade Setup Summary:
✅ Entry: Buy on pullbacks at minor support levels
✅ Stop-Loss: $2,661 (Below support)
✅ Target Price: $3,170 (Next resistance level)
✅ Risk-Reward Ratio: Favorable setup with strong trend confirmation
🔹 Final Verdict: As long as gold remains above the minor support levels, the bullish bias remains strong, making this a high-probability long trade setup.
Would you like to add any additional indicators (RSI, MACD) for confirmation? 📈

Descending triangle + Bullish divergencePrice is stalling. I will wait for a clear breakout to the upside

IOTX/USDT on the Edge Will the Triangle Break ?IOTX/USDT Technical Analysis Symmetrical Triangle Breakdown in Sight
Key Insights
Symmetrical Triangle Pattern: Price has been consolidating within a symmetrical triangle, creating lower highs and higher lows, signaling a potential breakout.
Critical Support Zone: The price is currently testing the lower trendline at $0.0378.
Bearish Scenario: A breakdown below this trendline support will trigger a short opportunity, aligning with the bearish market sentiment.
Target Levels
Primary target: $0.0300
Final target: $0.0250
Monitor closely for a breakdown confirmation. A close below support with increased volume could validate a downward move. Managing stop-losses above $0.0450 upper triangle boundary is recommended to mitigate risk.

symmetrical trianglehi we have a symmetrical triangle that has broken the lower line of triangle and the last pivot of triangle and we hope that the price going down to 0.00001981 or more to 0.000195.

Technical Analysis on Advent Technologies Holdings (ADN)The chart for ADN clearly illustrates its performance: a rapid surge at the end of 2020, followed by a consistent decline from 2021, leading to a 99% drop in value.
After reaching its lows around $1.70, the stock entered a sideways consolidation phase that lasted several months. It then staged a strong recovery with a gap away and a breakout of the descending trendline.
Currently, the stock is in a compression phase, forming a Triangle pattern, with converging highs and lows.
Bullish Scenario
In a bullish scenario, a breakout above the triangle is required, ideally accompanied by an increase in trading volumes.
The Volume Profile indicates the absence of significant resistance levels that could hinder the upward movement.
Bearish Scenario
In a bearish scenario, the stock would need to break below the triangle. However, the Volume Profile highlights a high-volume node represented by the rectangle, which also contains the POC (Point of Control).
Before a sustained decline can occur, the stock would need to breach this strong support zone.

DOGE to ATH ($0.74) - 35% within Hours to Days!Our first altcoin season of this crypto cycle is currently underway and BINANCE:DOGEUSDT is profitting from it. After rising over 200% within days DOGE is at the end of its consolidation period and nearing a potential breakout which could pump the coin to it's all-time high at around $0.74. Based on the ascending triangle setup we should at least get 35% within the next hours to days.
Current support zones:
$0.42
$0.40
I’d love to hear your thoughts and predictions. Where do you see XRP heading in the next hours to days? Let’s discuss below!

Triangle pattern spotted on GoogleTriangle pattern spotted on NASDAQ:GOOG and NASDAQ:GOOGL Google! The stock has been consolidating in a tightening range, forming a triangle pattern. Could break out or reverse. Share your thoughts! #Google #TrianglePattern #StockMarket

Ascending Triangle Pattern Tutorial: 3/8 Bullish PatternsAscending Triangle Pattern Tutorial: 3/8 Bullish Patterns
An ascending triangle is a bullish continuation chart pattern that signals the potential for an upward breakout. Here's how it forms:
Flat Upper Trendline: The upper trendline is flat, indicating a resistance level where the price consistently faces selling pressure and fails to move higher.
Rising Lower Trendline: The lower trendline is ascending, showing higher lows as buyers step in at increasingly higher prices.
Price Convergence: The price action gets squeezed between the two trendlines, leading to a tightening range.
Breakout: Eventually, the price breaks above the resistance level, indicating a continuation of the upward trend. This breakout is typically accompanied by a surge in volume.
Ascending triangles are popular among traders because they offer clear entry and exit points. The height of the triangle, measured from the base to the horizontal resistance, can be used to estimate the potential price target following the breakout.
LIKE l FOLLOW l SHARE

AAPL Apple Inc. Ascending Triangle NASDAQ:AAPL AAPL Apple Inc. Ascending Triangle Look, it looks like it might break to the upside depending on market conditions. Looking at next week's 237.5 calls. Not financial advice could easily see a pull back, AAPL like NVDA loves to close very close to strike prices making options worthless.

XrpUsd - Please trade this triangle!BITSTAMP:XRPUSD is again rejecting the triangle formation - time for a bullish breakout!
Just one month ago, I told you that XrpUsd is preparing a bullish rejection and a triangle breakout followed by an insane bull-market. So far this is playing out exactly as predicted and XrpUsd is outperforming 95% of all other cryptocurrencies. Please just listen to me and take a look at the triangle pattern. If it breaks then we can see a similar rally as we saw back in 2013.
Levels to watch: $1.00
Keep your long term vision,
Philip - BasicTrading

Tesla - Fakeout leading to a -50% drop?NASDAQ:TSLA is currently trading at a key inflection level, forming a trend for the next years.
Within a couple of hours, an entire stock can reverse and fundamentally change its trend. Tesla is still retesting a multi-year resistance trendline and is down about -8% today. If this selloff continues and Tesla rejects the resistance trendline with a massive bearish wick, then we will most likely see a correction back to the lower support of the descending triangle pattern.
Levels to watch: $240, $120
Keep your long term vision,
Philip - BasicTrading

UMANGDAIRYLooks Ready for a Triangle Breakout.
Volume Buildup seen.
Good for Short Term.
Do Like ,Comment , Follow for regular Updates...
Keep Learning ,Keep Earning...
Disclaimer : This is not a Buy or Sell recommendation. I am not SEBI Registered. Please consult your financial advisor before making any investments . This is for Educational purpose only.

Tesla looking bullishTesla seems to have completed its corrective wave (2) and to have started its wave (3) with a short term target in the $235 area.
A break above $235 would validate the exit of the large triangle formation and opens further up moves towards the all time high.
On the opposite side, a break below $160 would invalidate this view.
------
It's recent partnership with Baidu regarding autonomous vehicles and AI data centers, and its increasing focus on the development of its functional humanoid robots (Optimus) seem to be encouraging news among others. I believe Tesla could be one of the most concrete way to play the AI revolution.

Tru bullishTru breaks triangle meaning its bullish. EMA is good too. Volume is Good.
Below the red trendline, Bullish scenario is invalid

TAJGVKMultiple Breakouts.
Consolidation followed by Huge Volumes.
Looks so Good on Chart.
Above all EMA.
Good for Short term.
Do Like ,Comment , Follow for regular Updates...
Keep Learning ,Keep Earning...
Disclaimer : This is not a Buy or Sell recommendation. I am not SEBI Registered. Please consult your financial advisor before making any investments . This is for Educational purpose only.

MAHABANKTriangle pattern Breakout .
Good volumes.
Consolidation done .
Above all Key EMA.
Good for Short term.
Do Like ,Comment , Follow for regular Updates...
Keep Learning ,Keep Earning...
Disclaimer : This is not a Buy or Sell recommendation. I am not SEBI Registered. Please consult your financial advisor before making any investments . This is for Educational purpose only.

EURUSD - LONG TERM FORECAST.. (GREAT SELL OPPORTUNITY) EURUSD Is currently stuck inside a triangle... and has bounced of the 61.8 fibonacci level which indicators a huge reversal to the downside.
This would be a good time to sell EURUSD and take profit to the VERY BOTTOM! Low risk high reward opportunity.

SHIB Analysis: Breakout Confirmation and Potential UpsurgeThis analysis examines the recent breakout of Shiba Inu (SHIB) and assesses its potential for further upward movement.
Previous Analysis Validation:🫶🏻💪🏻
The previous analysis successfully predicted the price reaching the anticipated weekly resistance level.
Breakout Confirmation:📊📈
The recent breakout above the weekly resistance level confirms the bullish trend reversal.
Breakout Confirmation:
The recent breakout above the weekly resistance level confirms the bullish trend reversal.
4-Hour Trendline and Triangle Pattern:✅
A breakout above the current 4-hour trendline is expected to further validate the uptrend.
A successful breakout from the triangle pattern also indicates a continuation of the upward momentum.
RSI and Risk Considerations:⛔
The RSI indicator is not yet in the overbought zone, suggesting that there is room for further growth.
However, the lack of strong momentum warrants a cautious approach to entering new positions.
Conclusion:
The successful breakout of Shiba Inu BINANCE:SHIBUSDT and the bullish technical indicators suggest a potential for further upward movement. However, traders should exercise caution due to the absence of strong momentum.
This analysis is for educational purposes only and should not be construed as financial advice. Always conduct your own research and employ sound risk management practices before trading.

Bitcoin consolidating in a flat bullish triangle pennantIt's clear that with a massive overbought RSI on the daily and the 4h charts, Bitcoin's fate for the following weeks is to cool down and to consolidate, giving room to altcoins to start moving up. Is it the start of an alt season? I think so. Until the consolidation ends and bitcoin starts moving up again.

HALLIBURTON Weekly Technical AnalysisHAL Weekly - No RECOMMENDATION or ADVICE Status / EDUCATIONAL only - Support, Resistance, Confluence, Clusters, Trend Lines , Parallel Chanel, Fibonacci, Gap, Triangle - Hope it Helps, Good Luck
DISCLAIMER - This communication is not trading or investment advice, recommendation or solicitation to buy, sell or hold any investment product is provided for informational, educational and research purposes only. All illustrations, forecasts or hypothetical data are for illustrative purposes only. The author or persons involved in the conception, production and distribution of this material cannot be held responsible for transactions or any financial loss or damages resulting directly or indirectly from the use or application of any concepts or information contained in or derived from this material. Past performance is not indicative of future results. Any person who chooses to use this information as a basis for their trading assumes all the liability and risk for themselves.

News Analytics Align with Technicals' Slight Bearish Momentum ☄️Dear Investors,
Chart Explanation
I believe if Tesla doesn't break out from the bearish triangle, it could downtrend to $225. This is the target price of multiple scenarios. The stock is volatile enough to fall to this price without additional confirmation. However, if the price meets the resistance trendline I marked with red, it can still spiral into the mentioned target zone. The chart shows how this resistance indeed rejected rallies many times over the previous months. I drew red arrows where I believe the resistance rejected the price. If the price breaks up this resistance, bullish scenarios will become more probable and Tesla will prepare for the moon. At the moment, however, the number of bearish scenarios suggests a better risk-reward ratio for shorts with losing the EMAs today. I've got a short myself from $251, and I'd consider increasing this position size if I see another rejection near the resistance. On the other hand, a breakup of the resistance would mean taking profits from these positions and preparing for a long setup. The $225 target aligns with multiple historical gaps that the stock is yet to fulfill. From that level, it can either break down or reverse up. There are possible targets on both sides. So, I think, it's important to monitor news and technicals alike. In this idea, I'd like to give you some news trading insights and how I see the technical indicators.
News Trading - Natural Language Processing
☄️ Tesla's production and delivery growth has slowed in recent quarters. The company's production growth slowed to 54% in the fourth quarter of 2022, from 119% in the third quarter. Deliveries also slowed to 936,000 in the fourth quarter, from 1.39 million in the third quarter. This slowdown could be a sign that Tesla is facing production bottlenecks or supply chain disruptions.
☄️ Tesla's gross margin has declined. The company's gross margin was 27.9% in the fourth quarter of 2022, down from 30.6% in the third quarter. This decline could be a sign that Tesla is facing higher costs or that it is discounting its cars more heavily to boost sales.
☄️ Tesla's stock price has been volatile in recent months. The stock price has fallen by more than 40% from its all-time high in November 2021. This volatility could be a sign that investors are uncertain about Tesla's future.
☄️ There are concerns about Tesla's ability to scale production efficiently. The company has ambitious plans to produce 20 million vehicles per year by 2030, but analysts have questioned whether Tesla can achieve this goal without facing significant production bottlenecks.
☄️ Tesla's competitive landscape is becoming more crowded. The electric vehicle market is becoming increasingly crowded, with new entrants from established automakers and startups alike. This could put pressure on Tesla's market share and pricing power.
Technical Indicators
MACD has been bearish since 29 November as the bottom indicator shows. The bearish momentum isn't too strong, but it's been consistent over the last week. On the RSI, above the MACD indicator, I can see a bullish RSI cross attempt, but this cross failed and became a bearish indication. The volume bars have been somewhat stable over this time, which might not enforce a strong bearish momentum, but it shows a lack of volume necessary for reversal.
Disclaimer
It's not an investment advice. Do your research. Your funds are your responsibility. This speculation serves only entertainment purposes.
Kind regards,
Ely
