#XMR Triangle Is Almost Complete — The Final Flush Could Be Brut
Yello Paradiser! Are you watching closely, or are you going to be late again to one of the cleanest wave-based setups on #XMR? We may be approaching the final stages of a larger corrective cycle, but the trap is being set — and only those with patience and discipline will be ready when the real move begins.
💎#Monero has been unfolding in a textbook five-wave decline from its major high near $800, and right now, we are deep in wave 4 of an extended wave 5 — a critical stage where most traders either overcommit too early or get completely shaken out before the actual reversal. The current structure is forming a contracting triangle, which is a classic characteristic of wave 4. These patterns are notorious for building tension and compressing volatility before a sharp final move in the direction of the prevailing trend.
💎The price action is also perfectly respecting a well-defined descending channel, reinforcing the idea that the broader bearish structure remains intact. This channel, along with the triangular consolidation, suggests that there’s one final flush to come — the terminal wave 5 of the extended fifth — which could complete the entire corrective cycle from the macro top.
💎Our projected completion zone for this entire move lies in the $400–$420 region. This area isn’t just a psychological round number zone; it also represents the convergence of structural channel support and historically reactive levels from earlier phases of the trend. This makes it a high-probability demand zone, where we expect long-term buyers to step in, especially if broader market sentiment hits capitulation.
💎It’s important to highlight that the invalidation level for the current count is sitting around the $600 mark. A sustained move above that level would negate the triangle and invalidate the current interpretation of this being a final wave 4–5 sequence. Until then, however, the structure remains technically valid and offers a clear road map.
💎As with all wave 4 triangles, we must remain extremely cautious. These patterns are designed to frustrate both sides of the market, producing multiple fake breakouts and whipsaws. Acting prematurely — especially in a late-stage wave structure — can be extremely dangerous, and most traders lose capital here not because they’re wrong, but because they’re impatient.
💎If the final wave 5 unfolds as expected, we’ll likely see sharp liquidation and emotional selling that clears out weak hands. That would align with the psychology of a terminal move — marked by panic, exhaustion, and climax volume. It’s at that moment, when everyone gives up, that we’ll begin hunting for the reversal confirmation.
💎A big liquidation event, which will first take both longs and shorts and fully get rid of all inexperienced traders before the real move happens, is very close to happening again, so make sure you are playing it safe, Paradisers. It will be a huge money-maker for some and a total disaster again for the majority.
Stay focused Paradisers , follow the structure, and avoid emotional decisions. As always — timing and disciplined execution will separate those who succeed from those who just watch the market move without them.
MyCryptoParadise
iFeel the success🌴
Trianglepattren

Silver in a Triangle patternDespite the Over-bought territory and the CME raising margin requirements to suppress over leveraged buying, the high demand for physical silver and Gold is ripping the precious metals authority apart in the physical markets, and with the Shanghai silver prices soaring well above $20/oz than the west and signaling arbitrage. Silver could potentially break out of this triangle pattern considering yesterday's violent move upwards and other major factors. This looks to be another bullish signal/pattern I see potentially playing out and the potential target price for silver is roughly $135-$137/oz. This is not financial advice, just a potential pattern I see playing out.

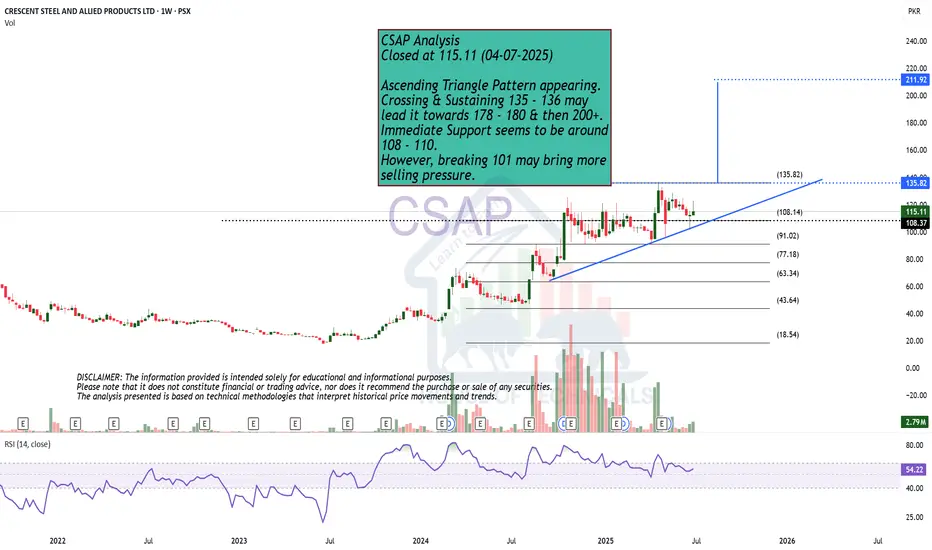
Ascending Triangle Pattern appearing.CSAP Analysis
Closed at 115.11 (04-07-2025)
Ascending Triangle Pattern appearing.
Crossing & Sustaining 135 - 136 may
lead it towards 178 - 180 & then 200+.
Immediate Support seems to be around
108 - 110.
However, breaking 101 may bring more
selling pressure.
BTC 1H Descending Range - Bottom Isometric Triangle ResolutionSince its failed breakout at 98k, BTC entered a descending range, quickly dropping under 89k to reach ~87k, to form an isometric triangle. A light ascending support is formed since the bottom, and the resolution direction depends on where it breaks.
Breaks descending line - momentum regained at least for a few hours and try reach target 1.
Breaks ascending line - momentum lost and target around 87k.
I'm in no way advising anything - just sharing my thoughts and observations.

CHFJPY revers here expected
OANDA:CHFJPY long time bullish we having, this point taking for revers point. We have long zone and on zone we having TRIANGL pattern.
SUP zone: 198.100
RES zone: 195.600, 194.800

Ascending Triangle appearing.FLYNG Analysis
Closed at 57.07 (06-01-2026)
Ascending Triangle appearing.
Crossing & Sustaining 62 - 63 with Good Volumes
may lead it towards 84 & then around 95 - 97.
Very Good Support seems to be around 50 - 52.
However, 43 should be the last hope. If this level
breaks, we may witness trend reversal.

BankNifty to reverse direction?With the triangle unfolding in wave 4, we may see a correction on the downside after a small 5th wave.

1 hour view (xrp) short-term SHORTHello 🙋♀️🙋♂️👽👻🐮🌍
just a quick idea and possible short available here. price could go much lower because we are in a descending triangle on daily time frame view.
⏬⏬
For now I have my eyes on 💲1.8 as a possible short term target.
This is just an idea, please trade at your own risk
🐶This is a Short term short Idea. The cryptocurrency market is extremely volatile💣
This is not financial advice
🐶
Always have a stop loss ✋🛑💲 set🆗
Any thoughts 💭💡, questions 🙋♀️🙋♂️❓, good 👍, bad👎, happy 😄 or sad 😥, in the comments always welcome.😄
Jazerbay ☯️

Coforge Showing Bullish Setup Near Strong Support Zone Coforge – Daily Timeframe Technical View
The stock is trading within a well-defined parallel channel on the daily timeframe.
Within this channel, an Ascending Triangle pattern is forming, indicating accumulation and potential upside momentum.
Immediate Support Zone: ₹1,530–₹1,550
Long-Term Channel Support: ₹1,200–₹1,300
If the stock respects the pattern support, a breakout is possible, which could open the door for an upside move toward ₹2,850–₹2,900.
Alternatively, if the stock holds the channel support, it is likely to continue moving within the channel, maintaining the prevailing trend.
Thank You!!

XAUUSD | Another One....Hello traders,
No technical analysis needed here. It is just "another one".
Good Luck!
All our analysis is shared with honesty, care, and real effort. If you find value in it, a like or comment means a lot to show your support🙏📊

Oberoi Realty | Consolidation Within Symmetrical TriangleThis is the daily timeframe chart of Oberoi Realty.
The stock is trading near a strong support zone placed around ₹1550–1600, which has been acting as a key demand area.
The stock is currently trading within a symmetrical triangle formation.
The immediate resistance zone is placed near ₹1780–1800.
A decisive breakout above this level may open the path for the next resistance zone around ₹2000–2030.
if this support zone sustain then we may see higher prices in Oberoi Realty.
thank you ...

Be careful with LINK !!!The price on the 4h timeframe is within an ascending triangle, which can be promising. If the price breaks this pattern with bullish candles, it could easily rise by the distance of AB=CD.

XAUUSD Bullish Continuation SetupXAUUSD – H1 Timeframe Bullish Analysis
Overall Trend
XAUUSD is respecting a bullish trendline, which confirms that the market is still in an uptrend.
Price is forming higher lows, indicating that buyers are in control of the market.
As long as the bullish trendline holds, the market bias remains bullish.
Demand Zone
The confluence of the demand zone and the bullish trendline strengthens the probability of upward continuation.
Buyers are likely to defend this zone.
Triangle Pattern
Price is forming a symmetrical / ascending triangle.
This pattern usually acts as a continuation pattern in an uptrend.
Price compression inside the triangle indicates that a strong breakout is likely.
Breakout Expectation
A clean H1 candle close above the triangle resistance will confirm a bullish breakout.
After the breakout, price is expected to move toward the next all-time high (ATH) at 4420.
MACD Indicator
MACD is showing bullish momentum stabilization.
The contraction of the histogram suggests that momentum is building and an expansion may follow soon.
A bullish MACD crossover or expansion above the zero line will further support the upside move.
Trade Plan (Bullish)
Buy Entry: now 4327 or after the triangle breakout.
Stop Loss: 4305
Take Profit:
TP1: Previous high 4355
TP2: Next resistance 4390
Final Target: ATH 4420
Disclaimer
This chart is for educational purposes only and does not constitute financial advice. Trading involves high risk; always conduct your own research and use proper risk management.

RELIANCE Unleashed | Bulls Roaring StrongThis is the daily timeframe chart of Reliance.
Reliance is moving in a strong momentum phase and is consistently respecting the Supertrend indicator.
Based on Supertrend, the key support level is at 1518.
Currently, the stock is trading above multi-timeframe pivot levels, indicating short-term momentum strength.
Buying opportunities may be considered near the 1530–1540 range.
The stock has a strong support zone around 1515–1520.
Potential upside target is near 1620.
If the support zone sustains, we may see higher prices in Reliance in the coming sessions.
Thank you.

GOLD Elliott Wave – Bullish Scenario: Wave (4) TriangleThe bullish Elliott Wave scenario shows a Wave (4) contracting triangle with the E-wave expected to complete near 0.382 Fibonacci (4,163.828). Once this corrective structure completes without breaking decisively lower, a wave (5) extension rally is projected toward 4,250–4,400.
Structure:
Wave (3): Completed
Wave (4) triangle: A–B–C–D–E in progress
Wave (E) target: 0.382 Fib: 4,163.828/0.618 support (4,101.573)
Wave (5) upside: 4,250–4,400 if (4) holds
Key levels:
0.382 Fib: 4,163.828
0.5 Fib: 4,132.700
0.618 Fib: 4,101.573
Decision point: How price reacts at fib levels. Rejection with bullish momentum = wave (5) likely. Break below = bearish scenario takes priority.

GBP/CAD: Bear Trap & Bullish ConfirmationThe GBPCAD pair formed a liquidity grab following a test of significant intraday/daily support.
The presence of an ascending triangle pattern and a violation of its neckline offer strong bullish confirmation.
I anticipate an upward movement, at least to 1.8511.

I think the only one Liking my post is me!The price on the 4h timeframe is within an ascending triangle, which can be promising. If the price breaks this pattern with bullish candles, it could easily rise by the distance of AB=CD.
#BCHUSDT — Weekly OutlookBCH has officially broken out of its multi-month descending trendline, and more importantly, we now have a clean confirmation:
a retest of the trendline followed by a strong bullish weekly candle closing back above it.
This is exactly the kind of structure you want to see after a breakout.
🔹 Key Points
✅ Breakout + Confirmation (trendline broken and retested)
✅ Holding above the 50% Fib ($453)
✅ Strong weekly momentum building
✅ Market structure shifting from compression → expansion
As long as BCH keeps closing above the $520–$540 zone, the bullish continuation scenario remains valid.
🔹 Targets
🎯 $680–$720 (first major liquidity pocket)
🎯 $900–$920 (macro resistance + ~78.6% Fib)
🔹 Invalidation
A weekly close back under $499 would weaken the structure and re-open the lower range.

Gold breakout incoming? Triangle in focus as Fed cut bets rise!Gold has snapped back above the $4.1k handle and is coiling in a triangle just under resistance as markets go almost all‑in on a December Fed rate cut.
In this video, we look at how dovish shifts from Fed officials and surging rate‑cut odds are lifting gold while price action compresses between the 4k support and the 4,240–4,245 resistance band. We then map out both bullish and bearish scenarios using the 4,100 handle as the key line in the sand.
Key drivers
Markets now price roughly 80% odds of a December Fed cut after comments from Christopher Waller and Mary Daly backing a move on the basis of a weakening labour market.
Lower expected policy rates and a softer dollar reduce the opportunity cost of holding gold, helping XAUUSD hold above 4,100 even as risk appetite improves elsewhere.
On the 1‑hour chart, gold is locked in a contracting triangle/pennant with higher lows and lower highs, overbought RSI cooling off, and 4,100 acting as potential support.
A sustained break above roughly 4,175–4,200 opens the door towards 4,240–4,275, while a failure and loss of 4,100 puts 4,000 back in play and risks a deeper extension towards the 3,750 zone.
If you’re trading gold, share your triangle scenarios in the comments. Are you buying a 4,100 hold or fading a failed breakout? Make sure to follow for more macro‑plus‑technicals trade setups.
This content is not directed to residents of the EU or UK. Any opinions, news, research, analyses, prices or other information contained on this website is provided as general market commentary and does not constitute investment advice. ThinkMarkets will not accept liability for any loss or damage including, without limitation, to any loss of profit which may arise directly or indirectly from use of or reliance on such information.

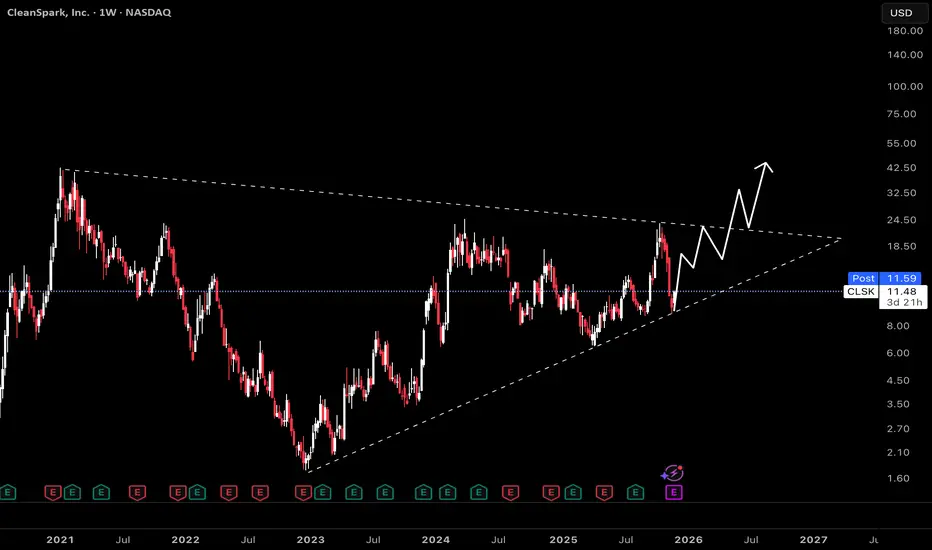
CleanSpark (CLSK): Approaching Triangle BreakoutThis weekly chart tracks CleanSpark, revealing an extended symmetrical triangle formation that has dictated price action since mid-2021. Symmetrical triangles often signal a period of compression in volatility, building up for a breakout as price coils between support and resistance trendlines.
Triangles like this signal indecision, as neither bulls nor bears have established control. The energy stored within the pattern typically results in a significant move once a breakout occurs.
Given the recent bounce off ascending support and renewed momentum, the most plausible scenario is a bullish breakout.
For a short-term opportunity, the upper resistance of the triangle offers a plausible setup for a countertrend trade. If price rallies toward the triangle's descending resistance and stalls, a short position could be initiated with tight risk management. The idea is to sell CLSK at resistance, anticipating that price may be rejected and revert lower within the triangle until a confirmed breakout occurs.
BTCUSD Monthly – Elliott Wave Count
Possible we will get a Wave ((IV)) triangle, if structure holds above $65,000 support.
Higher timeframe bias remains bullish.
Key zones: $122,154 (1.618 ext.), $188,111 (2.618 ext.)
Invalidation: Monthly close below $65,000
Roadmap:
Triangle consolidation likely through 2026
Breakout targets $120K-$190K
Impulse confirmation triggers next advance

MARICO Under Pressure — Sharp Fall on the Charts!This is the daily timeframe chart of MARICO.
MARICO is trading within a well-defined parallel channel and is currently falling from the upper resistance zone. This sharp decline may pause near the channel support.
The stock continues to respect the structure, with a key support zone around 700–710 and resistance in the 775–785 region.
If the current weakness extends, we may see a further drop toward the support area, followed by a potential bounce from those levels.
Thank you!!

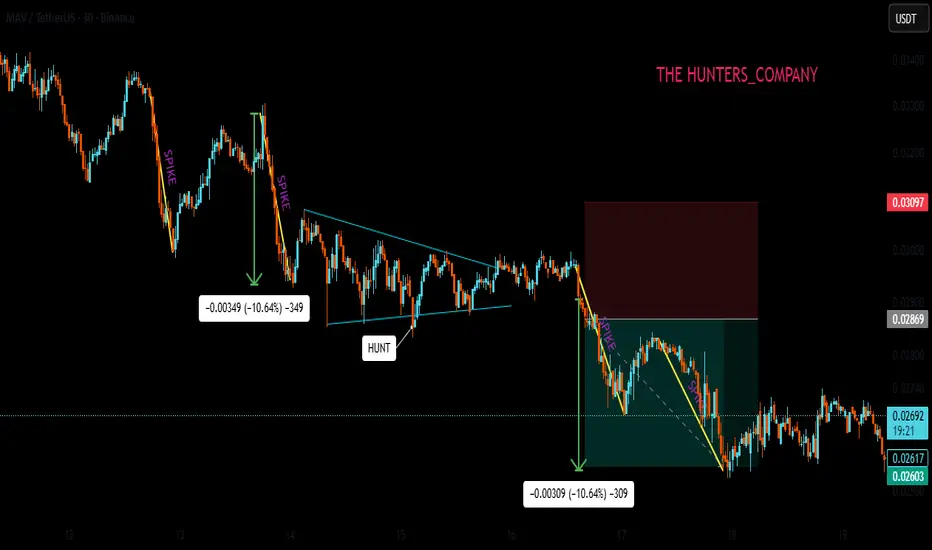
Continuing Triangle PatternHello friends
we are here with a simple strategy tutorial that is a model, but it also requires practice.
Well, whenever we have a structure, whether it is bullish or bearish, it doesn't matter. Now in this example, our structure is bearish and you can see how sharp the spikes that the sellers make are and at one point the price compresses and forms a triangle. Here, considering the bearish structure we have and the strength of the sellers that you see, we expect a decline if the triangle breaks.
Which is the continuation of our downward trend or structure, which we call a continuation triangle, meaning the price continues its previous structure.
The way to trade it is also simple. Just wait for a strong break of the triangle, and when the break is valid and the bottom of the triangle closes, we can enter with a stop loss above the ceiling and a target equal to the previous drop of the triangle, which is the trend move.
Be sure to follow risk and capital management.
*Trade safely with us*