Trias Token (New, after rebranding) Secondary trend. 10 2025Logarithm. 1-week time frame for trend visibility. Relevant for those trading on DEX exchanges, particularly Uniswap or PancakeSwap. A fractal structure is evident when compared to the entire chart history for this project, before and after the swap (find it yourself and compare).
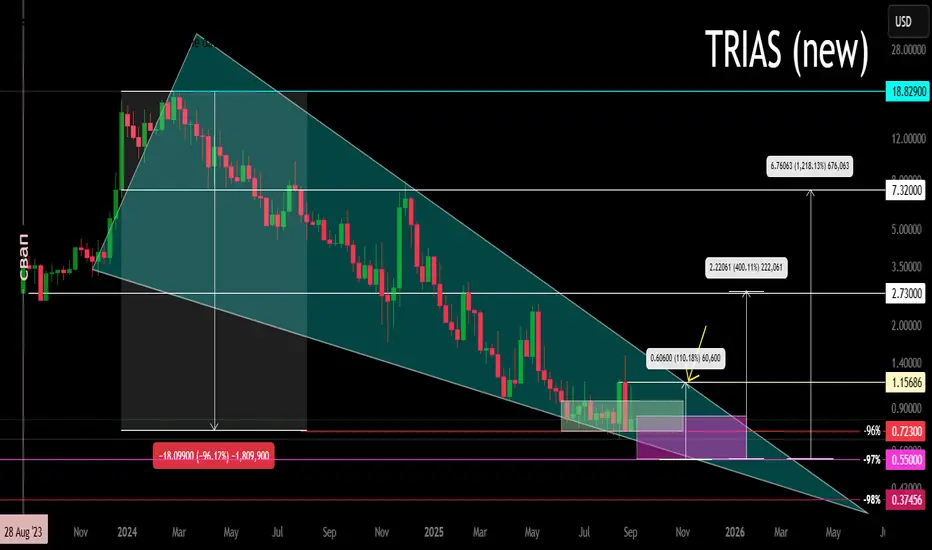
For the new coin after the swap (the chart I provided here), a descending wedge is forming in the secondary trend (the entire history after the coin swap), and a sideways price movement with reduced volatility has begun. In other words, this is a hypothetical accumulation zone. For money management and risk control, I also showed where the price could theoretically fall (optional). Percentages are provided for clarity, from key support and resistance zones to the main areas of previous consolidation.
A breakout of the wedge (its resistance) — the potential for a sideways move with a wider range, or a transition to the participation phase, where all of the percentages shown (up to 7.32, no higher, and above that, you shouldn't care) are highly likely to be reached (the general market hype and the altseason, which no one believes in anymore, but it's inevitable).
The basis for trading such low-liquidity assets is risk control and diversification of similar assets.
1️⃣ For example, from your total deposit, you allocate 5-10% of your funds to trading such high-risk (low liquidity and lack of top centralized exchanges), but potentially highly volatile, due to low capitalization and liquidity, assets.
2️⃣ Select similar assets for trading - observe 20-50. Observe and study what seems most interesting and promising to you.
The most important things to observe are:
➖ This is the potential future traffic of "dumb money." How much new users are pumping Twitter, Telegram, and other social networks. The size of the crypto community. This is essentially the most important thing. How will these people be steered toward buying low-liquidity cryptocurrency during the alt season, which means a large pump.
➖ Buying volume from time to time during consolidations in the lower price zones.
➖ Declines from the high and the market phase and the corresponding phase of the cycle the coin is in. There are high zones and low zones. You should only be interested in the low zones. Anything that has been pumped up should not interest you.
➖ The project's legend , its imitation, and its support in the community. The project creators' activity.
➖ Chart logic and the overall market phase directly influence the altcoin's price. This is key, but people often forget it. A patient and consistent person will be rewarded; a restless person will not.
3️⃣ Of these coins to watch, you select 10-20 to trade and work with them, distributing your funds among key zones. Don't buy with all your allocated funds, but distribute them among key zones and trading situations (breakouts, declines). This is the key difference between a trader and a mere hamster.
Control your risks and stick to your trading plan. Don't get caught up in market and news noise, which shapes opinions and the illogical actions of the majority, which are doomed to lose in the future.
Triasusd
TRIASUSDT trading above weekly resistanceThe price bounced from weekly support WS1 and now trading above the weekly resistance WR1. If this trades above this resistance for a while then it is likely that it will head towards weekly resistance WR2.

TRIAS to $125 TRIAS a layer 1 juggernaut with a lot of hypre behind it could go to $125 next bullrun.

$TriasFor me personally I am holding onto ALL of my #trias until 3 digits minimum, but if I were to sell based on the chart here is my Take Profit Targets and my Stop loss.
TP - $25.68
TP - $32.00
TP - $50.22
TP - $79.70
TP - $109.19
TP - $127.41
SL - $17.00

$Trias chart looking strong!Trias has strong support at the 0.5 fib level around $17.25. it also has a lot of resistance at the 0.618 fib level at $20.73. If we close above the 0.618 level on daily we’re heading up to the 0.786 fib level or $25.68 which is my next target. Close above there and we’re off to ATH , then price discovery!

$TRIAS will moon this cycle...$TRIAS has so much bullish potential that no one even realizes it...
- It only has 5M circ. supply and max. supply of 10M
- Team standing behind #Trias is insanely smart and able
- Trias owns many patterns (~90)
- They have been around for 14yrs
- Tech they offer is insane...
$TRIAS with market cap of:
BAT = $197
COMP = $384
NEO = $564
EGLD = $1000
my price prediction in between $300 and $1000, but it all depends whether we get new listings or not

$Trias the most bullish chart on #kucoin$Trias broke the big $11 resistance i've been watching and then formed a bullflag which it has now broke out of that bullflag! I am super bullish on this coin and wouldnt be surprised if it hits ATH by the end of the month.

$Trias needs to flip this tough $11 resistance spot, thBreak this $11 resistance and then the fun begins! Next targets will be around $16

$Trias - $Usdt Chart Long PositionIts pretty clear to me that if we flip the $10 resistance to support, then the sky is the limit. 3 digits by EOY very likely!
