BTC Rotations Aren’t What They Used to Be — Trojan Cycle This chart uses the Trojan Cycle: Dip & Profit Hunter tool to evaluate recent BTC price action in relation to structural flow dynamics — specifically price and volume behavior through a statistical lens.
The tool is part of a broader effort to monitor the evolving nature of capital rotation in crypto — one that considers how institutional infrastructure, regulatory filters, and synthetic signals may be altering traditional cycle behavior.
🧠 What This Tool Is Designed to Do
Rather than issuing classic buy/sell signals, the tool evaluates where we are in the broader capital flow rotation by analyzing:
Z-Scores of price and volume (how far each has deviated from their historical norm)
Percentile ranks (where current values fall relative to past distributions)
Price vs. Volume momentum divergence
A contextual output based on combinations of these metrics
The aim is to offer a clearer view into whether a move is structurally supported or potentially hollow .
🔍 Live Signal Example (as shown on chart)
Metric Value
Z-Score (Price) +0.65 (mild extension)
Z-Score (Volume) -1.27 (subdued flow)
Percentile (Price) 64%
Percentile (Volume) 2% (extremely low)
Combined Context 📉 Price leading — flow lagging, be cautious
Structural Signal 🟣 No high-probability setup
🗣 Interpretation (not prediction):
While BTC has advanced in price, this configuration suggests a lack of supporting volume — at least from the perspective of the current model. In the context of a maturing, compliance-filtered market structure, these kinds of setups may align with the idea of synthetic rotations: price expansion without true structural inflow.
📘 Why This Matters
The goal isn’t to call tops or bottoms — it’s to better understand the character of a move .
This tool helps frame whether a move may represent:
📥 Accumulation
🔴 Distribution
🚨 Euphoric extension
🧨 Synthetic narrative trap
…or simply neutral structure , as in the current case.
🔎 Interested in the Thesis Behind This?
This tool is part of a broader analytical framework outlined in the Trojan Cycle and Synthetic Rotation theses.
To explore those ideas further, including full macro breakdowns and structural flow models, please visit the published charts for RWCS_LTD on TradingView.
📊 How I Use This Personally
I avoid adding risk when signals show price is leading while volume lags.
I scale in during “confluent buy” or “value + flow” setups.
I pair this with BTC.D, ETH/BTC, and TOTALES3/ETH to track relative strength and phase rotation.
💭 Final Thought
Whether this tool confirms your existing thesis — or challenges it — the intent is to help develop structure-informed judgment in a rapidly evolving market.
Trojancycle

Recent Dip & What It Means for the Trojan Cycle: Fact Check1. Stablecoin Capital Flow — Not a Typical Sell-Off
On August 14–15 , Binance saw $1.82 billion in net stablecoin inflows, one of the highest recent figures.
Simultaneously, Tether and Circle minted a combined $9.5 billion in stablecoins over the past 30 days , signaling significant on-ramp activity.
These patterns contradict what we'd expect in a pure capitulation. Instead, they suggest capital is being positioned to buy into dips , not exit markets—hallmarks of the positioning-reset phase in the Trojan Cycle.
2. Institutional Accumulation Aligns with Thesis
Spot Ether ETFs just recorded over $1 billion in net inflows in one day (led by BlackRock’s ETHA and Fidelity’s FETH), bringing total ETF inflows to $10.8 billion.
Two whales accumulated $150 million in ETH , reinforcing institutional interest at these levels.
This indicates institutional players are using the dip as an opportunity to accumulate—consistent with the Trojan framework's “Trojan vehicles” mechanics.
3. Market Structural Trends Support Rotation Setup
Ethereum price dipped ~3% , suggesting short-term weakness but providing a potential entry zone.
Network activity remains robust: ETH daily on-chain transactions recently neared all-time highs at ~1.87 million , driven primarily by stablecoin transfers .
Strong on-chain activity alongside stablecoin flow indicates capital preparation for a rotation phase, rather than a breakdown.
Trojan Cycle Thesis — Data Review
Aspect --> What Trojan Cycle Predicts --> What Data Shows
Stablecoin Inflows --> Increases ahead of rotation --> Binance saw $1.82B in inflows; $9.5B minted overall
Institutional Buying --> Accumulation during dips --> $1B+ ETF inflows; $150M ETH whales buying
Network Activity --> Pre-rotation buildup --> High ETH txn volume, stablecoin activity peaking
Conclusion: All three key indicators align with the Trojan Cycle model. This dip appears to be a positioning flush, not the start of a structural downturn.
The Trojan Cycle: A New Framework for Altseasons & Liquidity🧭 A Thesis for a New Crypto Cycle
This post proposes a new lens for understanding crypto’s macro structure in the institutional era—rooted in two frameworks: The Trojan Cycle and Synthetic Rotation .
It challenges the legacy “ M2 = liquidity, BTC = lead, alts = profit ” model, proposing a more engineered and asymmetric structure shaped by capital rails, narrative timing, and retail dynamics.
📖 Key Concepts
🔹 Trojan Cycle
A macro capital flow model where:
• BTC still triggers narrative momentum—but no longer drives liquidity alone
• Institutional capital enters via regulated wrappers like ETFs and through equities with crypto treasuries (e.g., MSTR, miners, COIN)
• Stablecoins replace M2 as real-time liquidity proxies
• Retail unknowingly front-runs these flows
🛠 Trojan access isn’t just through ETFs—it includes public stocks holding crypto on balance sheets. These Trojan equities serve as indirect exposure rails that institutions use stealthily.
🔹 Synthetic Rotation
Altseasons today are not spontaneous BTC profit spillovers. They are:
• Platform-driven
• Narrative-coordinated
• Liquidity-engineered
• Retail-targeted—by design, not coincidence
🛠 Media, influencers, and platform incentives synchronize narrative deployment to align with capital rotation windows, driving retail engagement at peak distribution phases.
🔹 ETH as a Structural Fulcrum
Ethereum isn’t just a top asset—it’s the bridge:
• Serves as a midpoint for capital between BTC and high-beta alts
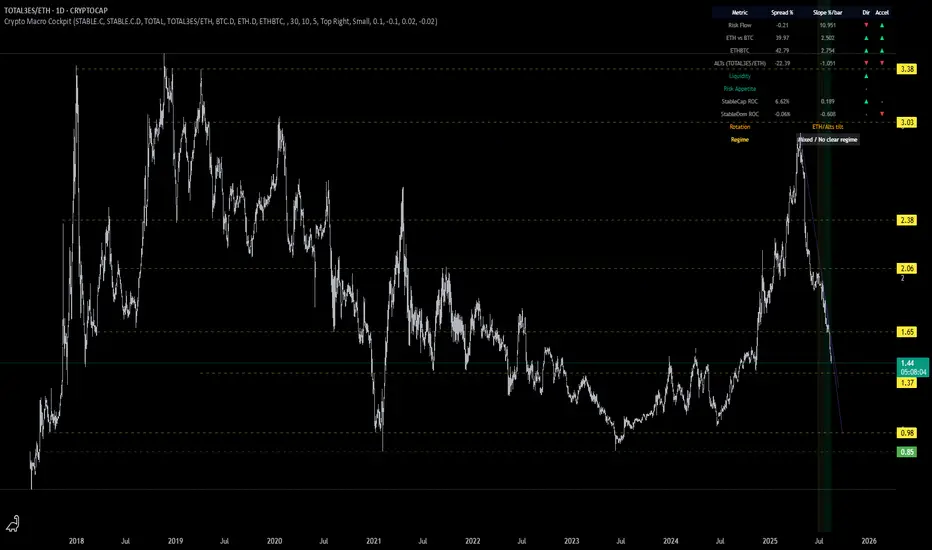
• TOTAL3ES/ETH ratio reveals directional bias in rotation structure
🛠 ETH is a liquidity buffer and rotational fulcrum—not just a layer-1 narrative asset.
🔹 Structural Liquidity Fragmentation
Institutional and retail flows now move on different rails, timelines, and tools:
• Retail is incentivized through volatility and engagement
• Institutions scale in/out passively, through wrappers and proxies
🛠 These cycles don’t just desync by chance—they’re structurally misaligned. This is why retail often exits late and enters at narrative highs.
📊 Visual Framework
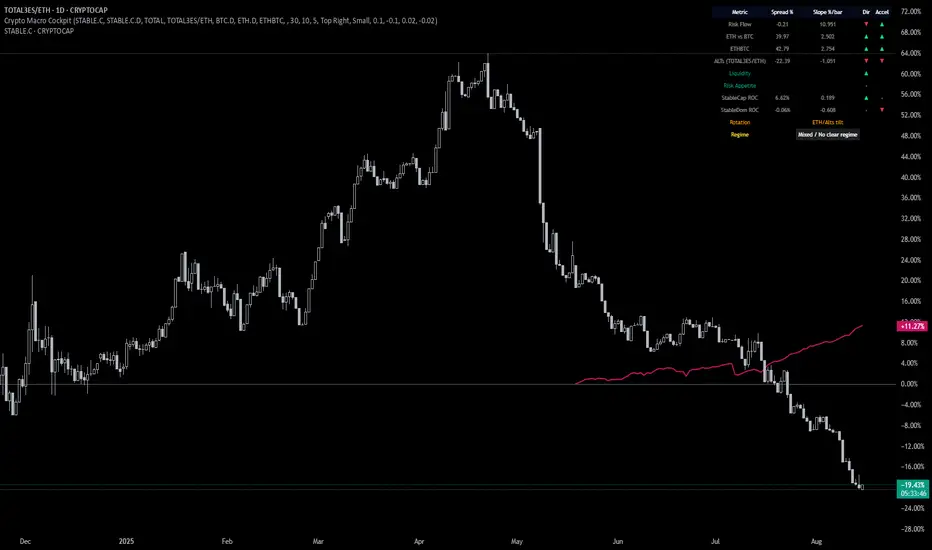
Using the Crypto Macro Cockpit script:
• Spread and slope = flow direction and acceleration
• Stablecoin cap = capital injection
• Stablecoin dominance = risk appetite
• TOTAL3ES/ETH = alt rotation pressure
• Composite regime classification = macro posture (Risk-ON/OFF, Caution, Waiting)
📎 Why It Matters
Understanding engineered cycles vs organic flows is key to staying ahead.
Legacy cycle models no longer apply.
New frameworks are needed to decode capital movement, timing asymmetries, and narrative deployment.
💬 This isn’t a prediction—it’s a proposed mental model for discussion.
Would love to hear your thoughts—how are you navigating the new cycle?