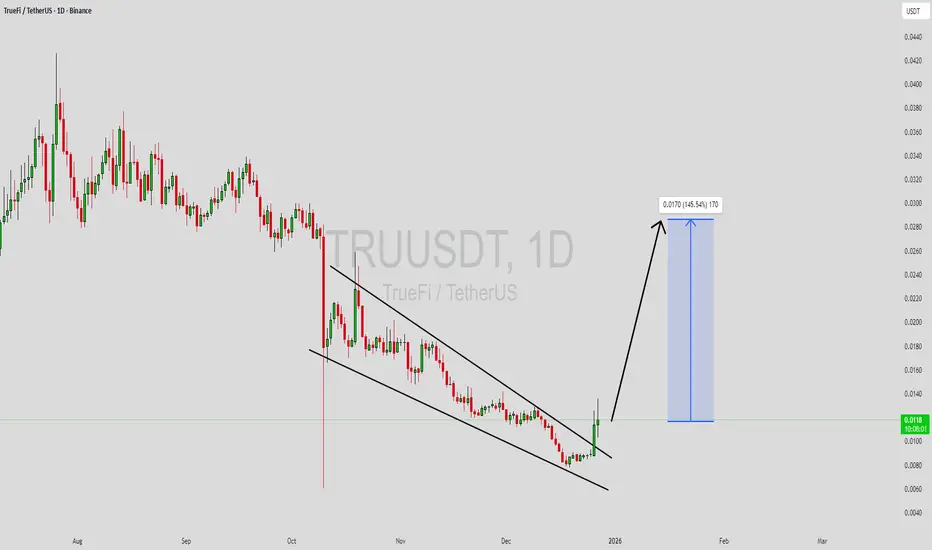
TRUUSDT Forming Falling WedgeTRUUSDT is forming a clear falling wedge pattern, a classic bullish reversal signal that often indicates an upcoming breakout. The price has been consolidating within a narrowing range, suggesting that selling pressure is weakening while buyers are beginning to regain control. With consistent volume confirming accumulation at lower levels, the setup hints at a potential bullish breakout soon. The projected move could lead to an impressive gain of around 90% to 100% once the price breaks above the wedge resistance.
This falling wedge pattern is typically seen at the end of downtrends or corrective phases, and it represents a potential shift in market sentiment from bearish to bullish. Traders closely watching TRUUSDT are noting the strengthening momentum as it nears a breakout zone. The good trading volume adds confidence to this pattern, showing that market participants are positioning early in anticipation of a reversal.
Investors’ growing interest in TRUUSDT reflects rising confidence in the project’s long-term fundamentals and current technical strength. If the breakout confirms with sustained volume, this could mark the start of a fresh bullish leg. Traders might find this a valuable setup for medium-term gains, especially as the wedge pattern completes and buying momentum accelerates.
✅ Show your support by hitting the like button and
✅ Leaving a comment below! (What is your opinion about this Coin?)
Your feedback and engagement keep me inspired to share more insightful market analysis with you!
TRU
TRU Retesting Broken Falling Wedge SupportTRU previously formed a falling wedge during a prolonged bearish phase. That structure has now resolved to the downside, with price breaking below the wedge support and accepting lower levels.
After the breakdown, price is currently retesting the former wedge support, which has now flipped into resistance. This retest is a critical decision zone, as failed reclaim attempts often confirm bearish continuation.
If TrueFi fails to reclaim and hold above the broken wedge trendline, downside continuation remains the dominant scenario. In that case, price may rotate lower toward the next demand zone below current levels.
For any bullish recovery, price must reclaim the broken wedge support and show acceptance above it. Without that reclaim, the broader structure remains bearish and any bounce should be treated as corrective.
This setup is driven by falling wedge breakdown dynamics, resistance flip behavior, and post-structure retest mechanics. Confirmation at this level will define the next directional move.

#TRU/USDT Forming Falling Wedge ? #TRU
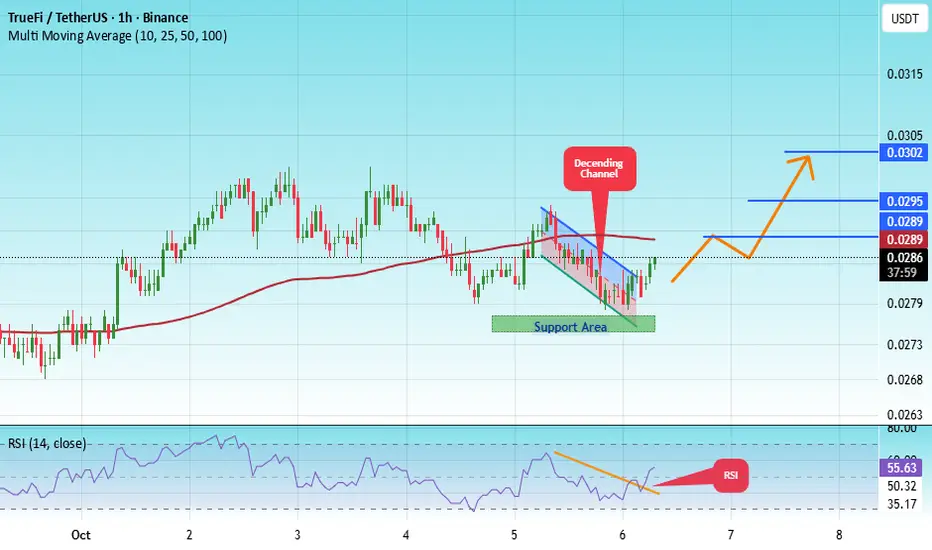
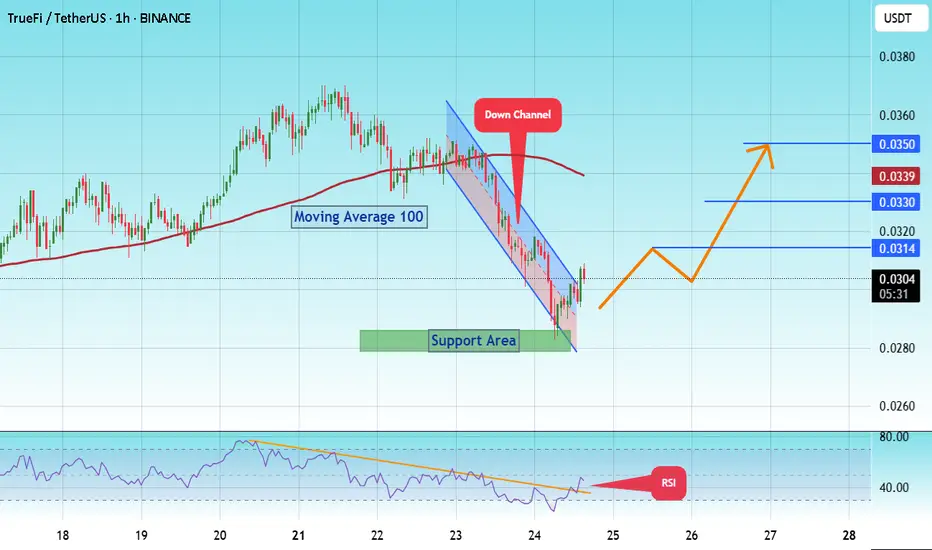
The price is moving within a descending channel on the 1-hour frame, adhering well to it, and is heading for a strong breakout and retest.
We have a bearish trend on the RSI indicator that is about to be broken and retested, which supports the upward breakout.
There is a major support area in green at 0.0276, representing a strong support point.
We are heading for consolidation above the 100 moving average.
Entry price: 0.0285
First target: 0.0290
Second target: 0.0295
Third target: 0.0302
Don't forget a simple matter: capital management.
When you reach the first target, save some money and then change your stop-loss order to an entry order.
For inquiries, please leave a comment.
Thank you.
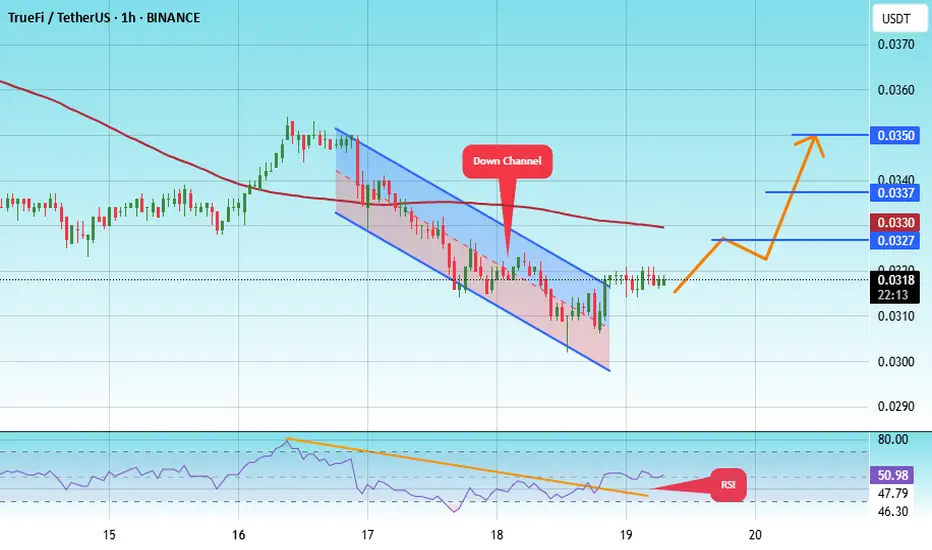
#TRU/USDT Forming Falling Wedge ? #TRU
The price is moving within an ascending channel on the 1-hour frame, adhering well to it, and is on track to break it strongly upwards and retest it.
We have support from the lower boundary of the ascending channel, at 0.0295.
We have a downtrend on the RSI indicator that is about to break and retest, supporting the upside.
There is a major support area (in green) at 0.0298, which represents a strong basis for the upside.
Don't forget a simple thing: ease and capital.
When you reach the first target, save some money and then change your stop-loss order to an entry order.
For inquiries, please leave a comment.
We have a trend to hold above the 100 Moving Average.
Entry price: 0.0314.
First target: 0.0321.
Second target: 0.0332.
Third target: 0.0345.
Don't forget a simple thing: ease and capital.
When you reach your first target, save some money and then change your stop-loss order to an entry order.
For inquiries, please leave a comment.
Thank you.
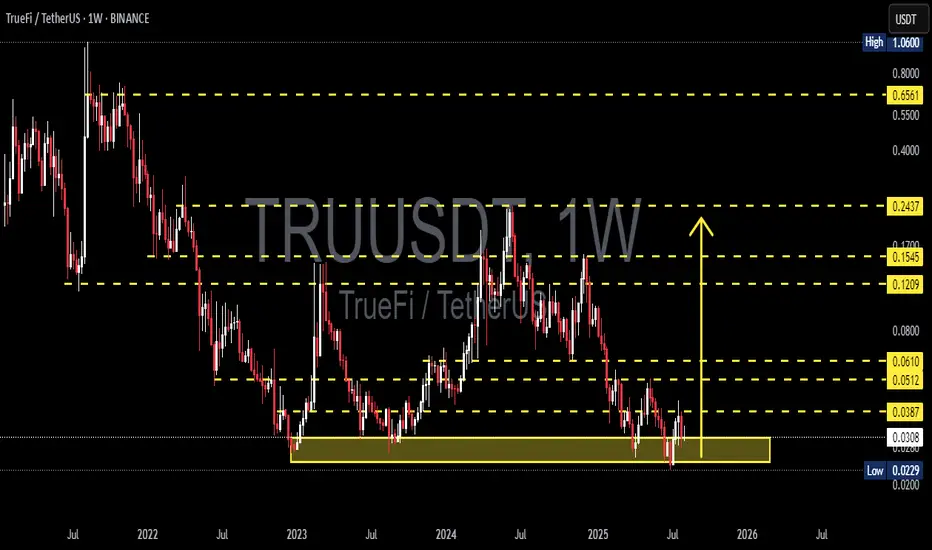
TRU/USDT Weekly – On the Verge of a Reversal or Breakdown?📌 Overview:
TRU/USDT is currently trading within a key long-term demand zone between $0.0229–$0.0307 — an area that has consistently acted as a strong bounce level since early 2023. Now that this zone is being tested again, the outcome could define the next major move for TrueFi.
---
🔍 Market Structure & Pattern:
The pair has been moving sideways in a year-long accumulation range, hinting at a potential accumulation phase by smart money.
There's a possibility of a triple bottom formation, a classic reversal signal, should price break above resistance with momentum.
Although the overall trend remains bearish, selling pressure is weakening, suggesting a possible trend transition phase.
---
📈 Bullish Scenario (Reversal Potential):
If price holds the support zone and confirms a bullish weekly candle:
Upside Targets:
🔹 $0.0387 (First breakout level)
🔹 $0.0512 – $0.0610 (Previous distribution range)
🔹 $0.1209 – $0.1545 (Mid-term trend shift target)
Potential catalysts: strong breakout volume, improving market sentiment, and weakening BTC dominance.
---
📉 Bearish Scenario (Breakdown Risk):
If price fails to hold above $0.0229 and closes below on the weekly chart:
Price could fall further toward the psychological level around $0.0200 or even lower.
This would confirm a new lower low, continuing the broader bearish trend and possibly entering a capitulation phase.
---
🎯 Key Levels to Watch:
Level Significance
$0.0229 – $0.0307 Major demand zone (historical support)
$0.0387 Initial resistance / bullish trigger
$0.0512 & $0.0610 Previous supply zones
$0.1209 & $0.1545 Mid-term reversal targets
$0.2437 Long-term target if uptrend confirms
---
🔄 Conclusion:
TRU/USDT is at a make-or-break point. Bulls and bears are clashing at this critical support. Will this be the start of a long-awaited reversal, or will we see a deeper breakdown?
The coming weekly candles will be crucial. Smart traders will wait for clear confirmation — not just reaction.
---
🧲 Trading Strategy Ideas:
Conservative Bulls: Wait for a weekly breakout above $0.0387 with volume confirmation.
Aggressive Traders: Consider entry at support with tight stop-loss below $0.0225, aiming for $0.0512 short-term.
Bearish Bias: Short after confirmed weekly close below support.
#TRUUSDT #TrueFi #CryptoReversal #AltcoinAnalysis #SupportZone #TripleBottom #BreakoutSetup #WeeklyChart
#TRU/USDT Low Risk vs High Rewards#TRU
The price is moving within a descending channel on the 1-hour frame and is expected to break and continue upward.
We have a trend to stabilize above the 100 moving average once again.
We have a downtrend on the RSI indicator that supports the upward break.
We have a support area at the lower limit of the channel at 0.0285, acting as strong support from which the price can rebound.
We have a major support area in green that pushed the price upward at 0.0280.
Entry price: 0.0300
First target: 0.0314
Second target: 0.0328
Third target: 0.0350
To manage risk, don't forget stop loss and capital management.
When you reach the first target, save some profits and then change the stop order to an entry order.
For inquiries, please comment.
Thank you.
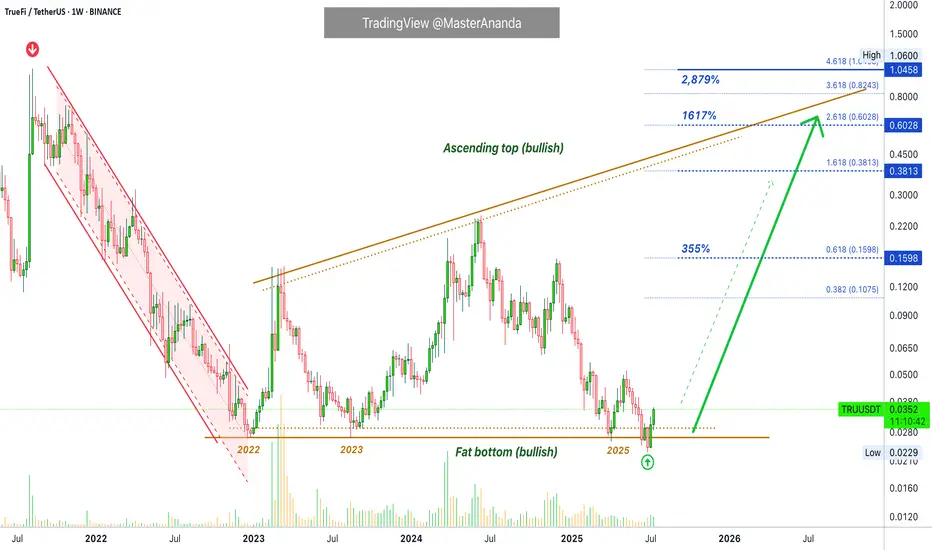
TrueFi · Bitcoin vs the Altcoins · Low Risk vs High RewardsTrueFi is trading at bottom prices. Notice the big difference between this pair and the ones that are trading high, near resistance or at a new all-time high. This is the difference I want to point out to new buyers.
If you are entering the market just now, you should be considering pairs like this one rather than the ones that are already pretty advanced. This is because the ones trading low/near support have more room available for growth, higher profits potential and very little risk. When prices are trading near the bottom, there isn't much room to go lower. When prices are trading high, even with marketwide bullish action, a correction can develop anytime.
We look for pairs like this one to buy and hold.
The second consideration is related to growth potential. While Bitcoin is awesome; Bitcoin is crypto; Bitcoin is great and is here to stay, it is already worth trillions of dollars. If everything goes amazing for Bitcoin, we might enjoy an additional 100% growth before the cycle ends. On an altcoin, in comparison, we can enjoy 1,000%, 2,000%, 3,000%, 5,000% or more. So you need to choose wisely.
A whale can easily choose Bitcoin because of liquidity issues, accessibility, security, stability, accounting, long-term performance, etc. A tiny fish is better off with the altcoins market, they have more room for growth.
Technical analysis
The red channel reveals a downtrend, the previous bear-market. The flat bottom in the following years reveals a consolidation period, long-term. Not a downtrend but creating a base. From the bottom we grow.
TRUUSDT is no longer bearish, moving down, instead it accumulated for years and now that this accumulation phase is over we are ready for massive growth.
We witnessed first a downtrend, then sideways (consolidation) and now comes an uptrend. These are the only three ways in which the market can move. Down—neutral—up.
The logical next step after a downtrend is always a sort of transition period, after this transition the uptrend starts.
We will have an uptrend now, this is what we call a "bull market." Higher highs and higher lows."
If you enjoy the content, you can always follow for more. It is easy and free and you get to receive updates every time I publish a new article.
Thanks a lot for your continued support.
Namaste.
TrueFi (TRU)#TRU
The price is moving within a descending channel on the 1-hour frame and is expected to break and continue upward.
We have a trend to stabilize above the 100 moving average once again.
We have a downtrend on the RSI indicator that supports the upward break.
We have a support area at the lower limit of the channel at 0.0270, acting as strong support from which the price can rebound.
We have a major support area in green that pushed the price upward at 0.0260.
Entry price: 0.0275
First target: 0.0281
Second target: 0.0290
Third target: 0.0301
To manage risk, don't forget stop loss and capital management.
When you reach the first target, save some profits and then change the stop order to an entry order.
For inquiries, please comment.
Thank you.

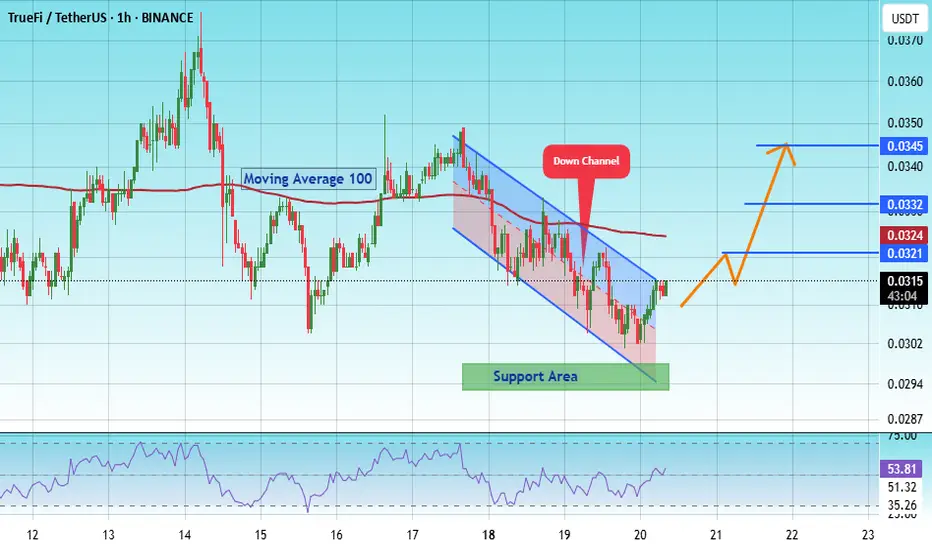
#TRU/USDT#TRU
The price is moving within a descending channel on the 1-hour frame, adhering well to it, and is heading towards a strong breakout and retest.
We are experiencing a rebound from the lower boundary of the descending channel. This support is at 0.0300.
We are experiencing a downtrend on the RSI indicator, which is about to break and retest, supporting the upward trend.
We are in a trend of consolidation above the 100 Moving Average.
Entry price: 0.0315
First target: 0.0327
Second target: 0.0337
Third target: 0.0350
#TRU/USDT#TRU
The price is moving within a descending channel on the 1-hour frame, adhering well to it, and is heading towards a strong breakout and retest.
We are experiencing a rebound from the lower boundary of the descending channel.
This support is at 0.0375.
We are experiencing a downtrend on the RSI indicator, which is about to break and retest, supporting the upward trend.
We are heading towards stability above the 100 Moving Average.
Entry price: 0.0378
First target: 0.0387
Second target: 0.0395
Third target: 0.0403

TRUUSDT 1D Analysis TRU ~ 1D Analysis
#TRU Buy after successfully breaking the $0.052 resistance line with a short-term target of at least 10%+.

TRUUSDT 1WTRU ~ 1W Analysis
#TRU Support blocks that you might be able to consider to start buying back from here with a short -term target of at least 20%+.

#TRU/USDT#TRU
The price is moving in a descending channel on the 1-hour frame and is adhering to it well and is heading to break it strongly upwards and retest it
We have a bounce from the lower limit of the descending channel, this support is at a price of 0.0350
We have a downtrend on the RSI indicator that is about to break and retest, which supports the rise
We have a trend to stabilize above the moving average 100
Entry price 0.0438
First target 0.0511
Second target 0.0553
Third target 00630

TrueFi (TRU)Comprehensive Analysis of TRU/USDT
Overview
TrueFi (TRU) is an innovative project in the decentralized lending space (DeFi Lending) that enables collateral-free lending. The TRU coin is among the low-market-cap cryptocurrencies, and due to its low liquidity and high volatility 🚨, it falls into the category of high-risk trades. For investing or trading this coin, risk management and attention to trading volume are essential.
Current Market Situation
Downtrend Channel: 📉
TRU’s price is currently in a downtrend channel and is heading towards the bottom of the channel.
Weekly Support Zone:
The range (0.0605 - 0.0662) acts as a key support level. Although there is a possibility of a drop below this range, a quick rebound (Fake Breakout) from this zone could signal a safe entry. 💡
Trading Volume: 📊
If the volume increases when the price bounces from the channel’s bottom, the likelihood of price rising to the top of the channel strengthens. Traders should pay close attention to volume near the support range.
RSI: 📈
RSI Support Zone:
The range (41.24 - 44.19) could prevent further decline. A breakdown of this zone could lead to a deeper drop.
Breaking the 50 RSI Zone:
A move above this level could indicate a strong upward move, providing a good entry opportunity. 🚀
Upcoming Scenarios
Bullish Scenario: 🌟
Bounce from the Bottom of the Downtrend Channel:
If the price stabilizes in the support range (0.0605 - 0.0662) and trading volume increases, an upward move to the top of the channel becomes likely.
Breakout of the Downtrend Channel’s Top:
If the top of the downtrend channel is broken, the price could reach the target range (0.2258 - 0.2702). Given TRU's low market cap, heavy liquidity inflow could push the price beyond this target. 📌
Bearish Scenario: ⚠️
Loss of Weekly Support:
If the range (0.0605 - 0.0662) is lost, the next support is at 0.0400.
Traders should set appropriate stop-loss orders to mitigate risk. 🛑
Weakness in RSI:
A breakdown of the support zone (41.24 - 44.19) in the RSI could signal a continuation of the downtrend. 🔻
Range-Bound Scenario: ⏸️
If the price remains within the weekly support zone and trading volume decreases, a short-term range-bound movement may develop. 🔄
Stop-Loss:
For long trades, set the stop-loss below the 0.0600 range. ❌
Trade Volume:
Given the high risk, it is recommended to allocate only a small percentage of capital to this trade. 💰
Summary
TRU, considering its technical setup and position in the downtrend channel, can present promising trading opportunities. However, due to its low market cap and high volatility, risk management is crucial. ⚡
Recommendation: Always review fundamental factors and project-related news before making any decisions. 📰
⚖️ Warning: This analysis is purely technical and should not be considered financial or investment advice. Always do your own research and practice risk management. Good luck! 🚀

TRU or TRUfi Chart predictionTRU is in a multi-month support zone. You can buy more TRU at $0.077.
Hold term - Long Term.
Future Potential: TRUFi's decentralized finance (DeFi) platform enables efficient and transparent borrowing and lending. As the DeFi ecosystem grows, TRU could play a crucial role in addressing liquidity issues and offering financial services to the unbanked.
Latest News: TRUFi Partners with Major Financial Institution for Increased Liquidity
The SEC alleges that nearly half a billion dollars in TrueUSD (TUSD) is not properly backed, affecting pairs on major exchanges like Binance, Bybit, Gate.io, and Bitget.
TrueUSD is accused of using phony attestation reports, having opaque ownership structures, and secretly investing backing assets in risky, illiquid ventures.
The SEC's complaint suggests that since March 2020, TrueUSD's "commodity fund" misappropriated user funds, with 99% of TUSD's backing assets being illiquid as of this month.
Major investors like a16z, BlockTower, and Alameda Research invested $12.5 million in TrueUSD's governance token, TRU, despite the alleged misappropriation.
Binance listed TrueUSD and later made it the only stablecoin with fee-free trading, leading to $1.5 billion in TUSD mints, which the SEC claims were never fully backed.
The article emphasizes the need for radical transparency in the crypto industry to prevent fraud and suggests continuous scrutiny of major projects to avoid reliance on regulatory bodies like the SEC for cleanup.

#TRU/USDT Ready to go higher#TRU
The price is moving in a descending channel on the 30-minute frame and sticking to it well
We have a bounce from the lower limit of the descending channel, this support is at 0.0780
We have a downtrend on the RSI indicator that is about to be broken, which supports the rise
We have a trend to stabilize above the moving average 100
Entry price 0.0795
First target 0.0810
Second target 0.0836
Third target 0.0863

TRU planThis is my TRU plan. I expect the price to bounce in orange box. Lets see if the market gives us orange box.

#TRU/USDT#TRU
The price is moving in a descending channel on a 30-minute frame and is expected to continue upwards
We have a trend to stabilize above the moving average 100 again
We have a descending trend on the RSI indicator that supports the rise by breaking it upwards
We have a support area at the lower limit of the channel at a price of 0.1200
Entry price 0.1200
First target 0.1250
Second target 0.1300
Third target 0.1370


Tru/UsdtBINANCE:TRUUSDT
### **Current Price: 0.1484 📊**
- The **current price** of Tru is **0.1484**. This is where the market is right now. From here, the price could either go up, break through resistance levels, or drop to support levels depending on market movements.
---
### **Resistance Levels 🚧:**
Resistance levels are points where the price may face difficulty rising above. If the price breaks through these levels, it might surge higher.
- **0.1700** 🚀: The first level of resistance. If the price breaks above this point, there could be a continuation of the upward trend 📈.
- **0.2000** ⚡: A stronger resistance level. Breaking this level could indicate a more significant bullish move. It could bring more attention to the asset as it climbs higher.
- **0.2434** 🌟: An even higher resistance level. If the price manages to break this point, it could signal a strong momentum shift and lead to a larger rally.
Breaking these resistance levels means the price could push higher, but if it fails to maintain above these points, we could see a pullback.
---
### **Support Levels ⬇️:**
Support levels are price points where the market tends to find buying interest. If the price falls to these points, buyers might step in, and the price could reverse.
- **0.1233** 🛑: The first support level. If the price drops here, it could find some support and might reverse back up 📈. However, if it fails to hold, we may see a further decline.
- **0.1000** 💡: A critical support level. If the price reaches this level, it might indicate that the market is struggling to go lower. Buyers might step in, pushing the price back up 🏠.
- **0.0800** 🏚️: The lowest support level you mentioned. If the price drops here, it could signify a deeper correction or a strong area where the price might stabilize. However, if this level is broken, further declines are possible ⏬.
---
### **Not Financial Advice 🚫💸**
Remember, this analysis is just an observation based on the levels you provided, and the market can be unpredictable. Always do your own research and be cautious when making trading decisions!

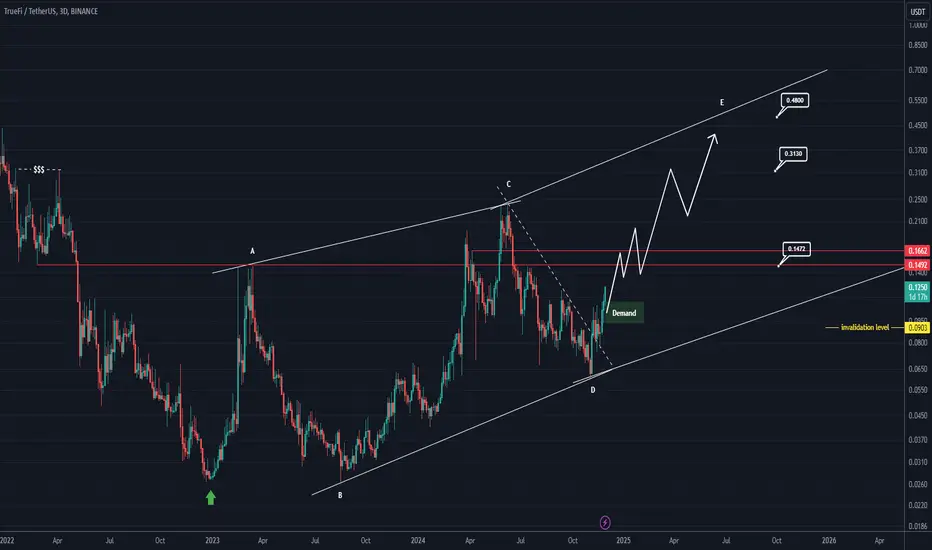
TRU ROADMAP (3D)This analysis provides an overall view for TRU. Entering a position requires determining entry points, stop-loss levels, and proper capital management. Those who hold this coin in their portfolio can use this analysis to stay informed about its potential future fluctuations.
TRU appears to be in a diametric structure, and it seems to be aiming to complete wave E.
The time frame is 3 days, and this analysis will take time to materialize.
We have marked the main targets of this move on the chart.
On the top left, we have a liquidity pool. Once this pool is emptied, we need to be cautious (after reaching the second target).
A daily candle closing below the invalidation level will invalidate this analysis.
For risk management, please don't forget stop loss and capital management
When we reach the first target, save some profit and then change the stop to entry
Comment if you have any questions
Thank You
TRUUSDT 1WTRU ~ 1W
#TRU This is a coin from the RWA sector. If you have Conviction on this coin,. Wait until the resistance line of this pattern is successfully broken. after that buy in stages. with a minimum target of 20%+

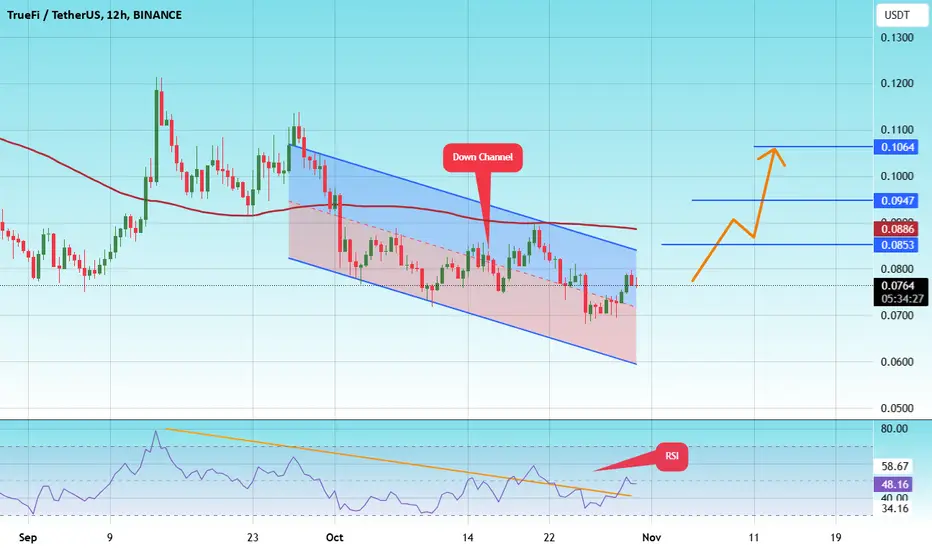
#TRU/USDT#TRU
The price is moving in a downward channel on the 12-hour frame upwards and is expected to continue
We have a trend to stabilize above the moving average 100 again
We have a downward trend on the RSI indicator that supports the rise by breaking it upwards
We have a support area at the lower limit of the channel at a price of 0.0763
Entry price 0.0764
First target 0.0853
Second target 0.0946
Third target 0.1064