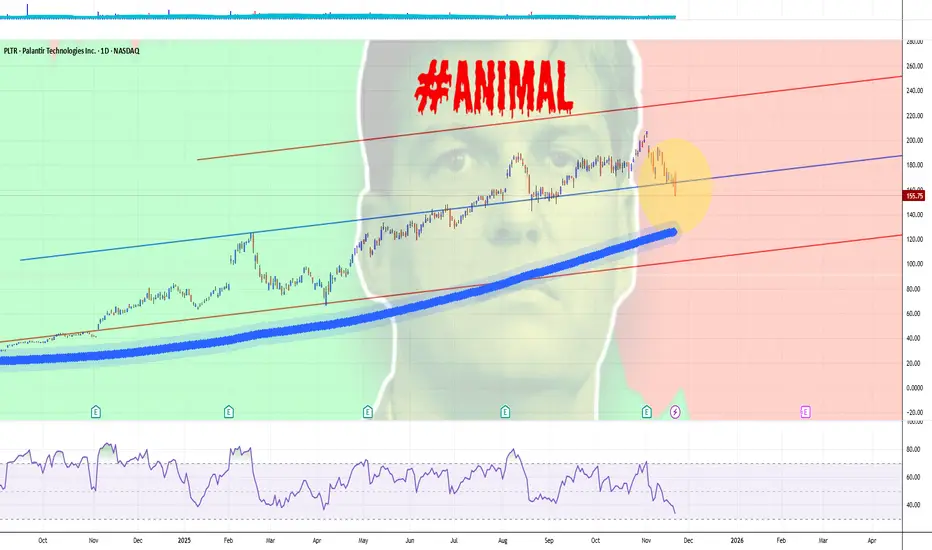
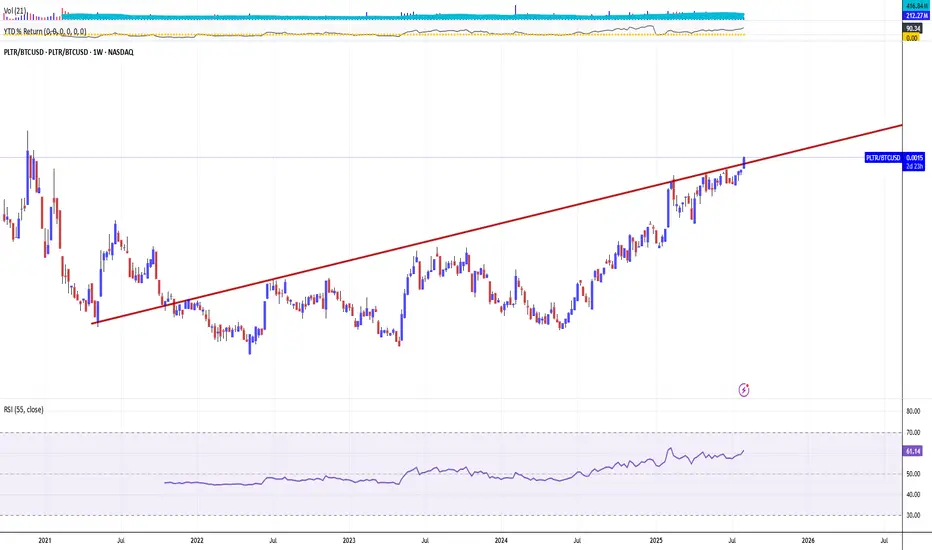
THE BATSHIT ANIMAL SENDS PALANTIR STOCK BELOW ITS MAJOR SUPPORTMichael Burry, known from "The Big Short," recently made a significant bearish bet against Palantir Technologies, placing put options on about 5 million shares valued around $912 million.
This move signifies strong skepticism about Palantir's stock prospects despite the company's robust recent earnings growth. Palantir’s shares dropped about 8% after the disclosure of Burry’s short position, marking one of its worst days in months.
Previously, Burry's Scion Asset Management also took bearish positions on Nvidia, indicating his broader concern about what he perceives as overvalued AI-related stocks benefiting from a market bubble fueled more by momentum than fundamentals.
Palantir had reported a 63% year-on-year revenue increase and a tripled net income, but Burry’s stance suggests he questions the sustainability of this growth amid higher capital costs and potentially overstated future expectations on AI.
Palantir's CEO Alex Karp publicly challenged Burry, dismissing the shorts despite Burry's influence creating nervousness among investors.
Burry’s bearish moves serve as a warning to the market that even AI darlings like Palantir are vulnerable to sharp declines if their elevated valuations and growth prospects fail to meet investor expectations (especially when wild animals are walking there).
The main NASDAQ:PLTR chart points that there's a potential for Bear extension, to $125-150 range.
https://www.tradingview.com/x/RxJay0hf/
--
Best wishes,
@PandorraResearch Team
Trumpsucks
BITCOIN/ EURO. THROW YOUR HANDS IN THE AIR - THE ROOF IS ON FIREThe main technical graph is Bitcoin in Euro, and yes..
.. the major supports of 52-week SMA and 3-year old trend have been broken.
Feels, this is the roof.. and the roof is on fire.
// we don't need no crypto
let the motherfucker burn
--
Best wishes,
@PandorraResearch Team

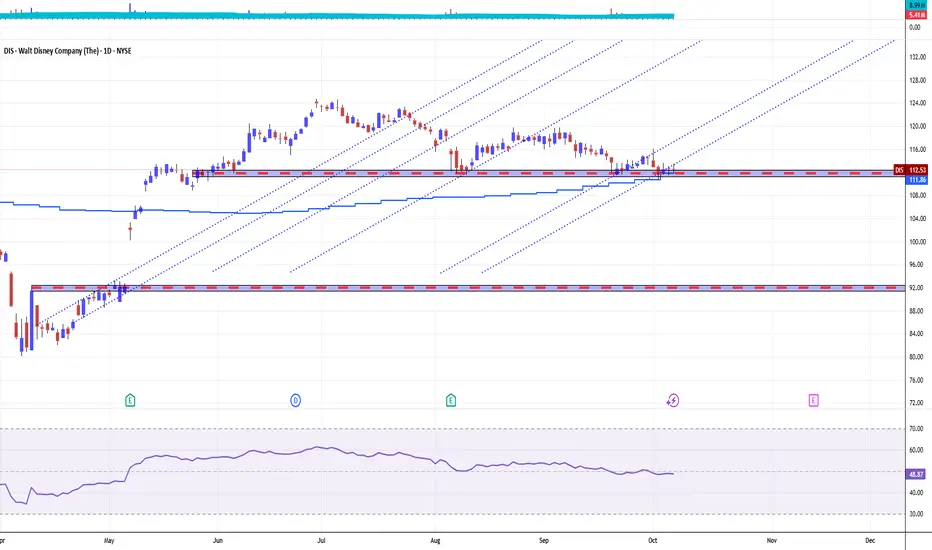
DISNEY STOCK GOES MICKEY MOUSE'D, FALLS UNDER 52-WEEK SMA AGAINDisney (DIS) stock fallen under its major support of 52-week SMA Thursday, immediately after the company reported mixed fourth quarter results on November 13, 2025 as continued declines in its linear TV business offset strength in parks and streaming.
Disney reported revenue of $22.46 billion for the quarter, missing analyst expectations of $22.83 billion and coming in roughly comparable to the year-earlier period.
A 6% revenue drop within the company's entertainment division, which includes its streaming, TV, and theatrical businesses, contributed to the top-line miss. Linear network revenue fell 16% year over year, while operating income dropped 21% as cord-cutting accelerated and ad dollars continued to shift toward streaming.
The results came in the final stretch of CEO Bob Iger’s turnaround ahead of his planned departure next year.
The company said the decline in operating income was driven in part by the sale of its Star India assets, which contributed $84 million to results a year ago. Domestic linear networks also came under pressure from lower advertising tied to weaker viewership and a $40 million decline in political ad spending compared to the prior-year quarter.
Disney also faced weaker theatrical comparisons in the period, adding to the drag on overall Entertainment results.
We still consider to achieve our initial target i.e. fill the gap around $92.17 per share (see relative ideas).
--
Best wishes,
@PandorraResearch Team

BITCOIN/ EURO. THIS IS THE END...The main technical graph is Bitcoin in Euro, and yes..
.. it nears to break the major 52-week SMA and 3-year old trend supports.
Feels, this is it the end.

DISNEY STOCK GOTTA GO TO TRAMPLING AS 2026 NEARSDisney stock faces several bearish pressures likely to persist through the end of 2025. The company is contending with declining subscriber growth for Disney+, which has seen a drop of 700,000 subscriptions amid stiff competition and price increases. Advertising revenues remain under pressure, and consumer spending shifts post-pandemic have made the theme parks’ revenue outlook ambiguous. Structural vulnerabilities, such as weak liquidity—a current ratio of just 0.72—and low momentum after Q3 2025, underline financial fragility despite revenue increases.
Additionally, Disney’s brand is exposed to risks from ongoing political polarization, which was highlighted by market reactions to high-profile controversies and programming changes in 2025. The rollback of DEI policies may increase near-term stability but risks alienating younger demographics, putting long-term brand equity at risk. Analysts project an overall bearish trend, with some forecasts predicting a correction phase and a year-end share price between $95 and $109 as negative momentum persists despite isolated rebounds.
Finally, Disney shares have underperformed broader market indices in 2025, dropping about 9% in the face of tariff threats and investor uncertainty under President Trump’s administration, making the short-term investment case weak compared to industry peers.
In technical words, Disney stock shined bright in May and June, 2025 but then later (after many bearish attempts) turned back to major support 26-week SMA (100-day low), shed positive intra year returns back to flat line.
Well, in any case of 26-week SMA breakthrough we still consider to achieve our initial target i.e. fill the gap around $92.17 per share (see relative idea).
--
Best wishes,
@PandorraResearch Team
TRUMP : SIGNALHello friends
Given the good growth we had and the entry of buyers, now that the price is correcting and a double bottom pattern has formed, there is a good opportunity to buy with risk and capital management and move towards the specified goals.
*Trade safely with us*

BEWARE FAKE NEWS BY TRADINGVIEW, AS BITCOIN CYCLES STILL WORK.Hooray.. Hooray...
🌕 “Uptober” Strikes Again
October has a reputation in crypto lore and it’s living up to it.
That was sample of somewhat ̶F̶a̶k̶e̶ ̶N̶e̶w̶s̶ ̶A̶g̶e̶n̶c̶y̶ Team @Tradingview has recently posted in early October, 2025 somewhere there .
- What happened next? Less then a month later!?
- We all see that pretty well. Bitcoin has jumped into Bearish market under $100'000 per coin, in early November, 2025.
The price of the world's most well-known currency slid to its lowest point since hitting its record high of over $126000
- Know why?
- Because cycles still work. But perhaps not for fake news agencies.
Well. Lets discover - who is who. What is fake, and what is not.
Growth cycle. Jan 2011 ($1 per BTC) - Jan 2014 (1062 days)
Correction cycle. Jan 2014 - Jan 2015 (363 days, 80 percent off)
Growth cycle. Jan 2015 - Dec 2017 (1062 days)
Correction cycle. Dec 2017 - Dec 2018 (363 days, 80 percent off)
Growth cycle. Dec 2018 - Dec 2017 (1062 days)
Correction cycle. Dec 2017 - Nov 2021 (363 days, 75 percent off)
Growth cycle. Nov 2021 - Oct 2025 (1062 days)
Correction cycle. Oct 2025 - Oct 2026 (363 days, ++ percent off).
Well now you see. Big things work much easy and cheaper rather you think.
--
Best wishes,
@PandorraResearch Team

CHILE Stock Market Technical and Fundamental PerspectivesChile’s stock market is primarily represented by several key indices, each with distinct characteristics and coverage:
IGPA (Índice General de Precios de Acciones) BCS:SPCLXIGPA
The IGPA is the broadest and most representative index, covering the majority of stocks traded on the Santiago Stock Exchange. It is a capitalization-weighted index, revised annually, and includes companies across all major sectors of the Chilean economy. As of May 2025, the IGPA reached a historic high of over 42,000 points, reflecting robust market performance.
IPSA (Índice de Precios Selectivo de Acciones) BCS:SP_IPSA
The IPSA is a more focused index, comprising the 40 most heavily traded stocks on the Santiago Stock Exchange. It is revised quarterly and serves as the benchmark for large-cap Chilean equities.
S&P/CLX INTER Index 10 BCS:SPCLXIN10
This index tracks the 10 main Chilean stocks that also have American Depositary Receipts (ADRs) listed abroad, providing a bridge between local and international investors.
STOXX® Chile Total Market Index
This index aims to cover approximately 95% of Chile’s free-float market capitalization, with top components including major companies such as Falabella, Banco de Chile, LATAM Airlines Group, Cencosud, Banco Santander Chile, Empresas Copec, and Sociedad Química y Minera de Chile (SQM).
Key Components
The leading companies in Chile’s indices span various sectors:
Financials: Banco de Chile, Banco Santander Chile, Banco de Crédito e Inversiones
Retail: Falabella, Cencosud
Utilities/Energy: Enel Américas, Empresas Copec
Mining/Chemicals: Sociedad Química y Minera de Chile (SQM)
Forestry/Paper: Empresas CMPC
Airlines: LATAM Airlines Group
Long-Term Technical Perspective and Recent Trends
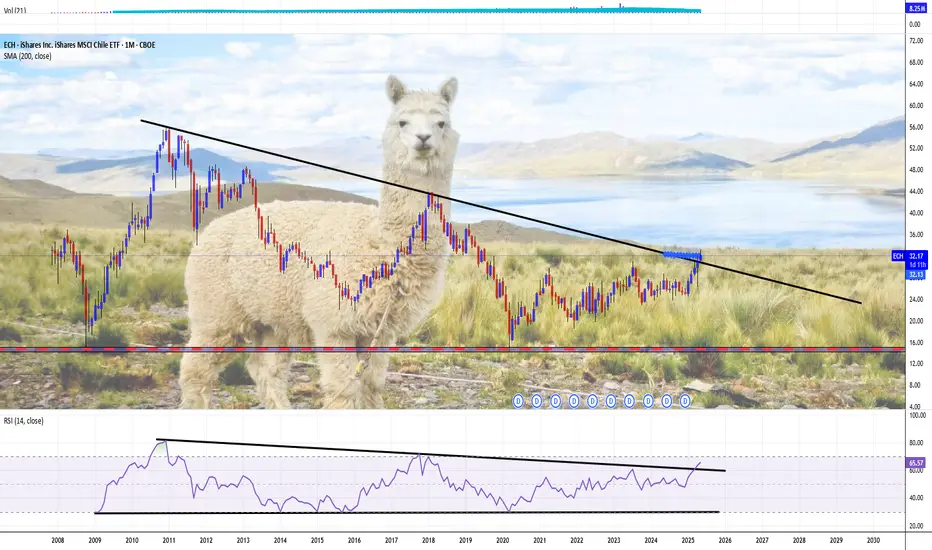
The Chilean stock market, as reflected by the IGPA and IPSA, has experienced a strong rally in 2025, with the major indices gaining over 25% year-to-date
The MSCI Chile index currently presents a mixed technical picture. While long-term moving averages (200-day) signal a "buy," shorter-term indicators (5-100 day) are on "sell," and several oscillators (RSI, Stochastic, MACD) indicate oversold conditions or continued selling pressure.
This suggests that, despite the recent rally, some short-term consolidation or correction could occur, but the long-term trend remains constructive.
Fundamental breakdown
The Santiago Stock Exchange’s market capitalization stands at approximately $187 billion, with a price-to-earnings (P/E) ratio of 12.08, which is below both the emerging markets average (14.3) and the global average (22.12).
This relatively low valuation, even after a significant rally, suggests Chilean equities remain attractive on a fundamental basis.
The Chilean economy is projected to grow by 2.3% in 2025. Inflation has moderated to 4.5%, and the central bank’s benchmark interest rate is stable at 5%.
The banking sector is particularly robust, with Banco de Chile reporting a 14.2% year-over-year increase in net income for Q1 2025.
The mining sector, especially lithium, is poised for growth following major investments and Chile’s strategic push to regain global leadership in lithium production.
The combination of strong fundamentals, sectoral diversity, and attractive valuations positions Chile’s stock market for steady long-term growth, though short-term volatility is possible as global and local conditions evolve.
Conclusion
Chile’s stock market demonstrates strong long-term potential, underpinned by solid economic fundamentals, sectoral strengths, and attractive valuations, though investors should remain mindful of cyclical corrections and global market influences.
Thу main technical chart for CBOE:ECH - iShares MSCI Chile ETF (total return) points on massive 200-months SMA breakthrough, attempts to break long term 'descending top/ flat bottom' technical figure.
--
Best wishes,
@PandorraResearch Team 😎
TECH MARKET MENAGERIE PUTS GOLD SPOT 10% OFF. TO WHERE IT GOES?!Due to recent stock market menagerie appetite, Gold's spot market has experienced a sharp correction, with prices dropping over 10% from recent record highs above $4,400 per ounce to levels just under $4,000 in late October 2025.
This decline, the steepest in over a decade, followed an extraordinary rally characterized by aggressive speculative buying and "fear of missing out" momentum trades.
The abrupt reversal was primarily driven by profit-taking, unwinding of leveraged positions, and the market reaching extreme overbought conditions rather than major shifts in fundamental drivers such as inflation or geopolitical risk.
After nine weeks of sustainable Gold market growth, Gold futures volatility CBOE:GVZ has almost doubled in price from 20 points to up to 35, from early by mid-October 2025 that left no chance to avoid further Gold market turmoil (that has appeared in the 2nd half of October, 2025).
Gold spot and volatility over the past twelve months.
In the near term, volatility is expected to stay elevated as traders reassess risk after the technical correction. While some analysts warn of continued downside—suggesting the rally may have been overextended and that further declines toward $3,500 per ounce are possible if sentiment worsens - others emphasize that structural supports like central bank demand and global uncertainty remain intact, limiting the long-term bearish case.
Thus, while the sharp correction has tested investor nerves, the broader outlook remains constructive if gold holds key support levels above 50-day SMA ($3780-3800 per ounce in this given time), through the current repositioning phase.
--
Best wishes,
@PandorraResearch Team

TRUMP : SIGNALHello friends
According to the growth we had, you can see that the price has fallen to the same level as this channel and the price is well supported. Now that the price is well supported, we can buy in steps in the specified areas with capital and risk management and move with it to the set goals.
*Trade safely with us*

GOLD SLOWS MOMENTUM DUE TO 'NO TOMAHAWKS' FOR YELLOW-BLUES. BUT.Gold tumbled more than 5% to around $4,130 per ounce on Tuesday, poised for their biggest daily drop since August 2020, after touching a record high near $4,380 ahead of Trump talks on Friday 17, 2025 about Tomahawk missiles for the yellow-blue doggone regime.
The decline comes as profit-taking accelerated and the US dollar strengthened, while safe-haven demand eased amid improving global sentiment.
Moreover pptimism grew over easing US–China trade tensions, with Presidents Donald Trump and Xi Jinping scheduled to meet next week to address tariff disputes and avoid further escalation.
The end of the seasonal gold-buying spree in India also weighed on physical demand.
Meanwhile, there were expectations also that the US government shutdown could be resolved this week and anticipation of Friday’s delayed US inflation data.
However markets continue to price in a 25-basis-point Fed rate cut next week, with another reduction likely in December.
Also, despite the pullback, gold remains up near 60% year-to-date, supported by expectations of further Fed easing and further lingering demand for safe-haven assets.
The main technical chart says Gold still is on the upside path.
--
Best wishes,
@PandorraResearch Team

PHYSICAL GOLD vs 'DIGITAL ONE'. WHICH WAY YOU GOTTA GO RNCreating custom formulas can put price action into different perspectives. You can think of the search bar on TradingView like a calculator.
This chart, for example, shows XAUUSDK - BTCUSD i.e. the difference in prices of one Kilo of Gold FX_IDC:XAUUSDK and 1 BTC coin BITSTAMP:BTCUSD . But we could have expressed many different formulas including: (PLTR + GLD)*2 or TSLA + F + GM and even AAPL^10 🤭
There are countless ways to create equations on TradingView. To get started, type the equation you want to chart into the search bar. When you're ready, press Enter, and the chart will appear.
The chart we created shows XAUUSDK-BTCUSD and it paints a picture about low-volatility 1 kilo Gold bar performance compared to 1 BTC 'digital gold' performance (high-volatility, rising or spiking, back-and-forth movements).
The channel on the chart demonstrate that the current difference has been tested several times before in the past, all the time around neutral zero-level.
Well.. since the difference rn is where it's been 5 years ago... you can clearly see that high volatility and risk does not nessesary bring ypur portfolio to higher return versus low volatility Gold spot.
Of course, this is not a recommendation or a signal of any sort. Instead, we are hoping to demonstrate the creativity you can use when building an equation. You can create formulas across all asset classes.
💪 Thanks for reading and please let us know your thoughts in the comments. Press like if you enjoyed this post, then vote in comment box which way you gotta go:
A. Mostly Bullish. Physical Gold prevails.
B. Mostly Bearish. 'Digital Gold' advanced.
C. Range/ Sideways in short to mid-term.
--
Best wishes,
@PandorraResearch Team

BTC FUTURES. CRYPTO PRIDE GOES 'COALESCE' INTO SOMETHING BIGGER BTC faces negative fundamental and technical perspectives due to escalating US-China tensions, which have sharply dampened investor sentiment and triggered risk-off behavior across global markets.
Fundamentally, renewed hostilities between the world's two largest economies - including tariff threats from President Trump and Chinese retaliation - have caused investors to withdraw from risk assets like Bitcoin, preferring safety and liquidity.
This has led to billions in ETF outflows and widespread selling pressure, undermining BTC's safe-haven narrative and reinforcing its correlation with traditional market stress.
Technically, BTC has broken key support levels, dropping below $112,000-$111,200 and failing to sustain its recent rebounds. The weakening price structure is marked by lower highs and persistent downward momentum, with liquidation of leveraged positions exacerbating volatility.
Market indicators, such as declining funding rates and falling perpetual markets, signal cautious investor behavior and further downside risks.
Retail and institutional withdrawal, coupled with geopolitical uncertainty, raise the likelihood of more pronounced corrections, with some analysts warning of a potential sub-$100,000 move if tensions intensify further.
In short, BTC Futures goes to break 6-month long recovery uptrend (came from mid-April crater), that gives a resonable opportunity to further decline.
--
Best wishes,
@PandorraResearch Team

PALLADIUM GOES 'HIGH FLY' MODE, DUE TO STRONG SAFE-HAVEN DEMANDPalladium surged above $1,400 an ounce for the first time since June 2023, supported by strong safe-haven demand and expectations of interest rate cuts.
The US government shutdown added to market uncertainty, prompting investors to reassess dollar-denominated assets in favor of bullion.
Weak US labor market data strengthened bets on further Federal Reserve cuts, with markets pricing in 25 bps reductions at each of the final two meetings.
France’s political crisis also supported prices, as President Macron faces pressure to call early elections or resign after PM Lecornu’s surprise resignation.
On the supply side, the World Platinum Investment Council projected palladium output to decline 1.1% annually through 2029.
Additionally, China established new financial infrastructure to serve as a precious metal custodian for foreign markets, further supporting prices.
With nearly 63 percent year-to-date return, the main technical graph for Palladium futures NYMEX:PA1! indicates that further upside is still quite possible.
--
Best wishes,
@PandorraResearch Team

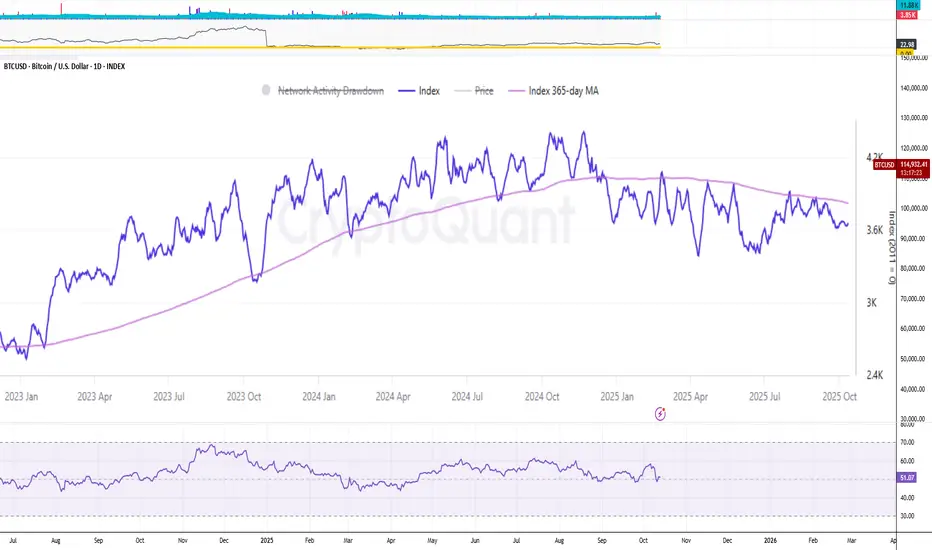
BITCOIN NETWORK ACTIVITY INDEX. GUIDE DOG THAT STILL ISN'T BLINDWere you still fantasy dreamed about super-duper hyped Crypto and Tech names, or recently were wiped out already when prices changed each second on Friday, October 10, 2025 even faster rather then video clips do it in TikTok Reels or for example YouTube Shorts?..
...but there're several important issues that you should know.
Well.. lets talk about Bitcoin Network Activity Index, and why this one is guide dog that helps you to alive, not staying blind in the Galaxy of uncertainity.
Green Light. Red Light. Both Colours Blind.
Guide dogs (colloquially known in the US as seeing-eye dogs) are assistance dogs trained to lead people who are blind or visually impaired around obstacles. Although dogs can be trained to navigate various obstacles, they are fully red–green colour blind and incapable of interpreting street signs. The human does the directing, based on skills acquired through previous mobility training.
The handler might be likened to an aircraft's navigator, who must know how to get from one place to another, and the dog is the pilot, who gets them there safely.
Understanding Network Activity Index.
While time to time crypto candles change colours on your monitors even faster rather then video clips do it in TikTok Reels or for example YouTube Shorts, there should be a comprehensive metric designed to measure the overall safety and health of the Bitcoin network.
That is Bitcoin Network Activity Index specially designed by CryptoQuant by aggregating several important blockchain indicators.
These indicators include the number of active addresses (sending, receiving and both together), transaction counts, unspent transaction outputs (UTxOs), average block size, and other on-chain transactional data. This index provides a quantifiable overview of how much usage and engagement the Bitcoin blockchain is experiencing at any given time.
Bictoin Network Activity Index. How it works
The index serves as an important tool for understanding the fundamental dynamics of Bitcoin beyond just price movements. It captures the transactional activity and network participation that underpin Bitcoin’s value as a decentralized digital asset. For example, increases in the Network Activity Index often coincide with periods of rising Bitcoin price and heightened market enthusiasm, while decreases can indicate slowing demand, bearish sentiment, or periods of consolidation where market participants are holding rather than actively trading.
Significantly, the CryptoQuant Network Activity Index has been shown to correlate historically with Bitcoin's price action. When transaction volume, active addresses, and other network engagement measures rise, it can signal growing adoption and usage, which creates natural buying pressure and supports price increases. Conversely, sharp declines in network activity have often preceded or occurred alongside Bitcoin price drops, reflecting waning market interest or corrections.
Relations with Bictoin price action.
An example of network activity importance is the noted 600,000 daily transactions threshold highlighted by CryptoQuant analysts. This activity level appears to act as a “price engine” trigger, where surpassing it tends to lead to continued price rallies. Thus, rising transaction counts robustly indicate rising underlying demand on the network, which is a bullish sign for Bitcoin’s price.
However, it is important to note that network activity by itself does not determine price direction in isolation. Bitcoin’s price is influenced by a mix of factors including macroeconomic conditions, regulatory developments, market speculation and institutional activiry.
And yet, network activity remains a key fundamental indicator that helps market participants gauge the genuine level of usage and interest in Bitcoin, providing insights about market sentiment and potential price trends.
Conclusion.
In summary, the Bitcoin Network Activity Index is crucial because it quantifies Bitcoin’s on-chain operational health and user engagement, which are leading indicators of the asset’s intrinsic demand and valuation. Monitoring this index allows investors, analysts, and traders to make more informed predictions about Bitcoin’s future price action by understanding shifts in real network usage and investor behavior rather than relying solely on price charts or external market narratives.
Were you happy about it or not, but Bitcoin Network Activity Index still sits shy under its 52-week SMA, all the year 2025, while average number of active BTC addresses recently reached 52-week lows (compare with BTC price, that is still far above its 52-weeks lows).
--
Best 'be careful in the night' wishes,
@PandorraResearch Team
GOLD NEARS THE HIGHEST [0 - 5000 RANGE] QUARTILE. WHAT IT MEANSWere you still a 'TikTok - style' trader searching your next '5-minutes maid' trade, or still stay shy to become a Gold Bug, but Gold spot this session on September 22, 2025 prints new all the history high , and nears to $3750 per troy ounce mark, i.e. the highest quartile.
Gold’s summer 2025 recent stagnation stemed from a confluence of fundamental and technical factors, reflecting both macroeconomic uncertainty and price action signals that have defined the gold market through 2025. The outlook came clear above $ 3500 per troy ounce, overbalancing upside catalysts vs resistance and correction risks.
Fundamental Reasons
Federal Reserve and Interest Rates. With markets closely watching the U.S. Federal Reserve, current gold prices reflect anticipation of imminent rate cuts (two extra 25 b.p. cuts in 2025, and one more 25 b.p. in 2026). Speculation that the Fed extends pivot to a dovish stance has reinforced support, whule the pause' expectations shed, sending prices higher.
Uncertainty and Safe Haven Demand. The primary fundamental support for gold in 2025 has been record global economic and policy uncertainty—comparable to pandemic-era highs—driven by trade policy threats, tariffs, and geopolitical risks. This uncertainty spiked gold to new highs above $3,500 in September 2025.
Inflation and Macro Risks. Still sticky real estete' inflation and soft commodities (coffee, cocoa, eggs, orange juice) inflation, concerns over U.S. debt, and shifting global central bank reserves have all added underlying support, and all of that have resulted in a sustained breakout beyond historical resistance levels.
Technical Aspects and Further Price Action Outlook
Key Trading Range. After jumping above $3,500/oz, gold has traded in a defined highway channel ($3,500–$3,750/oz), nearing to the highest quartile of range.
Support and Resistance. Current strong support lies at $3,500, and resistance around $3,700–$3,750/oz. Technical tops at these levels, coupled with declining MACD readings and steady On-Balance Volume, could reinforce the near-term pullback bias.
Risk appetite after post-April crater' recovery may cool down shortly, on US and global stock markets. The September seasonality for the S&P 500 index refers to the historical tendency for the stock market to weaken during September. Over nearly a century, September has been the worst-performing month on average for the S&P 500, often showing negative returns. This phenomenon, sometimes called the "September Effect," is considered a market anomaly as it challenges the efficient markets hypothesis.
In brief, S&P 500 index September's average performance is the weakest compared to all other calendar months, that could lead to surging demand for safe-heaven assets like Gold that could primarily fill the next range in such cases.
--
Best wishes,
@PandorraResearch Team

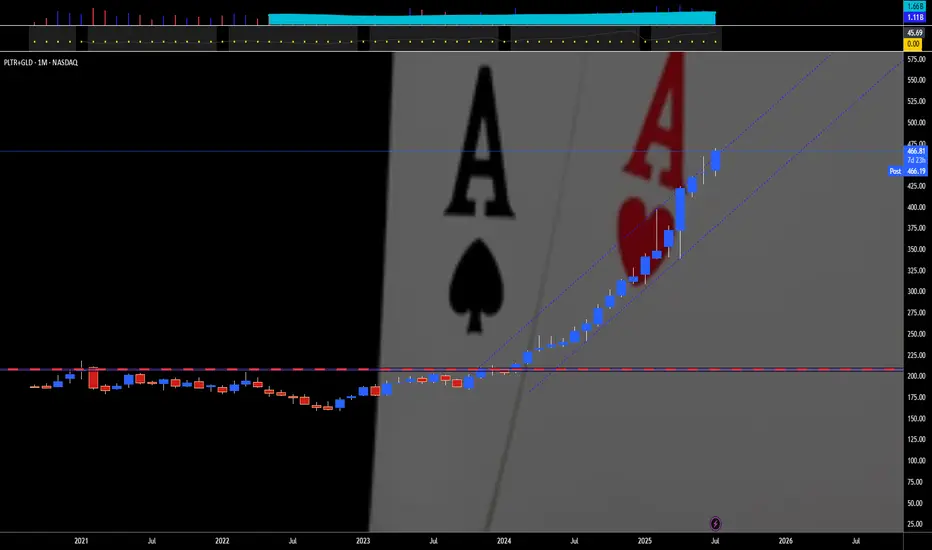
PALANTIR PLUS GOLD. VOLATILITY + STABILITY = EXPLOSIVE MIXTUREWere you still dream about super-duper hyped crypto/ AI names, which change each other like TikTok Reels or for example Google Shorts?..
.. but shortening Big portfolios or even tight ones, like Magnificent Seven, to just Palantir and Gold can provide a focused approach with compelling performance and risk management, given how both assets have outperformed tech mega-caps in 2025.
The process involves strategic decision-making, in-depth performance analysis, and clear rebalancing steps.
Magnificent Seven: 2025 Performance Context
The Magnificent Seven - Alphabet, Amazon, Apple, Meta, Microsoft, Nvidia, Tesla - have dominated market attention. But in 2025, their stocks saw significant declines. Tesla dropped by around 38%, Apple and Nvidia by 21%, while the others also posted double-digit losses in a few quarters ago. High market concentration and rising tariffs pressured these tech giants, leading investors to reconsider diversification. This environment sets the stage for seeking alternative performers.
Why Focus on Palantir and Gold?
Palantir (PLTR) has surged as one of the top S&P 500 performers, gaining over 138% this year, far surpassing the Magnificent Seven ETF, which (in the best case) print low double-digit numbers in 2025. Palantir's edge lies in its government contracts and leadership in AI platforms, making it a market leader during sector disruptions and economic uncertainty.
Gold has soared nearly 44% year-to-date, reaching record highs as the most crowded trade on Wall Street. As tech stocks falter, gold's appeal as a safe haven has intensified amid tariffs, a weakening dollar, and economic uncertainty. Major fund managers now see gold as the top-performing asset for 2025.
Portfolio Construction: Reducing to Two Securities
Capital Allocation. Split proceeds between Palantir (growth/innovation) and gold (risk-off hedge). A typical split could be 50/50 for simplicity or tailored to risk tolerance - higher gold allocation for defensive profiles, higher Palantir for aggressive growth.
Risk Management: Hedge Palantir’s volatility plus gold’s stability. Stability.... plus volatility. Two words to explain it all.
Rationale and Benefits
Concentrating on two uncorrelated assets amplifies both upside (Palantir) and defensive resilience (gold). Diversification outside tech mega-caps mitigates regulatory and single-sector risks, as seen in the recent performance divergence. Enhanced returns: Palantir’s growth-oriented rally and gold’s safe-haven gains both outperformed not only the S&P 500 but the tech elite.
By systematically selling underperforming Magnificent Seven stocks and reallocating into Palantir and gold, the portfolio tilts toward assets with strong 2025 track records and complementary risk profiles, aligning with current market realities and future outlook.
Have you seen the similar before or not yet, Palantir plus Gold move together... in one-way direction.. for TWENTY straight months in a row.
--
Best wishes,
@PandorraResearch Team

SWISS FRANC vs US DOLLAR ESTIMATES HIGHER, DUE TO YIELD CONCERNSFutures on Swiss Franc vs US dollar (mirrored mode of the OANDA:USDCHF forex pair) currently shows a bullish technical outlook, with the price breaking above the key 1.2500 level and testing new highs amid weak US data and ongoing Swiss franc demand. Most popular technical indicators—including moving averages, MACD, and momentum - signal continued upward pressure, reflected in a weekly and monthly “strong buy” consensus for CHF/USD.
Trend and Volatility
Since peaking near 1.25 in early August, CHF/USD has traded in a compressed sideways range, but recent price action suggests a potential for Bullish expansion. The pair goes to break above medium-term 40-days resistance at 1.2500; moreover, upside triggers at 1.2500 could expose further movement up to 1.2725.
Key Technical Indicators
All major moving averages (from 10-day to 200-day) are flashing Buy signals, while pivotal resistance zones cluster around 1.2500. Oscillators remain neutral to slightly positive, with RSI above 50, suggesting neither oversold nor overbought conditions, but upside momentum prevails.
Yield Spread and Macro Factors
A narrowing yield spread between US and Swiss 2-year bonds reduces the attractiveness of USD over CHF, adding further pressure to the pair. With the Swiss National Bank potentially pausing its rate cut cycle, and Swiss economic indicators showing slight improvement, the franc’s position remains fundamentally strong.
Overall, CHF/USD technical perspectives favor continued franc strength and persistent Bullish pressure on the pair, especially above the pivotal 1.2500 region.
--
Best wishes,
@PandorraResearch Team

AGG BOND MARKET ETF GOES 'ONE HUNDRED DEGREE' FEVER THRESHOLDThe iShares Core U.S. Aggregate Bond ETF (AGG) is a broad-based U.S. bond market ETF that provides exposure to investment-grade government and corporate bonds. Examining AGG from technical and fundamental perspectives, especially with anticipated Federal Reserve rate cuts in late 2025, highlights several key insights for investors.
Technical Perspective
Recent technical analyses of AGG presented a mixed picture:
Until now, some indicators, like the short-term exponential and simple moving averages (EMAs/SMA), have signaled Buy positions. However, the long-term 200-week moving averages is generally under current prices, highliting medium-to-long-term support and generating 'Buy' signals.
Over the past several weeks, technical sentiment overall was characterized as neutral to cautious, with short bursts of bullish momentum but persistent underlying resistance.
Upcoming Interest Rate cut event is largely reflecting broader market uncertainty about the timing and magnitude of rate cuts, while AGG jumped above $100 per share in solid manner.
Fundamental Perspective
Fundamentally, AGG's outlook is heavily tied to macroeconomic factors:
With “sticky” inflation and persistent fiscal imbalances, as well as slowing U.S. economic momentum, fixed income portfolios have become more focused on income and carry rather than price appreciation.
The “belly” of the yield curve (3-7 year maturities), which makes up a significant portion of AGG, is preferred by asset managers. This segment provides attractive all-in yield while limiting duration risk, especially valuable if rate normalization is gradual.
Investment-grade credit within AGG is seen as reasonably robust, particularly in BBB-rated bonds, although tight credit spreads limit further upside from spread compression. Income generation remains the primary draw in this environment.
Recent year-to-date returns for the U.S. Aggregate Bond Total Return Index have been moderately positive (nearly 6% in 2025), supported by economic resilience and declining inflation.
Impact of Expected Rate Cuts
Anticipated rate cuts by the Federal Reserve—potentially beginning as soon as September 2025—carry substantial implications:
Lower policy rates typically push up bond prices and benefit bond ETFs like AGG directly. Yet, in 2025, bond ETF prices have sometimes initially dropped even after rate cut announcements, reflecting complex market dynamics and residual uncertainty.
As cash yields fall, the relative attractiveness of holding diversified bond funds improves, especially for those seeking steady income with less volatility than equities. The risk/return profile for AGG should strengthen as the Fed moves into an easing cycle, with the possibility for modest price appreciation and improved total returns.
However, forward-looking market positioning, tight spreads, and gradual adjustments may dampen immediate “windfall” gains—even as the overall environment turns incrementally more favorable for intermediate-term bond allocations.
In summary, AGG offers a balanced, income-oriented fixed income allocation that stands to benefit cautiously from the forthcoming rate-cutting cycle, with technical and fundamental perspectives both supporting a measured, rather than aggressive, overweight in the coming months.
The main technical graph for AMEX:AGG ('Total Return' mode) indicates on growth' accelerating, since 'one hundred' fever threshold has been successfully passed.

PALANTIR GOES READY TO 'WHAKA WHAKA' BEARS CORNER╭∩╮( •̀_•́ )╭∩╮Palantir Technologies’ recent stock decline in August 2025 stems from a combination of technical and fundamental factors. After an explosive rally in the first half of the year - driven by strong enthusiasm for AI, record financial results, and a wave of commercial and government contracts - the stock entered a pronounced six-day losing streak, dropping over 17%, with more than $73 billion of market capitalization wiped out from its recent peak.
Fundamental Reasons
Valuation Concerns. Palantir’s valuation soared to extreme levels, with forward price-to-earnings (P/E) ratios between 193 and 252, dwarfing those of other tech giants like Microsoft and Apple (whose ratios hover around 30). This staggering valuation reflects enormous investor expectations for future growth, creating vulnerability to profit-taking and re-rating if growth moderates or disappoints.
Short Seller Critiques. Citron Research’s Andrew Left released a report arguing Palantir is “detached from fundamentals,” suggesting its shares should be valued at $40, compared to recent levels around $158–$190, using price-to-revenue metrics aligned with OpenAI’s $500 billion valuation. His public criticism catalyzed bearish sentiment and led to a surge in short-selling profits.
Competitive Landscape. Palantir’s government segment, historically its core business, is facing intensified competition. New Department of Defense contracts awarded to OpenAI, Anthropic, Google, and xAI signal that the company’s dominance over federal AI budgets may be waning. Growth outside the US has also slowed due to regulatory and competitive hurdles.
Earnings Growth but Slowing Trajectory. Palantir delivered its first $1 billion revenue quarter and continues to post robust year-over-year growth. However, concerns remain about the sustainability of this pace. Consensus forecasts now project more moderated annual growth rates, and Wall Street’s consensus outlook shifted from “Buy” to “Hold,” with a bearish 12-month price target of $107—significantly below recent prices.
Technical Reasons
Overbought Conditions. After rallying 100%+ year-to-date, technical indicators such as the 14-day Relative Strength Index approached “overbought” territory (RSI ~62), suggesting the risk of a near-term pullback. Furthermore, shrinking volumes on continued price increases indicated waning bullish momentum, with buyers becoming more cautious and profit-taking accelerating.
Correction from Record Highs. The rapid run-up led Palantir into a vulnerable technical posture; corrections often follow periods of exuberant price action, particularly when coupled with weak underlying volume and stretched technical metrics. Recent technical analysis flagged downside risk if momentum falters and results disappoint relative to lofty expectations.
Outlook and Further Price Action.
Mid-term, Palantir’s trajectory hinges on whether it can continue to justify and deliver against the premium embedded in its valuation. Sustained AI adoption and successful expansion in commercial sectors could underpin further long-term growth. However, any slowdown in earnings growth, intensifying competition in government contracts, or a sharp marketwide rotation out of high-multiple tech stocks could drive further downside.
Short-term, the combination of elevated valuation, technical overextension, and negative headlines from prominent short sellers has increased the volatility.
In comparative terms, despite of recent nearly 20 percent decline from all the history peak, in nowadays Palantir' stock demonstates the best of the best year-to-date +104.96% performance in 2025 over the all S&P500 and Nasdaq-100 indices components. Palantir' stock returns over the past 5 years prevail +1000 per cent.
Among all S&P500 and Nasdaq-100 indices components, only three another great stocks were able to do the same over the past 5 years - MicroStrategy (+2204%), Supermicro (+1489%) and Nvidia Corporation (+1258%).
The main technical graph inndicates on major support in Palantir stocks near $160 per share, with further possible price action in the second half of the year 2025.
--
Best wishes,
@PandorraResearch Team

GOLD GOES CLEARIFY THE NEBULA AS 'SCORCHING-RED' SEPTEMBER NEARSGold’s recent stagnation stems from a confluence of fundamental and technical factors, reflecting both macroeconomic uncertainty and price action signals that have defined the gold market through 2025. The outlook remains nuanced, balancing upside catalysts with evident resistance and correction risks.
Fundamental Reasons
Federal Reserve and Interest Rates. With markets closely watching the U.S. Federal Reserve, current gold prices reflect anticipation of imminent rate cuts. Speculation that the Fed may soon pivot to a dovish stance has reinforced support, but the pause in tightening also creates hesitation, keeping prices range-bound.
Uncertainty and Safe Haven Demand. The primary fundamental support for gold in 2025 has been record global economic and policy uncertainty—comparable to pandemic-era highs—driven by trade policy threats, tariffs, and geopolitical risks. This uncertainty spiked gold to highs near $3,500 in April 2025, but as those risks became less acute, momentum faded (so far).
Inflation and Macro Risks. Sticky inflation, concerns over U.S. debt, and shifting global central bank reserves have all added underlying support, but none have resulted in a sustained breakout beyond historical resistance levels.
Technical Aspects
Key Trading Range. After peaking at $3,500/oz, gold has traded in a defined sideways channel ($3,180–$3,400/oz), respecting Fibonacci retracement levels and signaling a period of consolidation.
Support and Resistance. Current strong support lies at $3,319–$3,346/oz, and resistance around $3,410–$3,450/oz. Technical tops at these levels, coupled with declining MACD readings and steady On-Balance Volume, reinforce the near-term stagnation bias.
Volume and Trend Signals. The lack of significant volume breakouts, coupled with price clustering and flat momentum measures, further suggests sideways action rather than a new trend.
Further Price Action Outlook
Most analysts expect gold to remain in its established range unless a decisive catalyst appears. If the Fed formally announces rate cuts or the dollar weakens, gold could break above $3,450 and target new highs beyond $3,600 into 2026.
Overall, the market’s stagnation reflects both diminishing bullish momentum after a multi-year rally and strong but not overwhelming support from global macro uncertainty. The next directional move will likely depend on shifts in Fed communication, real yields, and the trajectory of global risk appetites.
Risk appetite after post-April crater' recovery may cool down shortly, on US and global stock markets. The September seasonality for the S&P 500 index refers to the historical tendency for the stock market to weaken during September. Over nearly a century, September has been the worst-performing month on average for the S&P 500, often showing negative returns. This phenomenon, sometimes called the "September Effect," is considered a market anomaly as it challenges the efficient markets hypothesis.
In brief, S&P 500 index September's average performance is the weakest compared to all other calendar months, that could lead to surging demand for safe-heaven assets like Gold.
--
Best wishes,
@PandorraResearch Team

PALANTIR GOES 'BOMBASTIC', DETHRONES JUGGER BITCOIN SUPERIORITYIt's gone less than a year or so since Palantir stock has joined on Friday, September 20, 2024 Stock Top Club, also known as S&P 500 stock index SPX .
Palantir was one of the strongest contenders for inclusion in the broad market S&P500 Index.
This inclusion, as well as Dell (DELL), came after tech companies Super Micro (SMCI) and Crowdstrike (CRWD) also joined the index earlier in the year 2024.
Since that, Palantir stock became the best (i.e. #1) S&P500 index performer the year 2024 and even in nowadays this Jugger remains 'The Best of The Best' over the whole S&P 500 index, with current +127% YTD return in 2025 (and +697% over the past 12 months), being highlighted at 173.29 USD per share - the new all the history peak reached last Wednesday, August 05, 2025 at regular session close.
What is most important also, nor Federal Reserve (The US Central Bank) hawkish projections on monetary policy in 2025, nor bearish were not able to stop the only game in the city, or even make a pause on Palantir leadership.
Since Palantir stock is rallying, the stalkers remain decently far away, swallowing the galactic dust of Palantir shares.
Judge for yourself.
All the nearest pursuers in 2025 are still under 100% YTD return while Bitcoin BITSTAMP:BTCUSD is traded with modest +21% YTD return in 2025.
What is most important also, Palantir stock was able to outperform S&P500 index within 12 (twelve) straight month in a row.
In human words that means, Palantir stock monthly returns (every single month from June 2024 to May 2025) were better against broad market index.
What is Behind this?
On August 4, 2025 Palantir Technologies has announced financial results for the second quarter ended June 30, 2025.
Palantir reported revenue ahead of Wall Street’s expectations in Q2 CY2025, with sales up 48% year on year to $1.00 billion. On top of that, next quarter’s revenue guidance ($1.09 billion at the midpoint) was surprisingly good and 10.5% above what analysts were expecting. Its non-GAAP profit of $0.16 per share was 15.6% above analysts’ consensus estimates.
“The growth rate of our business has accelerated radically, after years of investment on our part and derision by some. The skeptics are admittedly fewer now, having been defanged and bent into a kind of submission. Yet we see no reason to pause, to relent, here.
It has been a steep and upward climb—an ascent that is a reflection of the remarkable confluence of the arrival of language models, the chips necessary to power them, and our software infrastructure, one that allows organizations to tether the power of artificial intelligence to objects and relationships in the real world,” said Alexander C. Karp, Co-Founder and Chief Executive Officer of Palantir Technologies Inc.
Palantir stock Alpha
What is Alpha?
Alpha (a) is a term used in investing to describe an investment's ability to beat (outperform) the market, or its “edge.” Alpha is thus also often referred to as excess return or the abnormal rate of return in relation to a benchmark, or any other asset (even against simple sitting in a cash) when adjusted for risk.
The main graph represents a comparison across Bitcoin and Palantir stocks. Since Palantir outperforms BTC and accelerate right now, so why isn't to continue the play, by staying in a long with Palantir, and finally dethrone "the new oranges" respectively.
PALANTIR PLUS GOLD — TWO IS A PAIR"Two is a pair" means that the number two represents a set of two identical or closely related items that are used together or considered a unit. For example, a pair of socks, a pair of shoes, or a pair of gloves. It can also refer to two people, animals, or things that are grouped together.
Here's a more detailed breakdown:
Definition:
A pair is a set of two things that are alike, matched, or intended to be used together.
Examples:
"A pair of socks" - two socks designed to be worn on the feet.
"A pair of scissors" - two blades joined together.
"A pair of lovers" - two people romantically involved.
Singular/Plural:
The word "pair" can be singular or plural, depending on how it's used. For example: "This pair is comfortable" (singular) and "These two pairs are comfortable" (plural).
Relationship:
While "pair" often implies a strong connection or matching nature, it can also be used for things that are simply grouped together.
For example, like Palantir NASDAQ:PLTR & Gold AMEX:GLD that match each other, for 18 straight months in a row. 💖
--
Best wishes,
@PandorraResearch Team