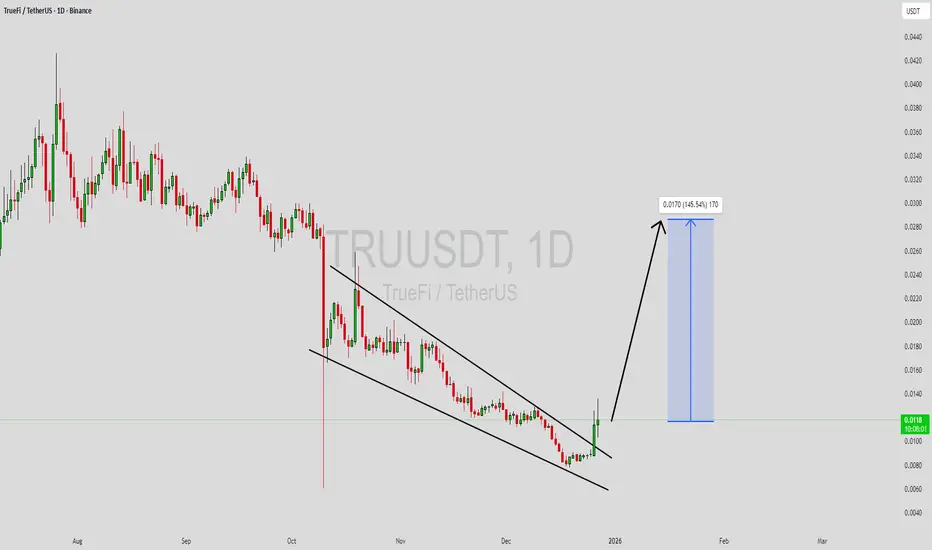
#TRU/USDT Forming Falling Wedge ?#TRU
The price is moving in a descending channel on the 1-hour timeframe. It has reached the lower boundary and is heading towards breaking above it, with a retest of the upper boundary expected.
We have a downtrend on the RSI indicator, which has reached near the lower boundary, and an upward rebound is expected.
There is a key support zone in green at 0.0100. The price has bounced from this level multiple times and is expected to bounce again.
We have a trend towards consolidation above the 100-period moving average, as we are moving close to it, which supports the upward movement.
Entry price: 0.0105
First target: 0.0109
Second target: 0.0116
Third target: 0.0123
Don't forget a simple principle: money management.
Place your stop-loss below the support zone in green.
For any questions, please leave a comment.
Thank you.
TRUUSDT

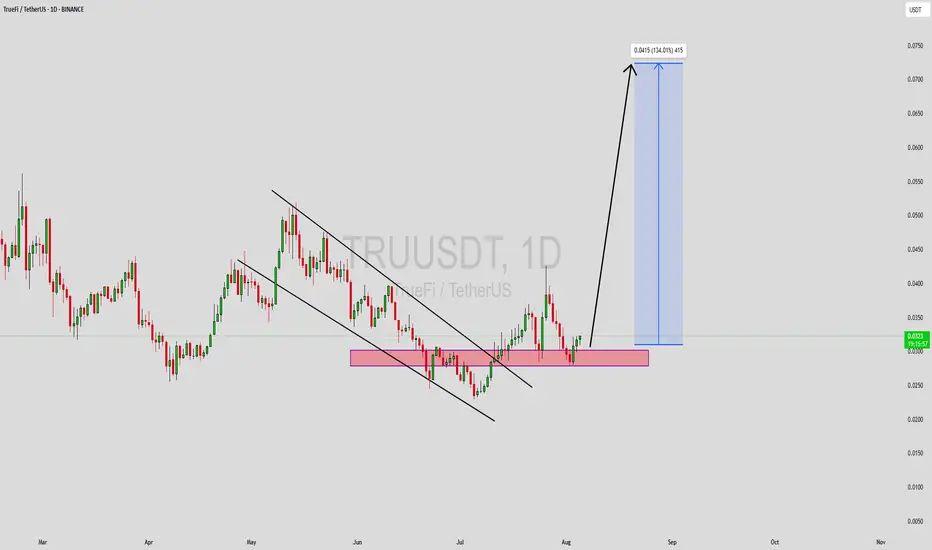
TRUUSDT Forming Falling WedgeTRUUSDT is forming a clear falling wedge pattern, a classic bullish reversal signal that often indicates an upcoming breakout. The price has been consolidating within a narrowing range, suggesting that selling pressure is weakening while buyers are beginning to regain control. With consistent volume confirming accumulation at lower levels, the setup hints at a potential bullish breakout soon. The projected move could lead to an impressive gain of around 90% to 100% once the price breaks above the wedge resistance.
This falling wedge pattern is typically seen at the end of downtrends or corrective phases, and it represents a potential shift in market sentiment from bearish to bullish. Traders closely watching TRUUSDT are noting the strengthening momentum as it nears a breakout zone. The good trading volume adds confidence to this pattern, showing that market participants are positioning early in anticipation of a reversal.
Investors’ growing interest in TRUUSDT reflects rising confidence in the project’s long-term fundamentals and current technical strength. If the breakout confirms with sustained volume, this could mark the start of a fresh bullish leg. Traders might find this a valuable setup for medium-term gains, especially as the wedge pattern completes and buying momentum accelerates.
✅ Show your support by hitting the like button and
✅ Leaving a comment below! (What is your opinion about this Coin?)
Your feedback and engagement keep me inspired to share more insightful market analysis with you!
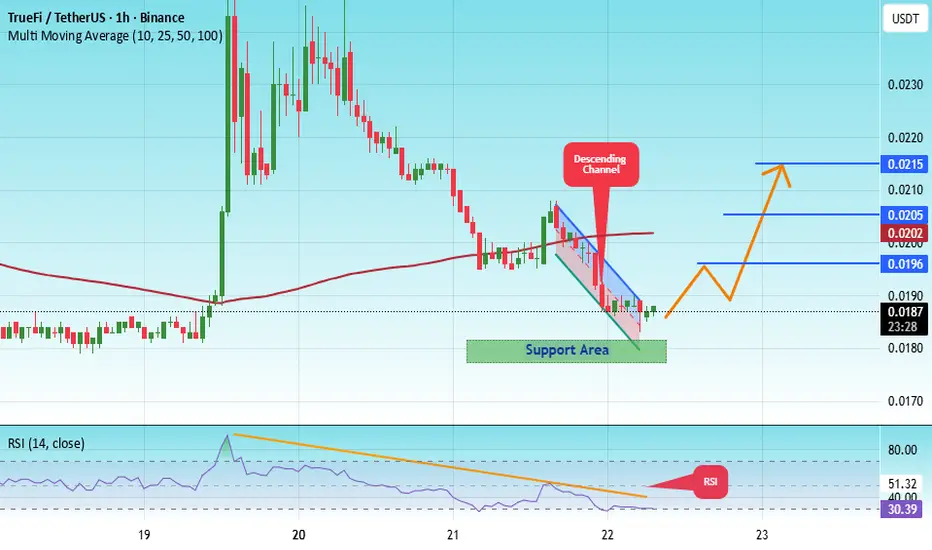
#TRU/USDT Forming Falling Wedge ?#TRU
The price is moving within a descending channel on the 1-hour frame, adhering well to it, and is heading for a strong breakout and retest.
We have a bearish trend on the RSI indicator that is about to be broken and retested, which supports the upward breakout.
There is a major support area in green at 0.0178, representing a strong support point.
We are heading for consolidation above the 100 moving average.
Entry price: 0.0186
First target: 0.0196
Second target: 0.0205
Third target: 0.0215
Don't forget a simple matter: capital management.
When you reach the first target, save some money and then change your stop-loss order to an entry order.
For inquiries, please leave a comment.
Thank you.
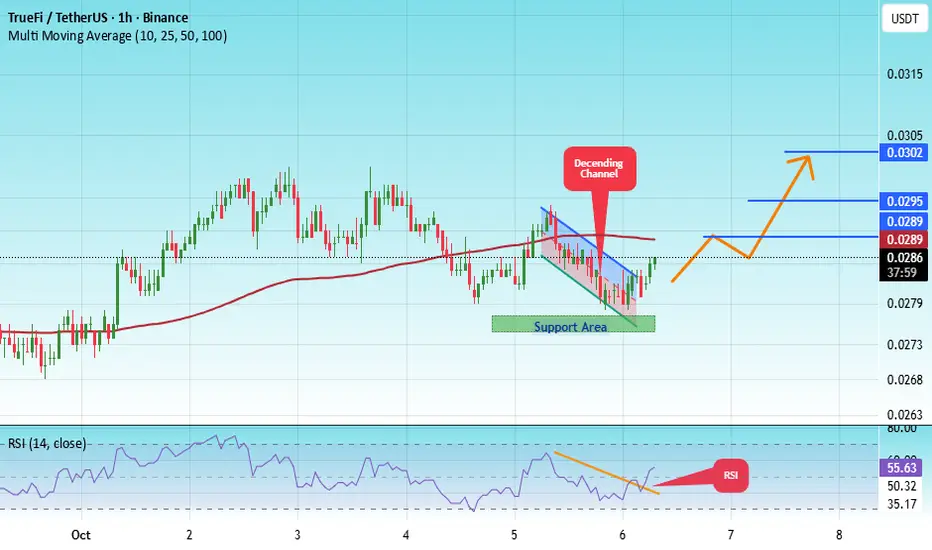
#TRU/USDT Forming Falling Wedge ? #TRU
The price is moving within a descending channel on the 1-hour frame, adhering well to it, and is heading for a strong breakout and retest.
We have a bearish trend on the RSI indicator that is about to be broken and retested, which supports the upward breakout.
There is a major support area in green at 0.0276, representing a strong support point.
We are heading for consolidation above the 100 moving average.
Entry price: 0.0285
First target: 0.0290
Second target: 0.0295
Third target: 0.0302
Don't forget a simple matter: capital management.
When you reach the first target, save some money and then change your stop-loss order to an entry order.
For inquiries, please leave a comment.
Thank you.
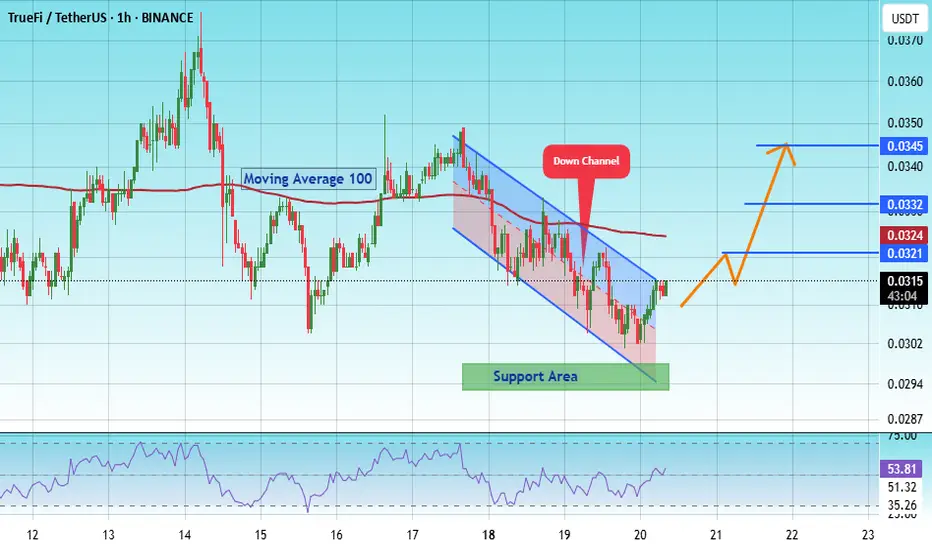
#TRU/USDT Forming Falling Wedge ? #TRU
The price is moving within an ascending channel on the 1-hour frame, adhering well to it, and is on track to break it strongly upwards and retest it.
We have support from the lower boundary of the ascending channel, at 0.0295.
We have a downtrend on the RSI indicator that is about to break and retest, supporting the upside.
There is a major support area (in green) at 0.0298, which represents a strong basis for the upside.
Don't forget a simple thing: ease and capital.
When you reach the first target, save some money and then change your stop-loss order to an entry order.
For inquiries, please leave a comment.
We have a trend to hold above the 100 Moving Average.
Entry price: 0.0314.
First target: 0.0321.
Second target: 0.0332.
Third target: 0.0345.
Don't forget a simple thing: ease and capital.
When you reach your first target, save some money and then change your stop-loss order to an entry order.
For inquiries, please leave a comment.
Thank you.
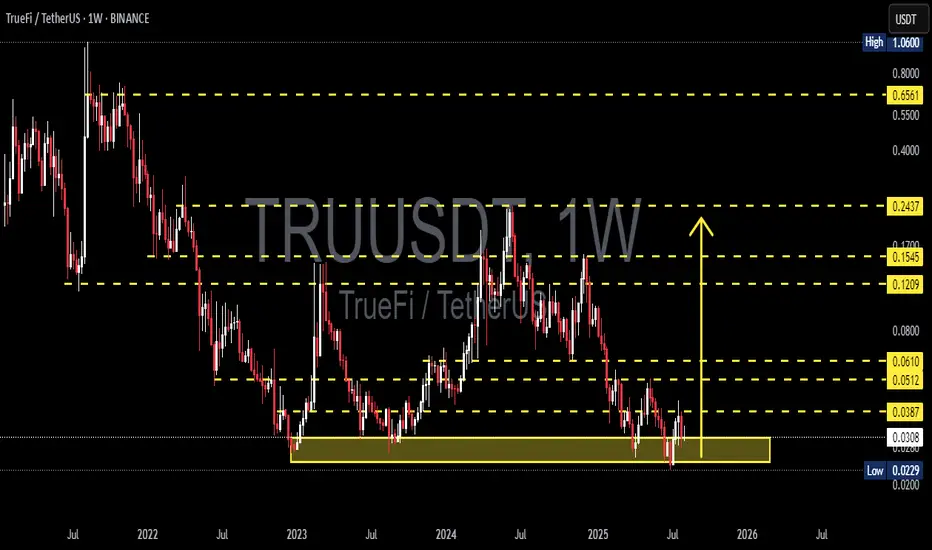
TRU/USDT Weekly – On the Verge of a Reversal or Breakdown?📌 Overview:
TRU/USDT is currently trading within a key long-term demand zone between $0.0229–$0.0307 — an area that has consistently acted as a strong bounce level since early 2023. Now that this zone is being tested again, the outcome could define the next major move for TrueFi.
---
🔍 Market Structure & Pattern:
The pair has been moving sideways in a year-long accumulation range, hinting at a potential accumulation phase by smart money.
There's a possibility of a triple bottom formation, a classic reversal signal, should price break above resistance with momentum.
Although the overall trend remains bearish, selling pressure is weakening, suggesting a possible trend transition phase.
---
📈 Bullish Scenario (Reversal Potential):
If price holds the support zone and confirms a bullish weekly candle:
Upside Targets:
🔹 $0.0387 (First breakout level)
🔹 $0.0512 – $0.0610 (Previous distribution range)
🔹 $0.1209 – $0.1545 (Mid-term trend shift target)
Potential catalysts: strong breakout volume, improving market sentiment, and weakening BTC dominance.
---
📉 Bearish Scenario (Breakdown Risk):
If price fails to hold above $0.0229 and closes below on the weekly chart:
Price could fall further toward the psychological level around $0.0200 or even lower.
This would confirm a new lower low, continuing the broader bearish trend and possibly entering a capitulation phase.
---
🎯 Key Levels to Watch:
Level Significance
$0.0229 – $0.0307 Major demand zone (historical support)
$0.0387 Initial resistance / bullish trigger
$0.0512 & $0.0610 Previous supply zones
$0.1209 & $0.1545 Mid-term reversal targets
$0.2437 Long-term target if uptrend confirms
---
🔄 Conclusion:
TRU/USDT is at a make-or-break point. Bulls and bears are clashing at this critical support. Will this be the start of a long-awaited reversal, or will we see a deeper breakdown?
The coming weekly candles will be crucial. Smart traders will wait for clear confirmation — not just reaction.
---
🧲 Trading Strategy Ideas:
Conservative Bulls: Wait for a weekly breakout above $0.0387 with volume confirmation.
Aggressive Traders: Consider entry at support with tight stop-loss below $0.0225, aiming for $0.0512 short-term.
Bearish Bias: Short after confirmed weekly close below support.
#TRUUSDT #TrueFi #CryptoReversal #AltcoinAnalysis #SupportZone #TripleBottom #BreakoutSetup #WeeklyChart
TRUUSDT Forming Falling WedgeTRUUSDT is currently exhibiting a Falling Wedge Pattern, a well-known bullish formation that often signals the end of a downtrend and the beginning of a strong upward move. This pattern is characterized by descending trendlines that converge, showing reduced selling pressure and a potential shift in momentum. As TRU approaches the apex of this wedge with gradually narrowing price action, traders are closely watching for a breakout to the upside—typically a powerful signal that price could rally sharply from current levels.
Volume remains healthy, which is a crucial factor when validating any breakout from a wedge formation. An uptick in volume upon breakout would serve as strong confirmation of bullish intent and increase the probability of TRUUSDT reaching its projected target. Historical breakouts from similar patterns have shown explosive gains, and in this case, the setup suggests a potential gain of 90% to 100% or more, especially if supported by broader market strength.
Investor interest is steadily increasing in the TRU ecosystem, reflecting growing confidence in the project’s utility and future developments. As the token gains traction and technical indicators align in its favor, momentum traders and swing traders are identifying this as a high-potential opportunity. The structure of this wedge presents a low-risk, high-reward setup with clearly defined support and resistance levels.
In summary, TRUUSDT’s falling wedge breakout scenario could be one of the more promising bullish setups currently unfolding. With strong volume dynamics, positive sentiment, and a clear pattern in play, it’s an excellent chart to keep on your radar in the coming days.
✅ Show your support by hitting the like button and
✅ Leaving a comment below! (What is You opinion about this Coin)
Your feedback and engagement keep me inspired to share more insightful market analysis with you!
#TRU/USDT Low Risk vs High Rewards#TRU
The price is moving within a descending channel on the 1-hour frame and is expected to break and continue upward.
We have a trend to stabilize above the 100 moving average once again.
We have a downtrend on the RSI indicator that supports the upward break.
We have a support area at the lower limit of the channel at 0.0285, acting as strong support from which the price can rebound.
We have a major support area in green that pushed the price upward at 0.0280.
Entry price: 0.0300
First target: 0.0314
Second target: 0.0328
Third target: 0.0350
To manage risk, don't forget stop loss and capital management.
When you reach the first target, save some profits and then change the stop order to an entry order.
For inquiries, please comment.
Thank you.
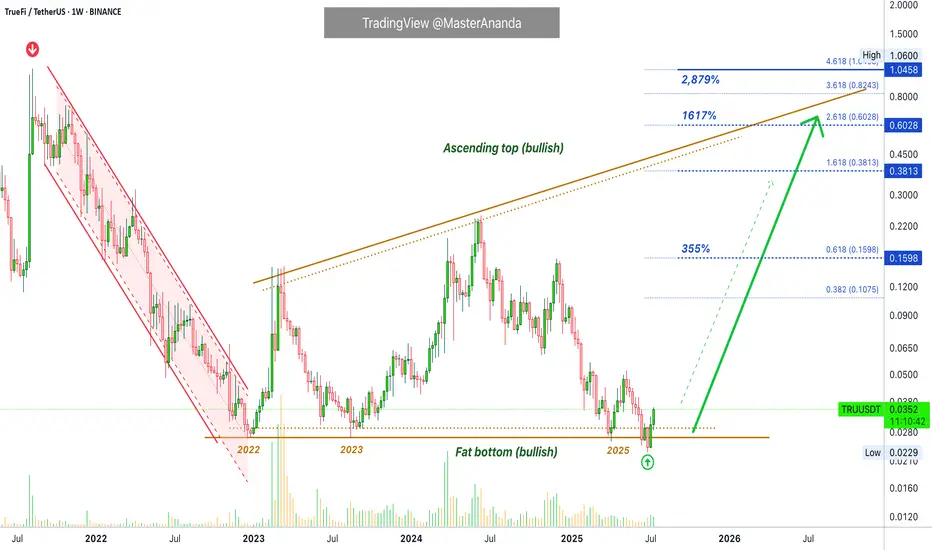
TrueFi · Bitcoin vs the Altcoins · Low Risk vs High RewardsTrueFi is trading at bottom prices. Notice the big difference between this pair and the ones that are trading high, near resistance or at a new all-time high. This is the difference I want to point out to new buyers.
If you are entering the market just now, you should be considering pairs like this one rather than the ones that are already pretty advanced. This is because the ones trading low/near support have more room available for growth, higher profits potential and very little risk. When prices are trading near the bottom, there isn't much room to go lower. When prices are trading high, even with marketwide bullish action, a correction can develop anytime.
We look for pairs like this one to buy and hold.
The second consideration is related to growth potential. While Bitcoin is awesome; Bitcoin is crypto; Bitcoin is great and is here to stay, it is already worth trillions of dollars. If everything goes amazing for Bitcoin, we might enjoy an additional 100% growth before the cycle ends. On an altcoin, in comparison, we can enjoy 1,000%, 2,000%, 3,000%, 5,000% or more. So you need to choose wisely.
A whale can easily choose Bitcoin because of liquidity issues, accessibility, security, stability, accounting, long-term performance, etc. A tiny fish is better off with the altcoins market, they have more room for growth.
Technical analysis
The red channel reveals a downtrend, the previous bear-market. The flat bottom in the following years reveals a consolidation period, long-term. Not a downtrend but creating a base. From the bottom we grow.
TRUUSDT is no longer bearish, moving down, instead it accumulated for years and now that this accumulation phase is over we are ready for massive growth.
We witnessed first a downtrend, then sideways (consolidation) and now comes an uptrend. These are the only three ways in which the market can move. Down—neutral—up.
The logical next step after a downtrend is always a sort of transition period, after this transition the uptrend starts.
We will have an uptrend now, this is what we call a "bull market." Higher highs and higher lows."
If you enjoy the content, you can always follow for more. It is easy and free and you get to receive updates every time I publish a new article.
Thanks a lot for your continued support.
Namaste.
TrueFi (TRU)#TRU
The price is moving within a descending channel on the 1-hour frame and is expected to break and continue upward.
We have a trend to stabilize above the 100 moving average once again.
We have a downtrend on the RSI indicator that supports the upward break.
We have a support area at the lower limit of the channel at 0.0270, acting as strong support from which the price can rebound.
We have a major support area in green that pushed the price upward at 0.0260.
Entry price: 0.0275
First target: 0.0281
Second target: 0.0290
Third target: 0.0301
To manage risk, don't forget stop loss and capital management.
When you reach the first target, save some profits and then change the stop order to an entry order.
For inquiries, please comment.
Thank you.


Truusdt truefi buy setupA clean setup, valid until final tp is not hit. Wick doesn't matter if any news day, closing matters.

TRUUSDT 1W AnalysisTRU ~ 1W Analysis
#TRU This trade is very high risk, this is the lowest support you might consider to start buying back with a short term target of at least 20%+.

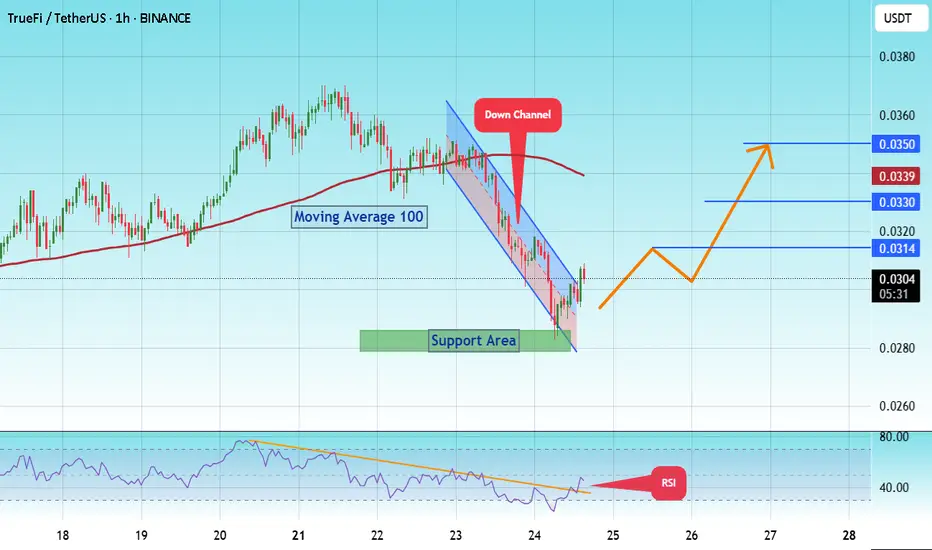
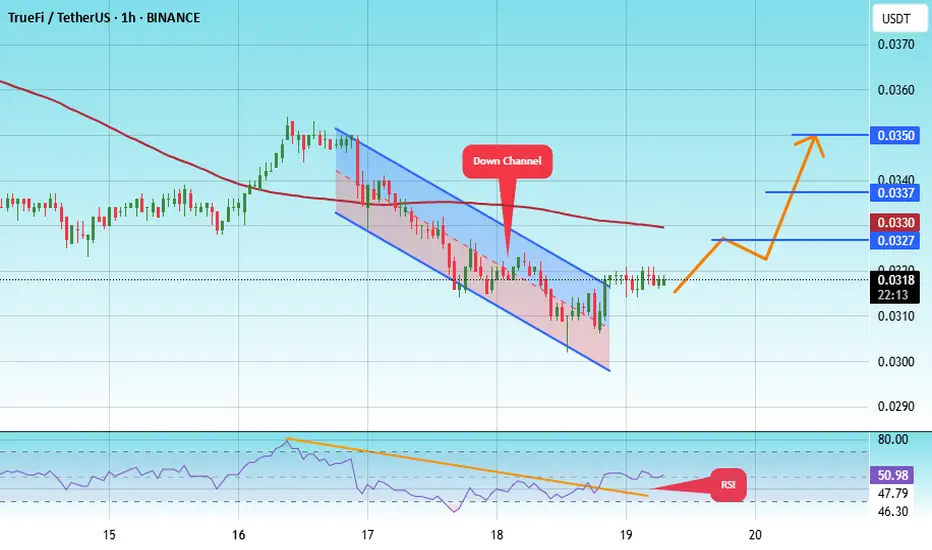
#TRU/USDT#TRU
The price is moving within a descending channel on the 1-hour frame, adhering well to it, and is heading towards a strong breakout and retest.
We are experiencing a rebound from the lower boundary of the descending channel. This support is at 0.0300.
We are experiencing a downtrend on the RSI indicator, which is about to break and retest, supporting the upward trend.
We are in a trend of consolidation above the 100 Moving Average.
Entry price: 0.0315
First target: 0.0327
Second target: 0.0337
Third target: 0.0350
$PNUT/USDT Breakout Trade Setup$PNUT / USDT - Breakout Trade Setup.
Entry: $0.2963 - $0.3002
Stop Loss: $0.2682
Targets: $0.3603 / $0.4305 / $0.4891
Breakout & retest of descending trendline
60 %+ upside potential
DYOR | NFA

#TRU/USDT#TRU
The price is moving within a descending channel on the 1-hour frame, adhering well to it, and is heading towards a strong breakout and retest.
We are experiencing a rebound from the lower boundary of the descending channel.
This support is at 0.0375.
We are experiencing a downtrend on the RSI indicator, which is about to break and retest, supporting the upward trend.
We are heading towards stability above the 100 Moving Average.
Entry price: 0.0378
First target: 0.0387
Second target: 0.0395
Third target: 0.0403

Tru USDT Swing TradeAs much as we doesn't closes below 0.038 first and confirmed tp is 0.060$ . Wait for the entry and start accumulation of true between 0.040-0.035 set tp 0.060$

TRUUSDT 1D Analysis TRU ~ 1D Analysis
#TRU Buy after successfully breaking the $0.052 resistance line with a short-term target of at least 10%+.

TRUUSDT 1WTRU ~ 1W Analysis
#TRU Key support that must be maintained for now. Loss of this support, will suppress lower prices.

TRUUSDT 1WTRU ~ 1W Analysis
#TRU Buy gradually from here if you still have a Conviction on this coin with a short -term target of at least 20%+.

TRUUSDT 1WTRU ~ 1W Analysis
#TRU Support blocks that you might be able to consider to start buying back from here with a short -term target of at least 20%+.

#TRU/USDT#TRU
The price is moving in a descending channel on the 1-hour frame and is adhering to it well and is heading to break it strongly upwards and retest it
We have a bounce from the lower limit of the descending channel, this support is at a price of 0.0350
We have a downtrend on the RSI indicator that is about to break and retest, which supports the rise
We have a trend to stabilize above the moving average 100
Entry price 0.0438
First target 0.0511
Second target 0.0553
Third target 00630

TrueFi (TRU)Comprehensive Analysis of TRU/USDT
Overview
TrueFi (TRU) is an innovative project in the decentralized lending space (DeFi Lending) that enables collateral-free lending. The TRU coin is among the low-market-cap cryptocurrencies, and due to its low liquidity and high volatility 🚨, it falls into the category of high-risk trades. For investing or trading this coin, risk management and attention to trading volume are essential.
Current Market Situation
Downtrend Channel: 📉
TRU’s price is currently in a downtrend channel and is heading towards the bottom of the channel.
Weekly Support Zone:
The range (0.0605 - 0.0662) acts as a key support level. Although there is a possibility of a drop below this range, a quick rebound (Fake Breakout) from this zone could signal a safe entry. 💡
Trading Volume: 📊
If the volume increases when the price bounces from the channel’s bottom, the likelihood of price rising to the top of the channel strengthens. Traders should pay close attention to volume near the support range.
RSI: 📈
RSI Support Zone:
The range (41.24 - 44.19) could prevent further decline. A breakdown of this zone could lead to a deeper drop.
Breaking the 50 RSI Zone:
A move above this level could indicate a strong upward move, providing a good entry opportunity. 🚀
Upcoming Scenarios
Bullish Scenario: 🌟
Bounce from the Bottom of the Downtrend Channel:
If the price stabilizes in the support range (0.0605 - 0.0662) and trading volume increases, an upward move to the top of the channel becomes likely.
Breakout of the Downtrend Channel’s Top:
If the top of the downtrend channel is broken, the price could reach the target range (0.2258 - 0.2702). Given TRU's low market cap, heavy liquidity inflow could push the price beyond this target. 📌
Bearish Scenario: ⚠️
Loss of Weekly Support:
If the range (0.0605 - 0.0662) is lost, the next support is at 0.0400.
Traders should set appropriate stop-loss orders to mitigate risk. 🛑
Weakness in RSI:
A breakdown of the support zone (41.24 - 44.19) in the RSI could signal a continuation of the downtrend. 🔻
Range-Bound Scenario: ⏸️
If the price remains within the weekly support zone and trading volume decreases, a short-term range-bound movement may develop. 🔄
Stop-Loss:
For long trades, set the stop-loss below the 0.0600 range. ❌
Trade Volume:
Given the high risk, it is recommended to allocate only a small percentage of capital to this trade. 💰
Summary
TRU, considering its technical setup and position in the downtrend channel, can present promising trading opportunities. However, due to its low market cap and high volatility, risk management is crucial. ⚡
Recommendation: Always review fundamental factors and project-related news before making any decisions. 📰
⚖️ Warning: This analysis is purely technical and should not be considered financial or investment advice. Always do your own research and practice risk management. Good luck! 🚀
