Stock Market Forecast | BTC TSLA NVDA AAPL AMZN META MSFTStock Market Forecast | CRYPTOCAP:BTC SP:SPX NASDAQ:NDX CME_MINI:ES1!
Mag 7 | TSLA NVDA AAPL AMZN META MSFT GOOGL
Tesla Motors (TSLA)

Tesla Reversal Signal Triggered at the 200 SMA!TSLA 🚗 Bullish Pullback Playbook — Smart Layered Entry Setup!
📈 Asset:
TSLA — Tesla Inc. (NASDAQ)
Swing Trade Playbook | Trend-Continuation Setup
🧠 Market Thesis
TSLA shows a bullish pullback into the 200-Day Simple Moving Average, a level historically respected by trend-followers. The latest Heikin-Ashi Doji Reversal signals buyers regaining momentum ⚡ — suggesting the pullback is stabilizing and demand is stepping back in.
This combination of trend support + reversal confirmation forms the core of this structured swing setup.
🎯 Plan Overview
A clean bullish continuation strategy using a refined layered entry method (professionally framed as “scaled limit entries”). This maintains your signature thief-style energy, but aligned with TradingView rules and presentation standards. 😎
🟢 Entry Plan (Layered / Scaled Limit Orders)
Using a scaling approach allows better average pricing during volatility.
Proposed buy-limit layers:
Buy Limit 1 → $420.00
Buy Limit 2 → $410.00
Buy Limit 3 → $400.00
👉 Traders may increase or reduce the number of layers based on risk tolerance and personal strategy.
🔻 Stop-Loss (Risk Control)
A defensive stop-loss is placed near $380.00, below recent liquidity pockets and under the 200 SMA structure.
⚠️ This level is optional — traders should select their own SL based on personal risk management.
🎯 Take-Profit Zone
Target area sits around $470.00, where:
Major historical resistance awaits
Overbought conditions often develop
High-volume sellers tend to re-enter
This zone is treated as a profit-taking escape point, but traders can exit based on their own judgment.
📡 Related Markets to Watch (Correlation Insight)
Keeping the global view helps improve trade confidence:
NASDAQ:QQQ — High correlation with mega-cap tech, TSLA often follows Nasdaq momentum.
NASDAQ:NDX — Strong tech index correlation; strength supports TSLA continuation.
SP:SPX — Broad-market risk sentiment gauge.
NASDAQ:NVDA / NASDAQ:AMD — Momentum flow in growth-tech impacts liquidity rotation into TSLA.
AMEX:XLY — Consumer Discretionary ETF (TSLA is a major component).
Key takeaway:
Strong tech-sector momentum + risk-on environment = enhanced TSLA bullish continuation probability 📊⚡
🧰 Notes for the Community
Dear Traders (Thief OG-style Family 😄) —
SL/TP levels shared here are only examples for educational purposes. You’re always free to manage your own positions using your own risk preferences. Trade smart, trade safe, trade stylish. 💼✨
✨ “If you find value in my analysis, a 👍 and 🚀 boost is much appreciated — it helps me share more setups with the community!”
This is a thief-style trading strategy presentation strictly for fun and educational purposes. Not financial advice.
#TSLA #Tesla #SwingTrade #BullishSetup #LayeredEntries #HeikinAshi #200SMA #NASDAQ #MomentumTrading #TechnicalAnalysis #TradingView #RiskManagement #TraderLifestyle #StockMarket

TESLA: Weak Market & Bearish Forecast
Remember that we can not, and should not impose our will on the market but rather listen to its whims and make profit by following it. And thus shall be done today on the TESLA pair which is likely to be pushed down by the bears so we will sell!
Disclosure: I am part of Trade Nation's Influencer program and receive a monthly fee for using their TradingView charts in my analysis.
❤️ Please, support our work with like & comment! ❤️

Tesla $TSLATesla (TSLA) has launched new, more affordable "Standard" versions of its Model 3 and Model Y vehicles across Europe, a strategic move aimed at countering a sharp decline in sales within the region. This decline is attributed to intensifying competition from rival automakers and the polarizing political commentary of CEO Elon Musk, which has alienated some potential buyers.
Pricing and Product Details
In key European markets like the Netherlands, Tesla has significantly reduced entry prices. The Model 3 Standard is now listed at 36,990 euros ($43,130), a notable discount compared to the 45,990 euros ($53,620) for the Premium Long Range version. Similarly, the Model Y Standard is priced at 39,990 euros ($46,630), versus 50,990 euros ($59,450) for its Premium Long Range counterpart.
These Standard models are "de-contented," meaning they come with reduced specifications to achieve the lower price point. Key omissions and changes include:
The use of cloth seats instead of premium materials.
The removal of the rear passenger infotainment screen.
The absence of a glass roof.
Simplified interior lighting.
Less powerful electric motors and a decreased driving range per charge.
Both the Model 3 and Model Y Standard variants are available for delivery as soon as December. For context, in the United States, the Model 3 Standard starts at $36,990 and the Model Y Standard at $39,990.
European Sales Slump and Contributing Factors
The introduction of these budget-friendly models comes at a critical time for Tesla in Europe. According to data from the European Automobile Manufacturers' Association (ACEA), Tesla's vehicle registrations—a proxy for sales—plummeted by 48.5% year-over-year in October 2024, to just 6,964 units.
This decline starkly contrasts with the broader market trends. In the same period, total electric vehicle registrations across the European Union, UK, and European Free Trade Association surged by 32.9%, while overall vehicle registrations (across all powertrains) grew by 4.9%.
Analysts point to a confluence of factors behind Tesla's regional struggles:
Fierce Competition: The European EV market is becoming increasingly crowded with compelling offerings from both established European brands and new Chinese entrants.
Economic Headwinds: As CEO Elon Musk has noted, higher interest rates and an uncertain economic outlook are dampening consumer demand for big-ticket items.
CEO Polarization: A significant, albeit harder-to-quantify, factor is the backlash from some European consumers against Musk's public embrace of far-right political figures in the region and his contentious relationship with former U.S. President Donald Trump. This has led to a reputational challenge that may be affecting brand consideration.
Market Reaction and Technical Outlook
Tesla's stock (TSLA) showed little immediate movement on the news of the Standard model launch. However, shares are up approximately 6% for the week, largely buoyed by a recovery in the broader technology sector.
From a technical analysis perspective, the stock has identified two key support zones: the first at the 0.236 Fibonacci level (around $406) and a secondary, stronger support at the 0.382 Fibonacci level (around $354.94). On the upside, two primary take-profit targets have been established at $500 and $520 per share.
A Potential Catalyst: Regulatory Progress on Full Self-Driving
In a potentially positive development, the Netherlands' RDW vehicle authority has established a formal schedule for Tesla to demonstrate its Full Self-Driving (FSD) technology in February 2025. The purpose is to assess whether it meets European regulatory requirements. It is crucial to note that FSD has not yet been approved for use in Europe.
Securing approval from even a single European national regulator would represent a monumental step forward for Tesla. It could serve as a powerful differentiator in the market and a significant catalyst to help reverse the company's sales decline on the continent.
Conclusion
The launch of the Standard Range Model 3 and Model Y is Tesla's direct countermeasure to reignite demand in a critical but challenging European market. While the lower price point may attract more budget-conscious buyers, it remains uncertain whether this move alone can overcome the headwinds of competition, economic conditions, and brand perception. The upcoming FSD demonstration to Dutch regulators in February presents a separate, high-stakes opportunity that could substantially alter Tesla's trajectory in the region in the medium to long term.

Tesla: Do Converging EMAs Signal a Decisive Moment?Hello everyone, looking at Tesla’s current rebound, my first impression is that the market is entering a rather sensitive “trend-defining zone.” After a strong decline since mid-November, TSLA has finally bounced and climbed above the EMA 34, moving straight into a test of the EMA 89 — where the two moving averages are creating a technically noteworthy confluence area.
In the past few weeks, Tesla consistently stayed below both the EMA 34 and EMA 89 , reflecting a clear and somewhat heavy downtrend. But the current recovery has partially changed the picture: buying momentum has returned strongly enough to push price above the EMA 34 and close in on the EMA 89. This is typically the moment when the market reveals its true intention — either continuing upward to confirm a phase shift, or pausing because buying pressure has not yet matured.
Volume has increased but remains relatively modest, indicating that large capital has not truly stepped in. This makes the 435–440 USD resistance zone a significant challenge: Tesla has been rejected here multiple times, and if buying power lacks depth, price may easily turn downward again.
Wishing everyone effective trading and resilience through every market movement!
TSLA — [2D] WEEK 49 TREND REPORT | 12/04/2025TSLA — WEEK 49 TREND REPORT | 12/04/2025
Ticker: NASDAQ:TSLA
Timeframe: 2D
This is a reactive structural classification of TSLA based on the weekly chart as of this timestamp. Price conditions are evaluated as they stand — nothing here is predictive or forward-assumptive.
⸻
1) Current Trend Condition [ Numbers to Watch ]
Current Price @ 447.66$
• Trend Duration : +7 Days (Bullish)
• Trend Reversal Level ( Bearish ): 418.70$
• Trend Reversal Level ( Bearish Confirmation ): 428.42$
• Pullback Support : 413.70$
• Correction Support : 354.94$
⸻
2) Structure Health
• Retracement Phase:
Uptrend (operating above 78.6%)
• Position Status:
Healthy (price above both structural layers)
⸻
3) Temperature :
Warming Phase
⸻
4) Momentum :
Bullish
⸻
Author’s Note
UPWARD STRUCTURAL ALIGNMENT
This mark reflects a point where market behavior supported the continuation of the existing upward direction. It does not imply forecasting or targets — it simply notes where strength became observable within the current trend. Its meaning holds only while price continues to respect the broader structural levels that define the trend.
⸻
Methodology Overview
This classification framework evaluates directional conditions using internal trend-interpretation logic that references price behavior relative to its structural layers. These relationships are used to identify when price movement aligns with the framework’s criteria for directional phases, transition points, or regime shifts. Visual elements or structural labels reflect these internal interpretations, rather than explicit trading signals or preset indicator crossovers. This framework is observational only and does not imply future outcomes.

Tesla - The triangle is still valid!🎀Tesla ( NASDAQ:TSLA ) can still confirm the breakout:
🔎Analysis summary:
Just two months ago, Tesla perfectly broke out of the major ascending triangle pattern. In the meantime we just witnessed a major consolidation at the all time high. Quite likely that Tesla will soon confirm the breakout, launching another parabolic rally from here.
📝Levels to watch:
$400
SwingTraderPhil
SwingTrading.Simplified. | Investing.Simplified. | #LONGTERMVISION

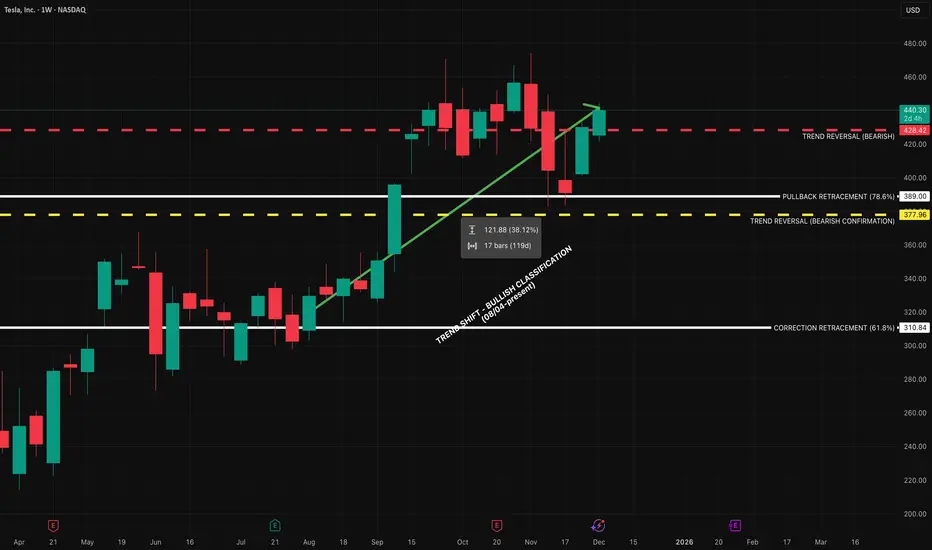
TSLA — WEEK 49 TREND REPORTTSLA — WEEK 49 TREND REPORT
Ticker: NASDAQ:TSLA — 12/03/2025 @ 440.31$
Timeframe: WEEKLY
This is a reactive structural classification of TESLA based on the weekly chart as of this timestamp. Price conditions are evaluated as they stand — nothing here is predictive or forward-assumptive.
⸻
1) Current Trend Condition
• Trend Duration: +17 weeks (Bullish)
• Trend Reversal Level (Bearish): 428.42$
• Trend Reversal Level (Bearish Confirmation): 377.96$
• Pullback Support : 389$
• Correction Support : 310.84$
⸻
2) Structure Health
• Retracement Phase:
Uptrend (operating above 78.6%)
• Position Status:
Healthy (price above both structural layers)
⸻
3) Temperature :
Cooling Phase
⸻
4) Momentum :
Bullish
⸻
5) Market Sentiment (RETAIL TRADER LINE)
Bullish
⸻
Author’s Note
This analysis is fully reactive, not predictive. Market conditions, trend structure, and behavior are classified as they appear in real time. The objective is to identify where directional shifts first occurred, where structural integrity remains intact, and where it would begin to weaken if key levels were breached.
Predictive analysis projects outcomes that do not exist yet. Without price confirmation, prediction is built on baseless assumptions. This framework avoids that entirely by responding only to verified structural changes and live conditions.
The levels shown simply identify where the current trend structure first shifted and where it would begin to lose integrity if breached. Recognizing these boundaries allows for clearer interpretation of market behavior without relying on forward guarantees, speculative projections, or unsupported assumptions.
⸻
Methodology Overview
This classification framework evaluates directional conditions using internal trend-interpretation logic that references price behavior relative to its structural layers. These relationships are used to identify when price movement aligns with the framework’s criteria for directional phases, transition points, or regime shifts. Visual elements or structural labels reflect these internal interpretations, rather than explicit trading signals or preset indicator crossovers. This framework is observational only and does not imply future outcomes.
Going Short TESLA HereTrading Fam,
I'm taking my first ever short here since implementing my new indicator. It has been killing it on the long side. We've exited our last 17 trades, all for wins, with an average profit of 30% per trade and our portfolio is up over 86% on the year. Now, it's time to test the short signals. We received two here on TSLA. I've taken a small entry since this is my first short, representing around 9% of the portfolio total. I'm going to target $350 but will not take more than a 7% loss, thus my stops are set at $476 bring the rrr on this trade entry to 1:3. Let's see how this goes.
✌️Stew

TSLA Post-Earnings Momentum – Don’t Miss!TSLA QuantSignals V3 – Weekly Trade Alert (2025-12-02)
Trade Direction: BUY CALLS (Bullish)
Confidence: 65% | Conviction: Medium
Recommended Strike: $430.00
Entry Range: $7.35
Target 1: $11.68 | Target 2: $15.43
Stop Loss: $5.11
Expiry: 2025-12-05 (3 days)
Position Size: 2% of portfolio
⚠️ Risk & Conflict Notes
Katy AI shows neutral bias with subtle bearish trend (-0.89% predicted move, 50% confidence), conflicting with bullish weekly momentum.
RSI overbought at 74 → potential pullback risk.
Options flow bearish (PCR 1.60) suggests institutional hedging; size position carefully.
Moderate risk warning: trade requires monitoring due to conflicting signals and short expiry.
💡 Trade Insight
Weekly bullish momentum +1.65% with trending regime supports short-term upside potential.
Technicals: MACD histogram bullish, VWAP support at $428.73, price near 91.6% of weekly range.
Timing advantage: leverage short-term momentum with 3-day expiry options.
Balanced delta (0.515) and tight stop loss help mitigate downside risk.

$TSLA: $350 Target - $380 Short (Support Breaking)The support for Tesla seems to be breaking, and the oscillators are due for a negative downtrend along with the RSI close being too high. The analysts at the same time are neutral and this has been given a buy over a strong buy target with catalysts like lower earnings in some countries and a lack of competitive advantage over BYD for actual output of vehicles produced and sold. Management is also unsure of Musk who has a huge multitrillion dollar pay package incentive which will make the company even lower on cash. Therefore, the next target for a NASDAQ:TSLA short in my opinion, is $380 or less within Q1 of 2026. As always, none of this is investment or financial advice. Please do your own due diligence and research.

TSLA daily bullish divergenceNASDAQ:TSLA is consolidating below all-time high resistance, suggesting a breakout is coming.
Wave (2) appears complete at the High Volume Node support and 0.5 Fibonacci retracement with a bullish structre flip.
📈 Daily RSI hit oversold with bullish divergence
👉 Continued downside has a target of the daily 200EMA $362
Safe trading

Tesla preparing for all time highs?NASDAQ:TSLA Price is ranging below all all-time high, well above the weekly pivot and 200EMA, which is bullish.
Wave © of C appears to be underway into price discovery with a target of $730, the R2 weekly pivot. This is because it has been printing a series of 3 wave structures. Wave B printed a triangle, which is a pattern found before a terminal move, reinforcing the Elliot wave count.
🎯 Terminal target for the business cycle could see prices as high as $730 based on Fibonaci extensions
📈 Weekly RSI is just below overbought so has room to grow
👉 Analysis is invalidated if we close back below wave (B), $280
Safe trading

TSLA: Hold or SellHello Traders,
Regarding the technical point of view!
Telsa have been previously overbought. there are two resistances on its way! 1st the dynamic and 2nd the static one!
A triangle shape has been formed!
If you have it right now, I'm more with keeping it!
But you may find more profitable stocks to buy!

Stock Market Forecast | BTC TSLA NVDA AAPL AMZN META MSFTStock Market Forecast | CRYPTOCAP:BTC SP:SPX NASDAQ:NDX NASDAQ:QQQ
Mag 7 | TSLA NVDA AAPL AMZN META MSFT GOOGL

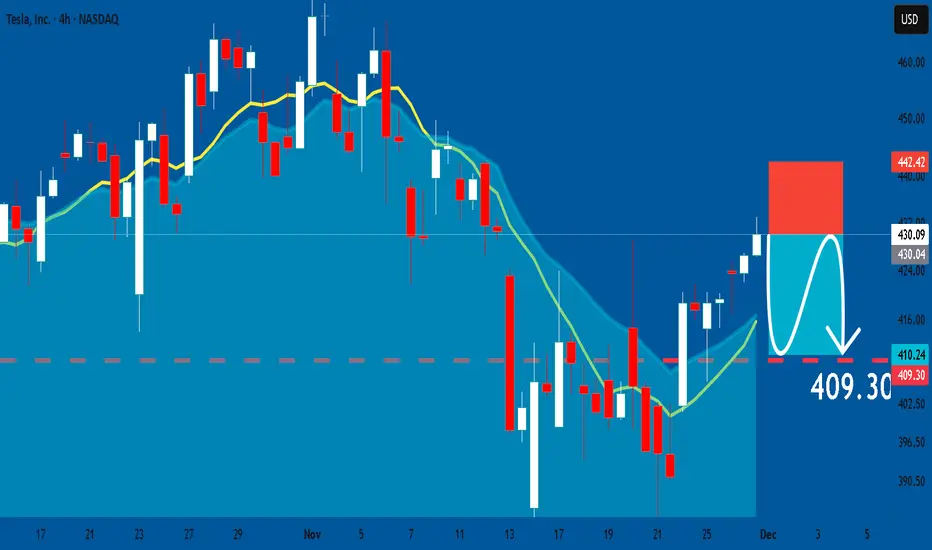
TESLA: Short Signal with Entry/SL/TP
TESLA
- Classic bearish setup
- Our team expects bearish continuation
SUGGESTED TRADE:
Swing Trade
Short TESLA
Entry Point - 430.09
Stop Loss - 442.42
Take Profit - 409.30
Our Risk - 1%
Start protection of your profits from lower levels
Disclosure: I am part of Trade Nation's Influencer program and receive a monthly fee for using their TradingView charts in my analysis.
❤️ Please, support our work with like & comment! ❤️
TSLA — Bullish Above 317.77, Targeting 544.53TSLA maintains a bullish structure as long as price holds above the key zone at 317.77.
This level represents the foundation of the current upward leg and serves as the invalidation point for the broader trend. As long as buyers protect 317.77, upside continuation remains the dominant scenario.
Price is currently reclaiming the 0.5 Fibonacci level at 424.43. A sustained close above this area strengthens bullish momentum toward 452.77 (0.618), followed by 472.47–484.48 (0.7–0.75). A breakout above these mid-range levels would open the path toward the major extension target at 544.53.
In a bearish scenario, price cannot break above the key support zone; any rally into it while trading below would be considered only a corrective bounce.
But as long as 317.77 holds, the primary outlook remains bullish.

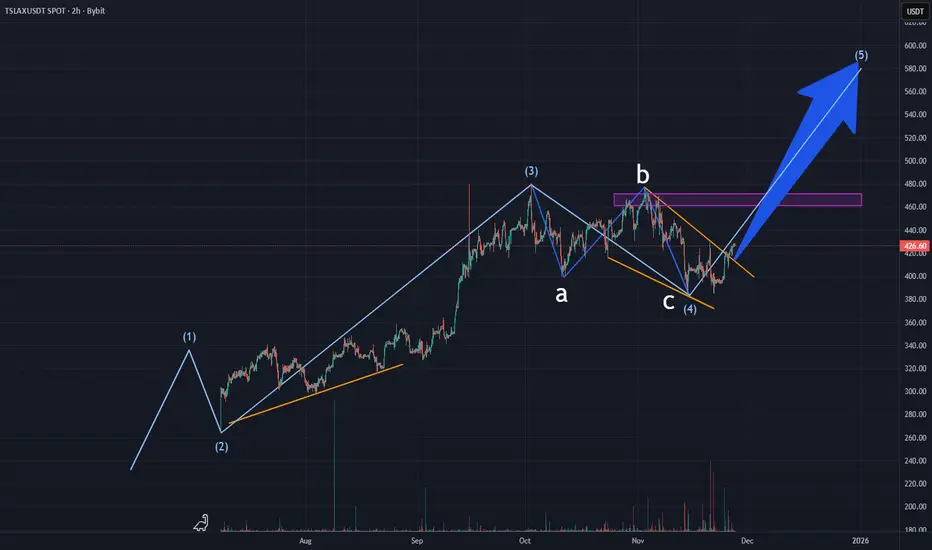
Tesla stock analysis based on Elliott WaveTesla (TSLAX, TSLA) is forming its 5th full wave of growth according to Elliott Wave Theory.
Unfortunately, the chart on TradingView is incomplete; it was created based on other sources and then transferred to TV.
ABC corrective waves (marked in blue) were most likely formed.
Above, we also see an area of liquidity that is more likely to be taken.
According to wave 3, we can predict the length of wave 5 to be around 20%.
As is well known, stock movements last somewhat longer than cryptocurrencies, and this should be kept in mind.
If the price forms a low lower than the start of wave 4, this wave structure will be considered broken, and the price may move downward.
Full breakdown on website
SPY WEEKLY LIVE 26 NOV 2025This is Spy weekly where I have clearly discussed why not to long here. Best is not to trade if you are not sure otherwise chances are you might get stuck at the top.
NOTE:STAY AWAY FROM GOING LONGS

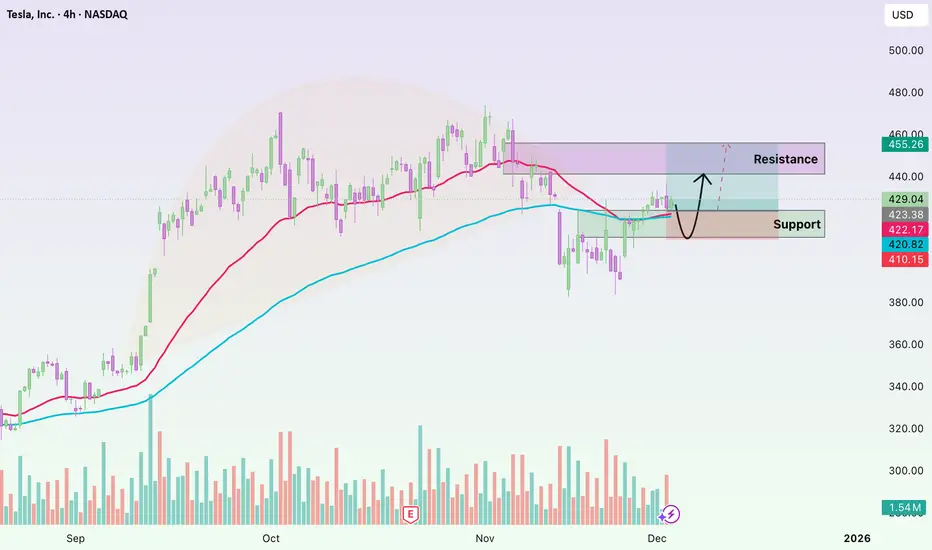
Tesla: A overview of itHi!
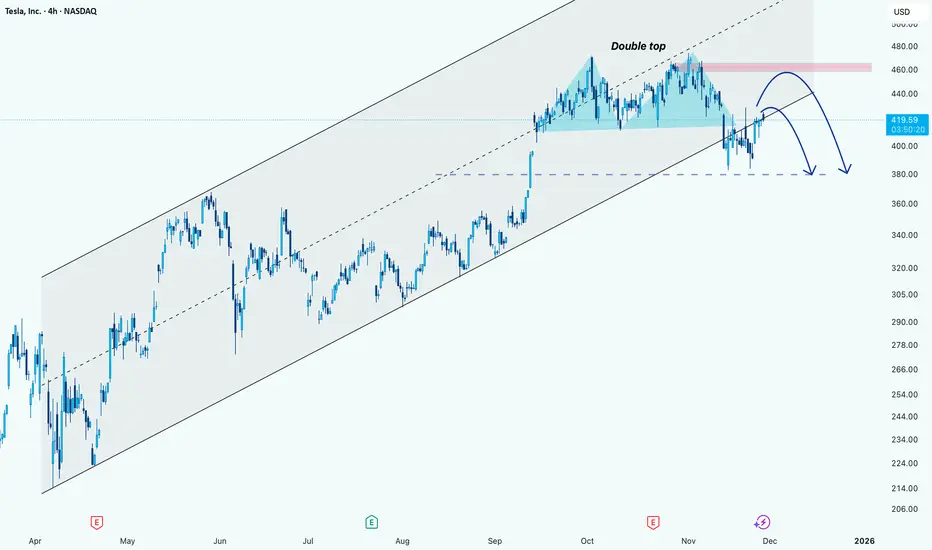
Trend Analysis:
TSLA has been trading in an ascending channel for several months, with higher highs and higher lows visible since April.
The recent price action broke above the midline of the channel but is currently consolidating near the $420-$425 area.
Pattern Formation:
A Double Top pattern near the $460 level formed.
This pattern signals a potential reversal if the price fails to break above the resistance zone (marked in pink).
The neckline of this double top appears around $400, which is also a key support zone.
Potential Price Action:
Short-term rebound:
TSLA could retest the resistance zone near $455-$460.
If it fails to break this area convincingly, the double top pattern could trigger a reversal.
Medium-term correction:
If the reversal occurs at the resistance zone, price may fall toward the neckline/support area near $380.
This aligns with the lower boundary of the channel and previous support levels.
TSLA long-term TATesla stock is in uptrend on weekly time frame, but the distribution has started on mid-term, watch for $380 level to hold. If this level is broken it may go even lower to $360, let's keep an eye on it.

It will be a bumpy ride downhillTesla's fanboys would not like it.
The company is facing turbulent times ahead and is still failing to provide what was promised years ago.
1. The legislators won't approve SDC also known as autonomous cars in the near future, because a human supervision is required. So the robotaxi is just a fiction.
2. Robots development is way behind the competitors. We all see the Boston Dynamics' Atlas, Mercedes-Benz project and some other projects. Comparing the Optimus project with the best out there is non-sense, because it fails on all fronts. Considering NVidia now open-sourced their project and collaboration with Google and Disney, IMO Tesla is out of the robo market now.
3. We see clear signs of a distribution phase at the top, fuelled by a lot of insider sells.
*Support levels are shown on the chart as green boxes. .
It is NOT a TRADING ADVISE .
There is a HIGH RISK of losing money when trading.
TSLA stock might be considered UNSAFE right NOW.

TESLA IS ENTERING A CRITICAL ZONETesla currently remains in an uptrend while moving inside the existing ascending channel. The most recent reaction came from the trendline, but an important structure has formed above: a clear double top pattern . After the pattern completed, price declined and is now retesting the neckline, which has already acted as resistance. The 50 EMA is also positioned at this same level, adding confluence.
According to the mechanics of the double top, the expected downward projection is typically equal to the distance between the top of the pattern and the neckline. That measured move aligns almost perfectly with the lower support zone and the 200 EMA , forming a strong confluence area.
Additionally, there is an imbalance inside that lower region, which commonly pulls price back to fill it. RSI has formed a downtrend and is moving toward the 30 level, which supports the likelihood of a continued decline.
If price breaks above both the RSI downtrend and the neckline, the move back upward along the channel becomes possible. However, the bearish confirmations remain strong unless a significant positive catalyst invalidates the setup.
