TESLATSLA is still in correction, we will wait for market to break above 295 and show us reaction before any buys.
Disclosure: We are part of Trade Nation's Influencer program and receive a monthly fee for using their TradingView charts in our analysis.
Tesla Motors (TSLA)

$TSLA $160-180? I think..."Technical bounce on NASDAQ:TSLA at 160-180? – Possible long???"
📉 Nasty drop on TSLA, broke below the $250 level.
🎯 Potential short setup now, with a target around $160-180.
That’s where I’ll start buying—if we get a daily or weekly reversal candle, with a stop just below support.
👉 Follow me for more updates on stocks and futures.

Is Stock Market Bouncing Here or Continue Crashing?Stock Market Analysis | NASDAQ:QQQ & AMEX:SPY
Mag 7 Analysis | NASDAQ:TSLA NASDAQ:NVDA AAPL AMZN MSFT GOOGL META

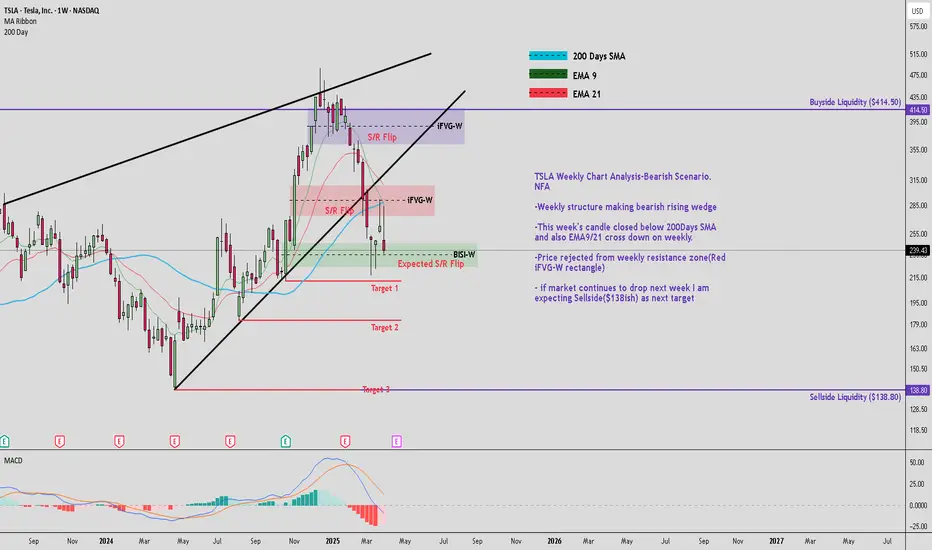
TSLA Weekly Chart Analysis-Bearish Scenario. NFATSLA Weekly Chart Analysis-Bearish Scenario. NFA
-Weekly structure making bearish rising wedge
-This week's candle closed below 200Days SMA and also EMA9/21 cross down on weekly.
-Price rejected from weekly resistance zone(Red iFVG-W rectangle)
- if market continues to drop next week I am expecting Sellside($138ish) as next target
nazis arent from south africawhat do u want me to say...
weekly chart here w/ weekly trendlines (aggressive & conservative- dashed)
earnings report on the 22nd line up at 200$ for Q1. awfully close at the 173/169 dollar too.
what does the FOMC have to say on the 9th???
i have an alert at 200, i'll buy @ 175$ (wait n see a week or two)
the Left losing their minds!!!!!!!

TSLA is coming down to my buy zoneTSLA is coming down to my buy zone. I will be accumulating at 229 and below.
I will start first by selling cash covered naked puts to collect credits until it drops to that zone. The goal is to get assigned with the naked put options at a cost of 229 and below to purchase TSLA shares.
There is a good possibility that the next earnings of TSLA will disappoint and we might get a quick dip. In that case we may even see early 200s. I would be adding more shares there.
Note that this is a weekly chart so it will take some time to play out.
This is a long term hold for me.
Upside Target:
- Nearest upside target is 11.9% above the current price, approximately $267.86.
Downside Target:
- Nearest downside target is -1% below the current price, approximately $237.04.
- Next downside target is approximately $195.65-196
- Support and Resistance: Monitor the support at $217.02 and resistance at $291.85 for potential breakouts or breakdowns.
- Action: Given the bearish sentiment, consider waiting for a clearer bullish signal or confirmation of support holding before entering long positions. Up Volume to Down Volume Ratio 30-Days is 0.86 and 50-Days is 0.78, both below 0.8, indicating bearish sentiment in the near term so wait for it to come down to the buy zone.

TESLA Expected Growth! BUY!
My dear subscribers,
My technical analysis for TESLA is below:
The price is coiling around a solid key level - 239.33
Bias - Bullish
Technical Indicators: Pivot Points Low anticipates a potential price reversal.
Super trend shows a clear buy, giving a perfect indicators' convergence.
Goal - 257.40
About Used Indicators:
By the very nature of the supertrend indicator, it offers firm support and resistance levels for traders to enter and exit trades. Additionally, it also provides signals for setting stop losses
Disclosure: I am part of Trade Nation's Influencer program and receive a monthly fee for using their TradingView charts in my analysis.
———————————
WISH YOU ALL LUCK

Could bounce from here and may collapse laterPotential to bounce from here for the next couple of months. After bounce, if it comes back to the current level, then it could be a sign of crash. All the best !!

QQQ: Tariff ReactionNASDAQ:QQQ As China strikes back with a 34% tariff on U.S. goods starting April 10, the global trade landscape could see some serious turbulence. This follows Trump's tariff moves, and the market's already feeling it: QQQ’s daily chart shows capitulation volume on the table, suggesting a potential bounce— IF tariffs ease.
But until these trade tensions subside, it's likely to be a rocky ride. Tariffs push prices up, inflation lingers, and the Fed finds itself boxed in. The outcome? A market crash, recession, and stagflation—yet, there's still hope for a bounce, depending on how these factors play out.
Manage the levels with us at ChartsCoach.

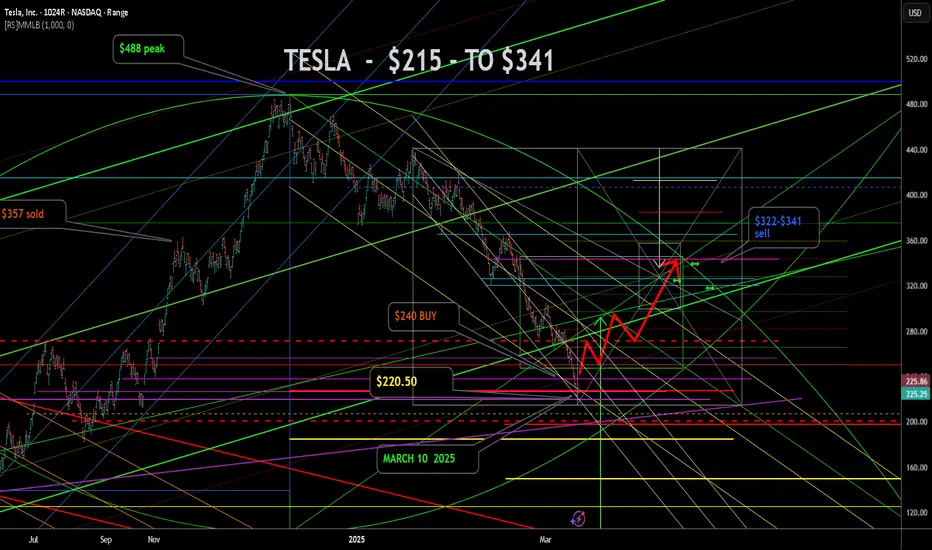
TSLA - BUY NOW - $240 I have been waiting for the low in Tesla . TSLA. Today is good enough at $240. Had to keep lowering the entry . Todays Legacy Media bad news bears were my trigger. You can always count of Corruption to help refine your technical signals. Murrey Math, Elliotwave, Kumar wave being used. Sell $340 for now. May $340 calls are a good way to play. Entertainment purposes only. Just having fun. Comments always welcome.

TESLA - THE CLIMB BACK TO $341 This is a pretty tough call to make right here. And I may get humbled. But the charts say to me - Kumar, there was a short term low today. And the next point of exhaustion is $341. Lets see what happens. This chart is likely a mess to most, but harmonious art work to me. Elliot, Murrey and Kumar being used for the analysis. Comments always welcome. Happy Trading.
TSLA - A false start? UPDATE : Tesla is unfortunately not starting on the right foot. The price action since the low is NOT impulsive to use an Elliot Wave term. So this is very unlikely to be the low. I will be selling my $265 calls near $255 price levels. And then patiently wait to see if we drift down for the true wave 5 down to $187. Additionally, the Murrey Frame 1/8ths line is also down there, as well a the Red dashed P line from the last break out. So..... if this take is wrong, and we manage to leave the channel gate move above $260 I will update. Until then its prayers to offload these longs profitably, and reset lower. Comments always welcome. And remember, trading is hard work, Sometimes we fish for a long time to catch the tastiest fish in the sea. Bona Fortuna!

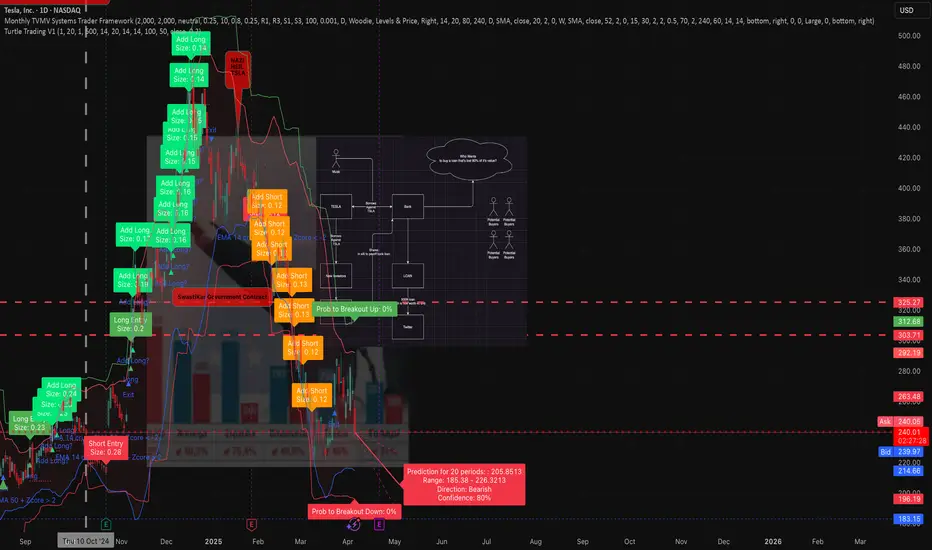
TSLA still bearish like I said. Why you should sue the board.This chart uses an unpublished modified turtle trader indicator / strategy combined with the unpublished TVMV framework using MFT candle sticks (published as separate indicator) and Bollinger bands. The max monthly position size is determined by seasonal probabilities, while the individual trade position sizes are determined by the turtle style volatility sizing based off the former's capital.
Nothing has changed about TSLA.
It has a work from home CEO who is who disconnected from reality and accountability that the stock will not recover. No amount of government contracts can over come the damage this man has done to the brand.
Sales and deliveries are down in every market and the car owners are afraid to drive their cars.
This recent pump had no basis. It lacked both fundamental value and technical value.
TSLA will break below 222 and may go as far as 109 by EOY if the board of directors does not fulfill their fiduciary obligations to share holder to remove Musk permanently .
Shareholders should seriously consider filing a class action law suit against the board of directors in collaboration with NY .
HOLY MOLY! ARE WE IN A RECESSION? $TSLA $120 BEAR FLAG PATTERNA bear flag trading pattern is a technical analysis formation that features a downward-sloping flagpole, followed by a consolidation phase forming a parallel channel. This pattern suggests a potential sharp decline or continuation of the downward trend
I also notice a head and shoulders pattern, as well as an inverse cup and handle.
Everything points to $120.
Sell/Short NASDAQ:TSLA right now with fact check:
+brand reputation risk, high competition, loss of EV market leadership, cyber truck/ product recalls, declining sales with lower margin, stock volatility concern, insider selling, investors buy it based on expected future earnings rather than its current profitability.
+ potential stagflation, tariff war, slow economic growth, inflation, rising public debt, geopolitical tensions, ai bubble, and more

Honestly, I don't feel like explaining, the chart says it all !!Tesla's price can drop below $200 and then have a good increase.
Give me some energy !!
✨We spend hours finding potential opportunities and writing useful ideas, we would be happy if you support us.
Best regards CobraVanguard.💚
_ _ _ _ __ _ _ _ _ _ _ _ _ _ _ _ _ _ _ _ _ _ _ _ _ _ _ _ _ _ _ _
✅Thank you, and for more ideas, hit ❤️Like❤️ and 🌟Follow🌟!
⚠️Things can change...
The markets are always changing and even with all these signals, the market changes tend to be strong and fast!!

Tesla shows downtrend As shown in the chart, there is a well-known pattern called Head and Shoulders. The black trendline represents the monthly data.

Tesla to bounce from hereNASDAQ:TSLA
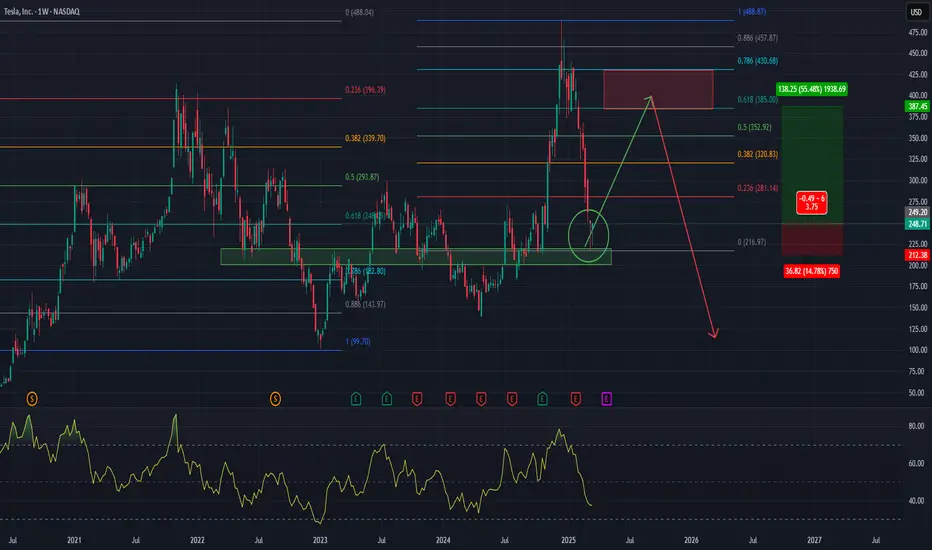
Tesla has reach and bonce from a key support level, as seen on the chart, in the Golden Pocket, between the 61.8% and the 78.6% Fibonacci Retracement, and it is shown two weekly hammer candlestick bar near each other, which is bullish. Odds that it has already found a mid-term bottom is high.
Now I expect a multi-week bounce from here, probably to the next Golden Pocket at the top, which is between $385 to $430 USD.
And yes, Elon Musk upset his customer base, and the stock is very expensive compared to other car manufacturers, and will probably see little to no growth in sales this year, or even a decline, insiders has sold big amounts of shares and it is all looking bad. And yes, we have probably already seen the top in Tesla in December last year for a long time.
However, stocks don’t generally go down in a straight line, the stock, as well as the stock market in general is oversold and do for a bounce, maybe a big bounce.
After the bounce, I will be looking for shorts, but now, I’m looking for longs.
Good luck to you
Do you think Tesla will reach back up to all time highs?Do you believe Tesla can make its way back up after this sharp decline? or do you think there is still more downside to come?

Tesla Bull Trap is copiumThere is currently 0% probably of a substantial breakouts in either direction.
Tesla is crabbing and will likely continue to crab with high volatility until May.
Nothing about the fundamentals has changed, and no technicals in terms of trend, volume, momentum, volatility and options chains suggests a reversal is nessary.
The overall damage Elon has done to the brand is likely irreversible at this point. Sales in Germany are down I believe 90%, and more than 50% in the US, meanwhile in China BYD is dominating. Moreover, China or Germany could seize the gigafactory in retaliation for tarrifs if they wanted. That only leaves Texas and Nevada as manufacturing hubs on products without any sales.
The promise of a fleet is a pipedream because FSD is not safe. Though this regime may push it through for Elon's benefit, it would only serve to incr3ase liabilities on their balance sheet and further damage the brand so it's not the moon shot he presents it to be.
The entire brand was built on climate pledges and hope.
The CEO has now endorsed big oil, he's running massive gas generators for AI, supports the regime that backed out of the Paris Agreement (again) and the protests are growing in momentum without any sign of slow down.
In short TSLA is in the "find out" phase.

Tsla Lesson Tesla Stock Always Pay YOURSELFI say this time and time again and this is a PRIME EXAMPLE SO FAR.
🌍Now I suggested THAT IF YOU WERE A TESLA BULL that you might want to start to PAY ATTENTION TO THE STOCK TWO WEEKS AGO.
❓️"OK SO WHAT'S THE LESSON"❓️
I emphasise ALWAYS that TIME TRUMPS PRICE...
TESLA has been rather docile since its initial POP.
But take a look at the HIGHER TIMEFRAME WEEKLY CHART❗️
Whats clear to see is that although the PRICE RANGE hasn't been MASSIVE there has been plenty OF ⏳️TIME TO CAPITALISE AND PAY YOURSELF. £$€¥ 💰
Two 📈HIGHER CLOSES ON THE WEEKLY and the call made whilst the weekly looked EXTREMELY BEARISH📉
EVEN RIGHT NOW we are currently UP ON THE WEEK UNTIL NOW.
ℹ️ If you WERE UNABLE to STRUCTURE A TRADE TO TAKE advantage of this PRICE RANGE whilst DAY TRADING you may need to LOOK BACK and STUDY WHY NOT.
⚠️You could have paid yourself several times over already and even if TESLA was to seek lower prices from here you SHOULD HAVE BACKED SOMETHING ALREADY.
✅️AS ALWAYS TRADE YOUR PLAN & WAIT FOR YOU SIGNAL✅️

INVERSE CUP AND HANDLE $TSLA TO $120 The inverted cup and handle, also known as the upside-down cup and handle pattern, is a bearish chart formation that can occur in both uptrends and downtrends. Unlike the traditional bullish cup and handle pattern, this inverse pattern features two key components: the "cup," which forms an inverted U-shape, and the "handle," a brief upward retracement following the cup.
Sell NASDAQ:TSLA right now with fact check:
brand reputation risk, high competition, loss of EV market leadership, cyber truck/ product recalls, declining sales with lower margin, stock volatility concern, insider selling, investors buy it based on expected future earnings rather than its current profitability.
+ Head and shoulder/ inverse cup and handle, P/E ratio 79.8-161.23 (overpriced), falling knife, dead cat bounce, the lowest target estimate stands at $120.00, below the 50-day, 100-day, and 200-day moving averages, MACD indicator is -19.8, bearish signals.
+ potential stagflation, tariff war, slow economic growth, inflation, rising public debt, geopolitical tensions, ai bubble, and more

TSLA Stock LONG Investment Opportunity
Hello, I am trader Andrea Russo and today I have a LONG buy opportunity on TSLA stock.
Entry Price: $253.59
Target Price (TP): +27.84%
Stop Loss (SL): -9.91%
Tesla, Inc. (TSLA) is one of the most innovative and dynamic companies in the automotive and technology sector. With its commitment to sustainable energy and the continuous expansion of its product range, Tesla represents a solid long-term investment opportunity.
Technical Analysis: The entry price was set at $253.59, a level that represents a key support point. Our strategy includes a target price of +27.84%, which reflects our confidence in Tesla's growth potential. At the same time, we have set a stop loss at -9.91% to limit losses in case of adverse market movements.
Investment Rationale:
Continued Innovation: Tesla continues to innovate in electric cars, batteries, and renewable energy.
Global Expansion: The company is expanding its global presence with new factories and markets.
Market Leadership: Tesla maintains a leadership position in the electric car market, with strong demand for its vehicles.
Bottom Line: This LONG TSLA buying opportunity is supported by solid technical analysis and strong business fundamentals. I encourage investors to consider this strategy to capitalize on Tesla's growth potential.
Happy Trading!

$TSLA RETEST $250 TO CONFIRMThe NASDAQ:TSLA experienced a rapid surge without any accompanying news.
It's expected to retest the $250 level, after which a further evaluation will be necessary to determine its next move.
SELL NOW AND BUY LATER
