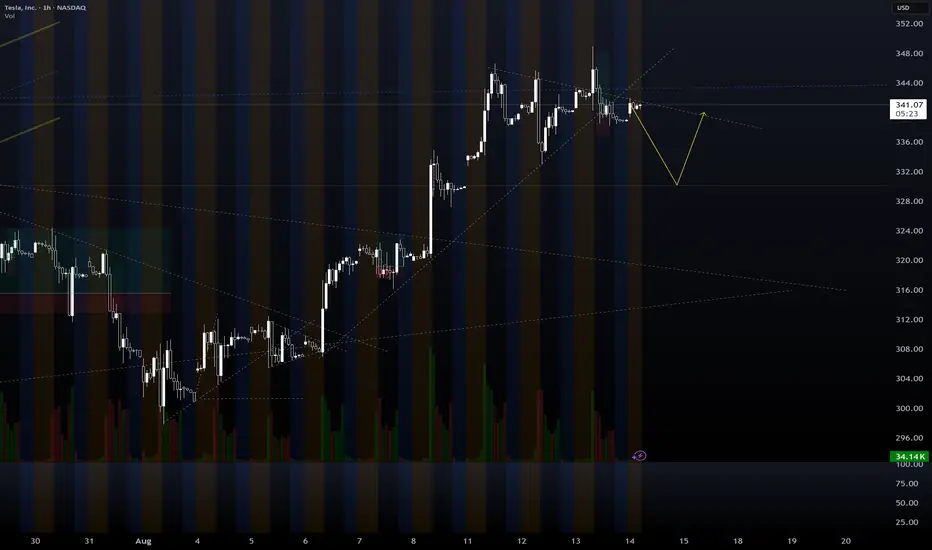
TSLA TESLA Institutional Roadmap for September Discount ZoneTesla NASDAQ:TSLA – Institutional Roadmap for September: Discount Zones, Breakout Triggers, and Squeeze Targets
Tesla continues to trade as one of the clearest institutional battlegrounds in the market. The footprints in option open interest, dark pool levels, and anchored VWAP create a very precise map for swing traders who want to follow the flow rather than fight it.
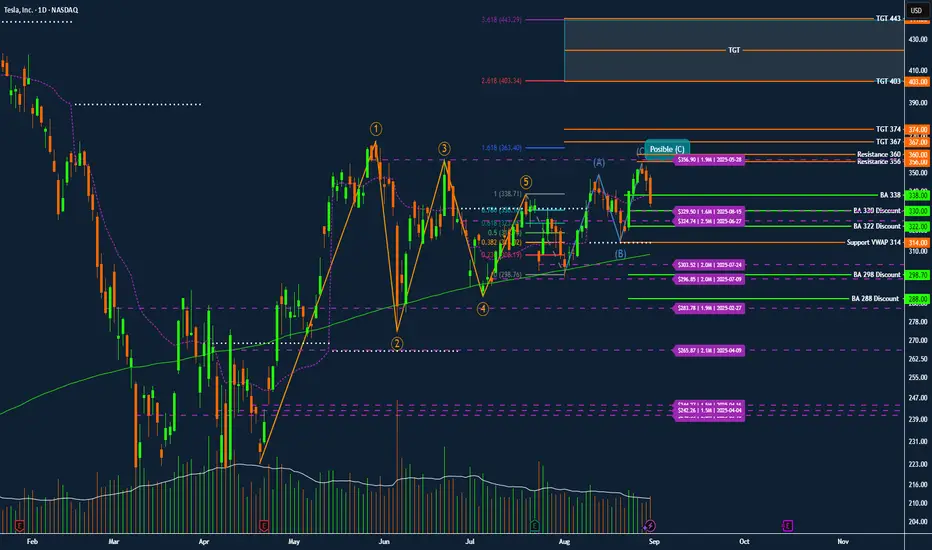
Elliott Wave Context
Tesla completed a clean 1–5 impulse wave earlier in the year. The stock has since been retracing in an A–B–C corrective structure, with wave (C) still tentative. The rejection near 348–350 matches heavy open interest and serves as a possible end of (C). However, the high-volume sell candle at 333 suggests the correction may continue lower into discount zones before the next advance.
Institutional Discount Zones
330–332: first defense level, with recent dark pool support
322: deeper discount aligned with the 0.618 retracement
314: anchored VWAP level, a frequent institutional reload zone
298–300: July dark pool activity and strong confluence support
288: extreme discount zone from February
Breakout Triggers
BA 338: first bullish-above confirmation trigger, but only valid if defended by volume
356–360: the real battleground. Massive call open interest is stacked here. A clean break above confirms institutional participation
Upside Targets
367–374: first expansion target and resistance magnet
403: Fibonacci 2.618 extension
443: Fibonacci 3.618 extension
467: Fibonacci 4.236 extreme target if momentum continues
Flow and Volume Notes
Options flow shows concentrated put open interest between 300–320, confirming institutional defense of that floor. Call interest is stacked heavily at 350–360, which explains the recent rejection zone. The latest sell-off candle came with above-average volume, reinforcing the probability of a deeper retest into 330–322 or even 314 VWAP.
Trading Roadmap
If Tesla holds 330–332, expect a potential reversal with BA 338 as confirmation.
If 330 breaks, expect a move into 322 or 314, and a flush to 298 remains possible.
If 356–360 is reclaimed with volume, the squeeze path opens toward 367–374.
Breaking above 374 accelerates directly into 403 and later 443.
Conclusion
Tesla remains a classic institutional shakeout pattern rather than a breakdown. The map is clear: watch the discount zones for accumulation, use BA 338 and the 356–360 battleground as confirmation triggers, and follow the roadmap toward 374, 403, and 443 once the breakout validates. Patience is edge. Institutions will reload near VWAP and dark pool levels, while retail chases 350. Follow the Darkpools not the noise.
Tesla Motors (TSLA)
TESLA Expected Growth! BUY!
My dear friends,
Please, find my technical outlook for TESLA below:
The price is coiling around a solid key level - 333.86
Bias - Bullish
Technical Indicators: Pivot Points High anticipates a potential price reversal.
Super trend shows a clear buy, giving a perfect indicators' convergence.
Goal - 344.59
Safe Stop Loss - 327.03
About Used Indicators:
The pivot point itself is simply the average of the high, low and closing prices from the previous trading day.
Disclosure: I am part of Trade Nation's Influencer program and receive a monthly fee for using their TradingView charts in my analysis.
———————————
WISH YOU ALL LUCK

TESLA Bullish Wave C still underway...NASDAQ:TSLA is a tough count, the entire macro chart looks like a complex correction (wave 4?) with many series of 3 wave structures.
A triangle in wave B of the current wave appears complete, leading to a terminal thrust up with a target of the High Volume Node resistance at $410 followed by a poke above the swing high touching the R1 pivot at $548.
RSI remains at the EQ.
Analysis is invalidated below the wave B triangle.
Safe trading

TESLA RISING SUPPORT|LONG|
✅TESLA is trading in an uptrend
Along the rising support line
Which makes me bullish biased
And the pair is about to retest the rising support
Thus, a rebound and a move up is expected
With the target of retesting the level above at 350$
LONG🚀
✅Like and subscribe to never miss a new idea!✅

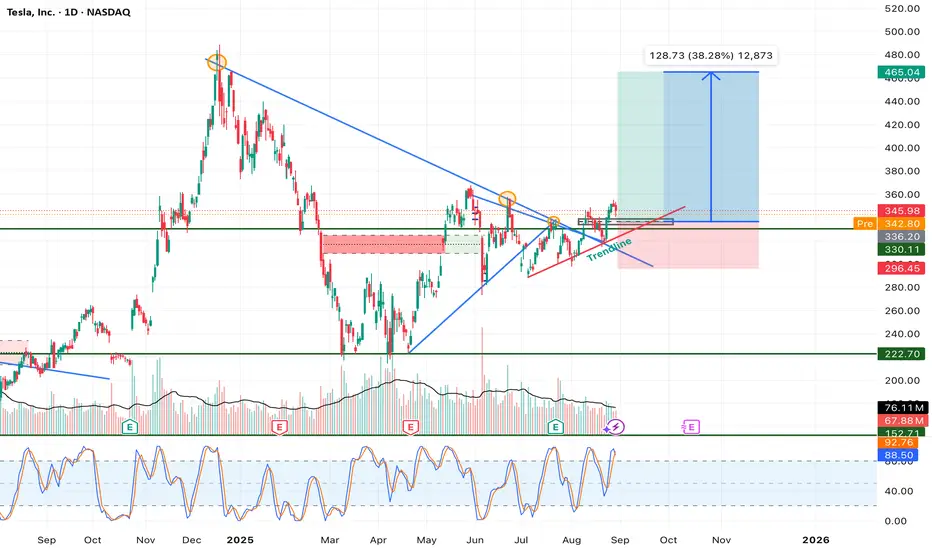
Tesla – Symmetrical Triangle Breakout With 38% Upside PotentialTesla (TSLA) has been consolidating for several months within a symmetrical triangle formation, bounded by a descending resistance trendline from the November 2024 high and an ascending support trendline from the April 2025 low. This consolidation has now resolved with a breakout above resistance, suggesting the start of a new bullish leg.
Technical Breakdown:
1. Symmetrical Triangle Formation:
• Price compressed into tighter ranges, with lower highs and higher lows converging.
• Breakout occurred above the descending trendline, confirming bullish bias.
2. Volume Confirmation:
• Breakout was accompanied by a noticeable uptick in buying volume, strengthening the validity of the move.
• Historical patterns show Tesla often rallies strongly after high-volume breakouts from consolidation zones.
3. Support & Resistance Zones:
• Immediate support: $336 (former resistance turned support, aligned with trendline retest).
• Stronger support: $296 (previous demand zone, key invalidation level).
• Resistance target: $465 (measured move from triangle breakout, aligning with prior swing levels).
4. Momentum Indicators:
• Stochastic RSI is rebounding from oversold territory, suggesting fresh buying momentum.
• MACD (not shown on chart but implied) likely supports bullish crossover given recent price action.
5. Risk-to-Reward Setup:
• Entry: $340–$345 zone after breakout retest.
• Stop Loss: Below $296 (breakdown invalidation).
• Target: $465 (38% upside potential from current levels).
• Risk/reward ratio favors long positions with significant asymmetry.
Trade Thesis:
The breakout from a well-defined symmetrical triangle suggests a continuation of Tesla’s mid-term bullish trend. The measured move projection points toward ~$465, representing a potential 38% rally from current prices. As long as price sustains above the $336–$340 support zone, bulls remain in control. A breakdown below $296 would invalidate this structure and open the door for a deeper retracement.
Conclusion:
Tesla has entered a critical bullish phase after months of consolidation. With volume confirmation, favorable risk-to-reward, and momentum recovery, the path of least resistance is higher. Upside targets sit near $465, with invalidation set at $296.
NASDAQ:TSLA
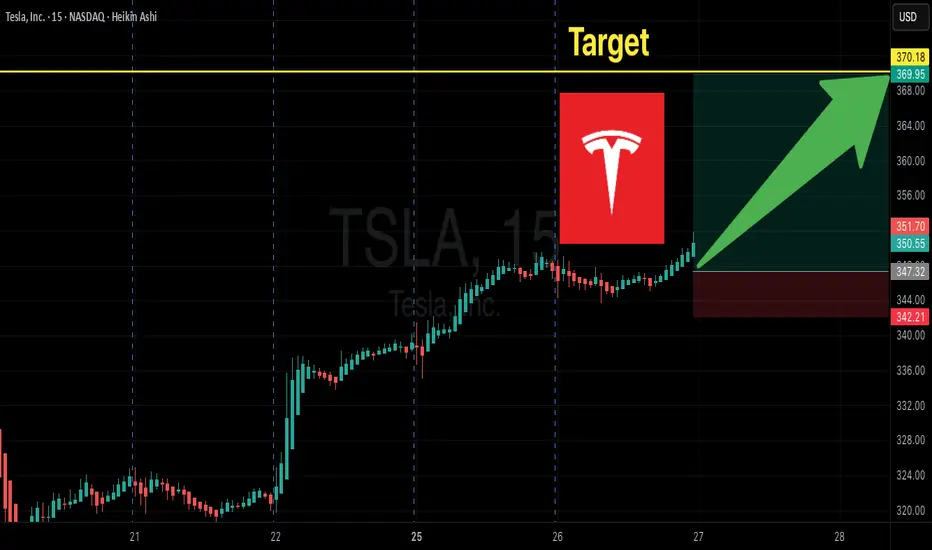
TESLA 28 AUG 2025 PRICE ACTIONPrice action for Tesla is here. I have clearly explained my plan on how to trade tesla considering every factor in market.
NOTE: OPTION WILL BURN YOUR CAPITAL

TESLA, pay attention to these numbers!!Despite the electric vehicle sector experiencing strong demand growth, with EV sales up 33.6% in July across the European market (source: Investing.com), Tesla appears to be struggling to keep up with the trend, posting a 40% drop in sales. In contrast, BYD continues to gain market share steadily.
Yet, Tesla is currently trading at a price that reflects an EPS multiple of 203.83x (with revenue growth expected to be -5.4% in 2025 and EPS falling by 12.1%) , an aggressive valuation that is difficult to justify given the company’s revenue has seen only modest growth over the past two years. This stagnation is largely due to weakening gross profit margins and broader macroeconomic headwinds that are weighing on performance. The current stock price still seems inflated by the momentum and hype generated by Tesla's strong performance up to 2022.
It is also worth noting that Elon Musk, during a key period, appeared to shift focus away from Tesla, impacting investor confidence and leadership credibility.
From a technical and statistical perspective, Tesla appears significantly overbought, with an estimated fair value that is 27.04% lower than the current price. On the chart, there’s a clear resistance zone between $346.04 and $351.22, and a support zone between $366.53 and $368.80.
(DISCLAIMER: The following is a personal opinion, not financial advice!!)
A potential short position in the coming days cannot be ruled out, with market reaction likely hinging on the earnings report due October 21. A stop-loss could be set around $368.80 (if the upward trend fails to confirm), with a take-profit range between $329.70 (200-day MA) and $302.00. An initial take-profit could be considered around $322.97, aligned with the 50-day moving average (MA50).
Let me know if you like the content and if you want give me a feedback!!
NVDA LIVE 27 AUG 2025This is my analysis for NVDA . i am not touching it all. I have discussed my reasons as per data. If you have any doubts, feel free to DM me
NOTE: AVOIDING NVDA

TESLA WILL KEEP GROWING|LONG|
✅TESLA is going up
Now and the stock made a bullish
Breakout of the key horizontal
Level of 346.00$ and the breakout
Is confirmed so we are bullish
Biased and we will be expecting
A further bullish move up
LONG🚀
✅Like and subscribe to never miss a new idea!✅

Dogecoin (DOGE) Market Update & Catalysts: Ready for 50 cents?🚀 Dogecoin (DOGE) Market Update & Catalysts
🐋 Whale Accumulation & Trading Activity
Large players (“whales”) have been steadily absorbing DOGE, fueling upward momentum. Recent market structure shows that bulls defended the $0.22 zone, while primary support and reload range sits at $0.15–$0.16 — the bottom of the accumulation range. A breakout above $0.25 could spark a run toward $0.40, especially if short positions get squeezed.
🏦 ETF Prospects & Institutional Tailwinds
Optimism is building around a potential Dogecoin Spot ETF, with growing speculation that approval could arrive in the next cycle. An ETF would open the doors for institutional capital, mirroring what happened with Bitcoin’s rally.
🔗 Expanding Utility (DogeOS & DeFi)
The development of DogeOS, which allows DOGE to interact with Ethereum DeFi ecosystems, could give the coin a major utility boost beyond its meme status. This evolution may help sustain higher valuations long-term.
📈 Technical Signals & Price Forecasts
Chart patterns are turning favorable:
Golden cross (50-day MA crossing the 200-day) shows momentum strength.
Oversold RSI signals suggest a potential reversal upward.
If support at $0.15–$0.16 holds and bulls reclaim $0.25, upside targets expand to $0.34–$0.40.
🔮 Bullish Scenarios & Analyst Sentiment
Mid-term projections highlight possible price zones:
Conservative path: $0.30–$0.33 into 2025.
Aggressive path: Retesting all-time highs near $1 if institutional demand + ETF + DeFi traction align.
🌟 Key Positive Catalysts
🔑 Catalyst 🚀 Impact
🐋 Whale absorption & accumulation Strengthens base; short squeezes possible.
🏦 Spot ETF approval potential Brings institutional demand.
📊 Technical bullish patterns Golden cross + RSI suggest uptrend.
🔗 DogeOS & DeFi integration Expands DOGE’s real-world use cases.
💬 Strong community + hype Keeps DOGE in the spotlight.
✅ Summary
Dogecoin is holding its accumulation base at $0.15–$0.16, with strong whale support and growing catalysts like ETFs and DeFi integration. If bulls can reclaim the $0.25–$0.26 zone, momentum could build toward $0.40 in the mid-term — with long-term upside scenarios eyeing $1+ if institutional and utility drivers align.

TSLA (swingtrade) Bull flag1. Pattern : Bull flag breakout
2. retest: done
3. sma 50 on hold in D1,W
* could fake break out alway stoploss

Tesla Options Flow Signals BIG Upside! $370C Momentum Trade
# 🚀 TSLA Weekly Options Setup | 370C Targeting 100%+ 📈
### 🔑 Key Highlights
* **Momentum:** RSI rising on both Daily (63.5) & Weekly (68.4) ✅
* **Options Flow:** Strong bullish skew (C/P = 1.79) 🟢
* **Volume:** Weak overall (0.9x), but institutional spike into close ⚡
* **Volatility:** VIX low → favorable for directional calls 😎
---
### 📊 Trade Setup (Consensus Pick)
* 🎯 **Instrument:** TSLA Weekly Call
* 💵 **Strike:** \$370C
* 📅 **Expiry:** 2025-08-29
* 💰 **Entry:** \$0.98 (ask) — open
* 🛑 **Stop:** \$0.49 (-50%)
* 🎯 **Target:** \$1.96 (+100%)
* ⏳ **Max Hold:** Close by **Thursday EOD** to avoid Friday theta/gamma crush
---
### 📌 Why \$370C?
* Best **liquidity** (OI \~18,450, vol 20k) → tightest fills ✅
* Balanced **delta & leverage** for short-term momentum 🎯
* Aligns with most model recommendations 📊
---
### ⚠️ Risks to Watch
* 🔻 **Theta decay** accelerates mid-week → avoid holding to Friday
* 🔻 **Gap risk** at open — manage entries with limit orders
* 🔻 **Market reversal** can kill momentum fast
---
## ✅ Final Verdict: **Strong Weekly Bullish Bias**
TSLA looks primed for an upside push — \$370C is the sweet spot for this week’s expiry.
---
### 🔥 Hashtags
\#TSLA #OptionsTrading #WeeklyOptions #StocksToWatch #MomentumTrading #TradingSignals #CallOptions #BullishSetup #TeslaStock
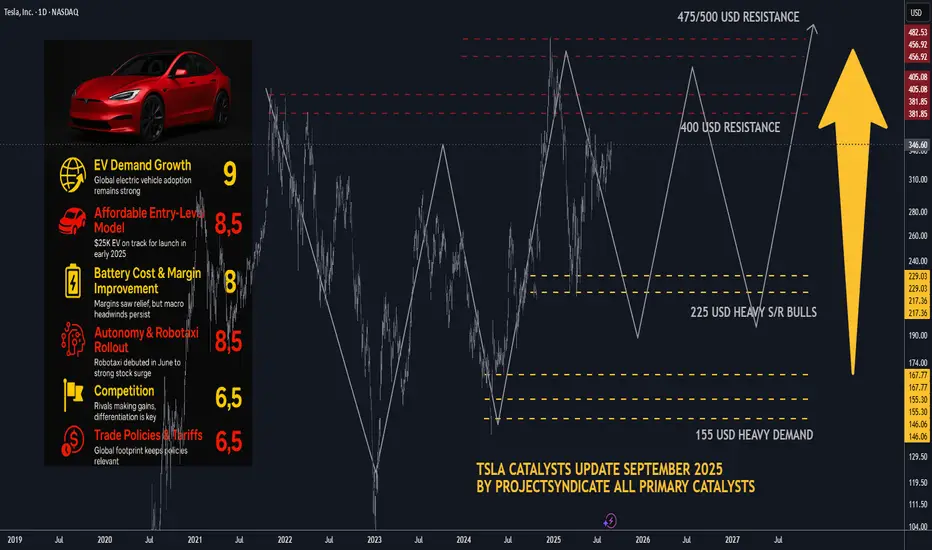
TSLA Catalysts Ranking: September 2025 update and Path ForwardHere's an updated/revised outlook for TSLA including all the primary
catalyst ranking and analyst ratings and overview of latest developments
this was updated for September 2025 with all the viable market data.
🤖1. Autonomous & Robotaxi Execution (↑ from 8.5 to 9/10)
• Why it matters: Tesla officially launched its Robotaxi service in Austin on June 22, 2025, deploying a small fleet of 10–20 invite-only Model Ys operating within a geofence and featuring human safety monitors..
• The stock rallied impressively—up 9%–11% on launch day..
• Regulatory scrutiny intensified as the NHTSA launched probes into delayed crash reporting and other safety concerns..
• Musk also touted FSD v14 as 2–3× safer than humans, with v15 aiming to be 10× safer—but cautioned debugging would take "several months.".
• Why the bump to 9/10? The real-world rollout is finally underway, drawing heavy investor focus—even amidst safety questions.
________________________________________
🌍2. EV Demand Growth & Geographic Recovery (holds at 9/10)
• Despite a 13% year over year global sales drop in H1 2025, future demand hinges on Amazon of lower priced models and tax credit extensions..
• Strong upward investor sentiment: TSLA is up 54% over the past year, despite being down ~16% YTD..
• Why still 9/10? Long-term EV momentum remains solid; a rebound may follow new launches or incentive shifts.
________________________________________
💸3. U.S. EV Tax Credits & Incentives (↑ from 6 to 7.5/10)
• The $7,500 EV tax credit—set to expire September 30—has been extended: now, buyers can qualify with a signed purchase agreement, even before delivery..
• However, expiration still looms and could dampen demand..
• Why bump to 7.5/10? The extension buys breathing room and could stabilize near-term demand.
________________________________________
📉4. Fed & Interest Rates (↑ from 5 to 6.5/10)
• On August 22, Tesla led a mega cap tech rally (up 6%+) after Fed chair hinted at possible rate cuts—lower borrowing costs may aid EV financing..
• Why improved score? Lower rates remain a key catalyst for big-ticket items like EVs.
________________________________________
🎭5. Affordable Entry-Level Model / Next-Gen Platform (holds at 8.5/10)
• Musk revealed the upcoming affordable model may resemble a Model Y and could launch slower than expected post tax credit expiration..
• The “next gen” platform—including the so called “Model 2/Q” or Cybercab—targets mid 2025 production..
• With delays likely, expectations remain high but execution risk persists.
________________________________________
🔋6. Battery Cost & Margin Improvement (holds at 8/10)
• Q2 margins improved modestly, supported by cost cuts and energy business growth..
• Yet, regulatory credits continue to decline (–51%), pressuring margins..
________________________________________
🤖7. Energy & AI Upside (new 8/10)
• Tesla is doubling down on autonomy and energy. Musk highlighted robotaxi, energy storage, and its humanoid Optimus robot, slated for early 2026..
• Wedbush’s Dan Ives sees Tesla as an “embodied AI compounder,” while William Blair estimates self driving could be worth nearly $1 trillion..
• This iterative AI and energy focus is a compelling re-rating vector.
________________________________________
📊 8. Safety, Regulatory & Governance Risk (↑ to 7/10)
• NHTSA’s probe into crash-report delays, plus ongoing FSD safety concerns, elevate tail risk..
• Musk’s political entanglements have had adverse brand impacts; while stepping back from new political initiatives helped marginally, skepticism persists..
• Added governance scrutiny and Musk’s external ventures continue to weigh on sentiment.
________________________________________
🚩9. Competition & Global Sales Slump (holds at 6.5/10)
• EV rivalry heats up, and Tesla’s European and Chinese market share slumped significantly.
• Still a notable headwind.
________________________________________
✅10. Commodities & Raw Material Costs (holds at 5.5/10)
• Volatile raw material prices continue to affect margins; hedges help but don't eliminate the risk.
________________________________________
🚀11. Macro & Trade Policies (new 6/10)
• Tariff risks and global trade instability persist. Musk has warned of “rough quarters” ahead linked to these macro risks..
• Considered separately, worth tracking but less immediate than others.
________________________________________
Updated Catalyst Scorecard
Rank Catalyst Score
1 Autonomous & Robotaxi Execution 9
2 EV Demand Growth 9
3 Affordable Entry-Level Model 8.5
4 Battery Cost & Margin Improvement 8
5 Energy & AI Upside 8
6 U.S. EV Incentives 7.5
7 Safety, Regulatory & Governance Risk 7
8 Fed & Interest Rates 6.5
9 Competition & Global Sales Slump 6.5
10 Macro & Trade Policy Risks 6
11 Commodities & Raw Material Costs 5.5
________________________________________
📊Analyst Ratings & Price Targets (Updated)
• Median 12-month price target: ~$303–$307, implying slight downside from current ~$346..
• High-end bulls: Dan Ives (Wedbush) at $500; Benchmark raised to $475..
• Cautious voices: UBS remains bearish at $215, saying robotaxi upside may be priced-in..
• Wolfe Research: warns near-term earnings estimates are too optimistic, free cash flow may remain under pressure..
________________________________________
🔍Recent Headlines You Should Know
• Robotaxi launch in Austin, promoting optimism but drawing scrutiny..
• FSD & Optimus focus, backed by bullish commentary like “embodied AI compounder.”.
• EV credit tweak buys time for deliveries and demand..
• Fed hinting at rate cuts, offering cyclical lift..
• Q2 earnings miss on EPS and revenue, but autonomy/energy pushed narrative..
________________________________________
• Bull Case: Robotaxi and AI drive restore investor confidence, pushing targets toward $475–$500.
• Base Case: Steady but cautious—watch for execution on autonomous and cost-efficiency.
• Bear Case: Renewed delivery slumps, regulatory blowback, or failed rollout could weigh toward downside support in the $300–$330 range.
TSLA Weekly Options Setup:345C--Don’t Miss Out
# 🚀 TSLA Weekly Options Setup: Bullish Momentum Play w/ \$345C 🎯 (Aug 29 Expiry)
### 🔑 Multi-Model Summary
✅ RSI (Daily 60.1 → Weekly 65) = Bullish momentum
✅ VIX \~14.2 = Favorable volatility regime
⚠️ Weak weekly volume (0.9x) + neutral options flow (C/P \~1.10)
⚖️ Mixed models → Some lean bullish (\$345–355C), others prefer **no trade** due to weak institutional flow
---
### 📊 Recommended Trade (If You Take It)
* 🎯 **Instrument**: \ NASDAQ:TSLA
* 📈 **Direction**: Call (Long)
* 🎯 **Strike**: \$345C
* 💵 **Entry**: \~\$6.00 (limit at open)
* 🛑 **Stop**: \$3.60 (40% risk control)
* 🎯 **Target**: \$9.00 (+50%)
* 📅 **Expiry**: 2025-08-29
* 📏 **Size**: 1 contract (scalable)
* ⚡ **Exit**: By **Thursday close** (avoid Friday gamma decay)
* 🔒 **Confidence**: 65% (moderate conviction)
---
### ⚠️ Key Risks
* Weak volume = no big-money confirmation
* Event risk (SpaceX headlines)
* 5 DTE = aggressive theta decay
* Gamma swings → fast intraday moves
---
### 📌 Conclusion
Momentum favors upside, but lack of strong institutional confirmation = **medium conviction**.
👉 Conservative traders: wait.
👉 Active traders: \$345C is the best balance of **delta, liquidity, and leverage** this week.
---
### 🔥 Hashtags
\#TSLA #OptionsTrading #WeeklyOptions #CallOptions #SwingTrade #DayTrading #MomentumTrading #OptionsFlow #BreakoutTrading #StockMarket 🚀📈💎🔥
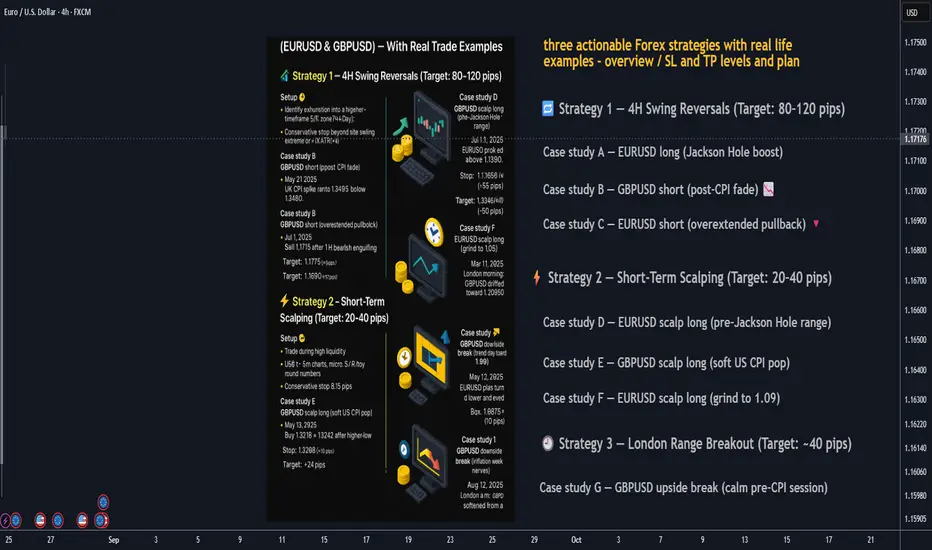
3 Actionable FX Strategies — With Real Trade Examples👋 Below are three practical strategies you can plug into your playbook today:
1. swing reversals (80+ pips), 2) short-term scalps (20–40 pips), and 3) the London range breakout (≈40 pips). Each section includes rules of engagement, risk management, and three real-market case studies on EURUSD and GBPUSD with conservative stops.
________________________________________
🔁 Strategy 1 — 4H Swing Reversals (Target: 80–120 pips)
Setup 🧩
• Identify exhaustion into a higher-timeframe S/R zone (4H/Day).
• Look for a reversal signal (engulfing/pin bar, momentum shift, or divergence) and a confirmation close.
• Conservative stop: beyond the swing extreme or ~1× ATR(14) on the entry timeframe.
• Take-profit: next HTF level or ≥ 1.8R, aiming for 80+ pips.
Case study A — EURUSD long (Jackson Hole boost) 📈
• When: Aug 22, 2025, NY session after Powell; EURUSD pushed above 1.1700 on broad USD weakness.
• Plan: After a 4H close back above 1.1700, buy a retest ~1.1705.
• Stop: 1.1650 (≈55 pips).
• Target: 1.1790 (≈85 pips).
Case study B — GBPUSD short (post-CPI fade) 📉
• When: May 21, 2025, UK CPI spike ran to 1.34695 then faded.
• Plan: After a 15–30m lower high below 1.3460, sell break of 1.3435.
• Stop: 1.3490 (≈55 pips).
• Target: 1.3345 (≈90 pips).
Case study C — EURUSD short (overextended pullback) 🔻
• When: Jul 1, 2025, EURUSD briefly poked above 1.1800 then eased.
• Plan: Sell 1.1775 after a 1H bearish engulfing.
• Stop: 1.1825 (≈50 pips).
• Target: 1.1690 (≈85 pips).
________________________________________
⚡ Strategy 2 — Short-Term Scalping (Target: 20–40 pips)
Setup 🧩
• Trade during high liquidity (London open or London/NY overlap).
• Use 1–5m charts: micro S/R + round numbers, quick momentum bursts.
• Conservative stop: 8–15 pips (just beyond the micro structure).
• Take-profit: 20–40 pips or to next intraday level.
Case study D — EURUSD scalp long (pre-Jackson Hole range) ⏱️
• When: Aug 21, 2025, Europe a.m.; EURUSD near 1.1650.
• Plan: Buy break-and-retest 1.1665.
• Stop: 1.1652 (≈13 pips).
• Target: 1.1687 (≈22 pips).
Case study E — GBPUSD scalp long (soft US CPI pop) 💥
• When: May 13, 2025, post-US CPI tone lifted risk; GBPUSD ~1.3226.
• Plan: Buy 1.3218 → 1.3242 after higher-low.
• Stop: 1.3208 (≈10 pips).
• Target: +24 pips.
Case study F — EURUSD scalp long (grind to 1.09) 🚀
• When: Mar 11, 2025, London morning; EURUSD nudged to 1.0890 / kissed 1.0900.
• Plan: Buy 1.0885 on retest.
• Stop: 1.0875 (≈10 pips).
• Target: 1.0905 (≈20 pips).
________________________________________
🕘 Strategy 3 — London Range Breakout (Target: ~40 pips)
Setup 🧩
• Mark the Asian/Late-Asia range before 08:00 London.
• Trade the first clean break/close outside the box.
• Entry: stop order beyond the box high/low.
• Conservative stop: opposite side of the box or box size + buffer (≤40–50 pips).
• Take-profit: ~40 pips (scale at 20 pips).
Case study G — GBPUSD upside break (calm pre-CPI session) 📦➡️📈
• When: Mar 25, 2025, London a.m.; GBPUSD drifted toward 1.2950.
• Box: 05:00–08:00 London ~22 pips.
• Plan: Buy box high +3 pips (≈1.2953).
• Stop: 1.2930 (≈23 pips).
• Target: 1.2993 (≈40 pips).
Case study H — EURUSD downside break (trend day toward 1.09) 📦➡️📉
• When: May 12, 2025, EURUSD bias turned lower and eyed the 1.09 handle.
• Box: 05:00–08:00 London ~28 pips.
• Plan: Sell box low −3 pips (≈1.0978).
• Stop: 1.1008 (≈30 pips).
• Target: 1.0938 (≈40 pips).
Case study I — GBPUSD downside break (inflation-week nerves) 📦➡️🔻
• When: Aug 12, 2025, London a.m.; GBPUSD softened from a two-week high.
• Box: 05:00–08:00 London ~24 pips.
• Plan: Sell box low −2 pips (≈1.3446).
• Stop: 1.3472 (≈26 pips).
• Target: 1.3406 (≈40 pips).
________________________________________
🛡️ Risk Management (applies to all three)
• Risk small per trade (e.g., 0.5–1%).
• Stops beyond structure: previous swing/box edge or ATR-based to avoid noise.
• News filter: avoid fresh entries seconds before major economic data.
________________________________________
🧰 Quick Checklists
Swing reversal (4H) ✅
🎯 Level picked • 📉 Reversal signal • 🛑 Stop beyond swing/ATR • 📐 ≥1.8R • 📰 No imminent shock
Scalp (1–5m) ✅
⏱️ Active session • 🔍 Micro S/R & round numbers • 🛑 8–15 pip stop • 🎯 20–40 pips • ✂️ Partial at +10–15
London breakout ✅
🕗 Box 05:00–08:00 • 📦 Reasonable width • 🚀 First break/close • 🛑 Stop other side • 🎯 ≈40 pips
________________________________________
⚠️ Final word
These examples show how setups map onto real market context. Adapt entries/levels to your feed and spreads. Nothing here is financial advice—test and size appropriately.
________________________________________
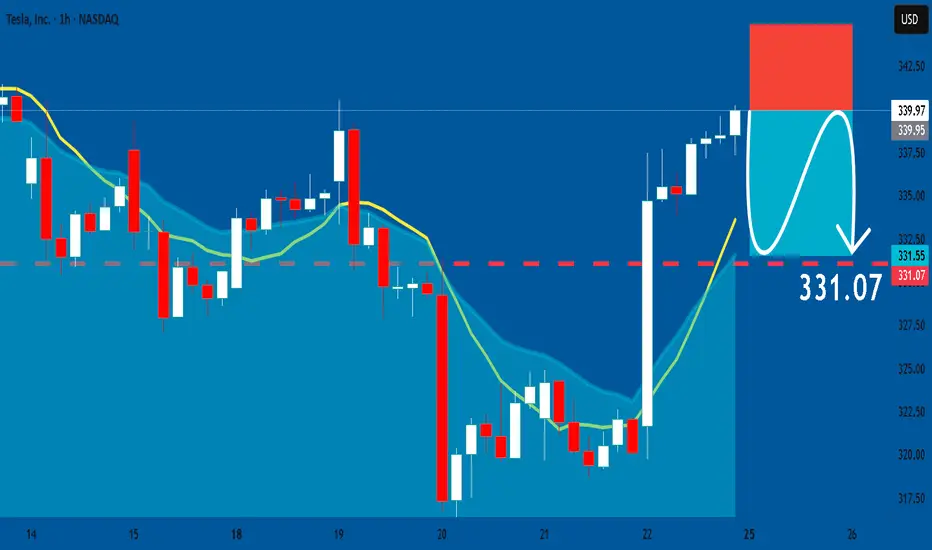
TESLA Will Collapse! SELL!
My dear friends,
Please, find my technical outlook for TESLA below:
The instrument tests an important psychological level 339.97
Bias - Bearish
Technical Indicators: Supper Trend gives a precise Bearish signal, while Pivot Point HL predicts price changes and potential reversals in the market.
Target - 332.22
Recommended Stop Loss - 344.40
About Used Indicators:
Super-trend indicator is more useful in trending markets where there are clear uptrends and downtrends in price.
Disclosure: I am part of Trade Nation's Influencer program and receive a monthly fee for using their TradingView charts in my analysis.
———————————
WISH YOU ALL LUCK
Is Fridays Bounce a Bull Trap?CME_MINI:NQ1! CME_MINI:ES1! stock market Forecast
Nvidia Stock NASDAQ:NVDA Forecast
Apple Stock NASDAQ:AAPL Forecast
Microsoft Stock MSFT Forecast
Google Stock GOOGL Forecast
Amazon Stock AMZN Forecast
Meta Forecast Technical Analysis
Tesla Stock TSLA Forecast
Magnificent 7 stocks forecast

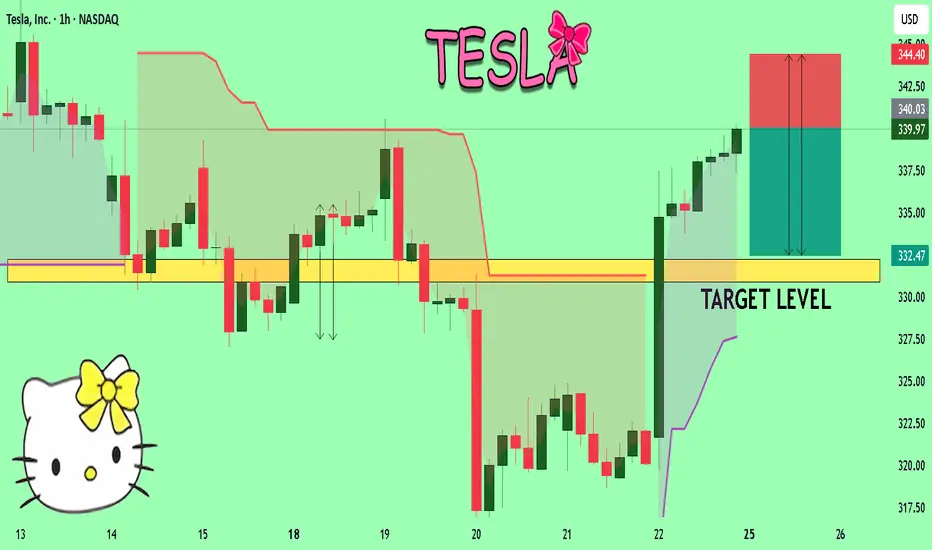
TESLA: Short Trading Opportunity
TESLA
- Classic bearish formation
- Our team expects fall
SUGGESTED TRADE:
Swing Trade
Sell TESLA
Entry Level - 339.97
Sl - 344.91
Tp - 331.07
Our Risk - 1%
Start protection of your profits from lower levels
Disclosure: I am part of Trade Nation's Influencer program and receive a monthly fee for using their TradingView charts in my analysis.
❤️ Please, support our work with like & comment! ❤️
NIO Trendline Break PossibleGood evening traders,
After NIO's rapid growth Pre-Covid, the company has failed to make a comeback. In my opinion this was due to its rapid growth and impulse move back in 2020. My rule with impulse moves is the market will tend to retrace 100% of its initial move.
Following the fall of NIO for the past several years, it has clearly been bouncing from a descending trendline and so far it has touched 4 times. I expect NIO to continue to drop, the $3.00'ish price seems to be a good price to enter with a possibility of it reach the $1.00 area. I'm expecting a breakout soon followed by a retracement back to the trendline and bounce up until is reaches the $27 dollar area. This is just the technical aspect of this analysis. Hope this helps some of you with your investments.
Don't forget to like and follow for more trading ideas & trading opportunities. Happy Trading!

$TSLA looks "Cheap" but it can always get cheaperTSLA has been consolidating in a flag here. While price could break up out of it, I actually lean towards price breaking to the downside. The reason is because there have been more tests on the downside, and I think if price falls and tests it again, it'll break.
That and, if you turn on Heikin Ashi candles, it looks like bearish momentum is starting on higher timeframes (1D-4D) and Ichimoku giving bearish warning signals in the cloud formation.
I think the most likely outcome is that we break lower and go test the box below for a new low. Everyone would get bearish down there, but that will be a great level to buy for the long term.

SPY WEEKLY LIVE RECORDED 21st AUG 2025This is the price action of SPY. I have clearly discussed the levels where charts are showing us the probability of buying levels.
If you have any doubts, feel free to leave a comment or DM me.
NOTE:FORGET ABOUT TRADING & FOCUS ON PROTECTING YOUR CAPITAL

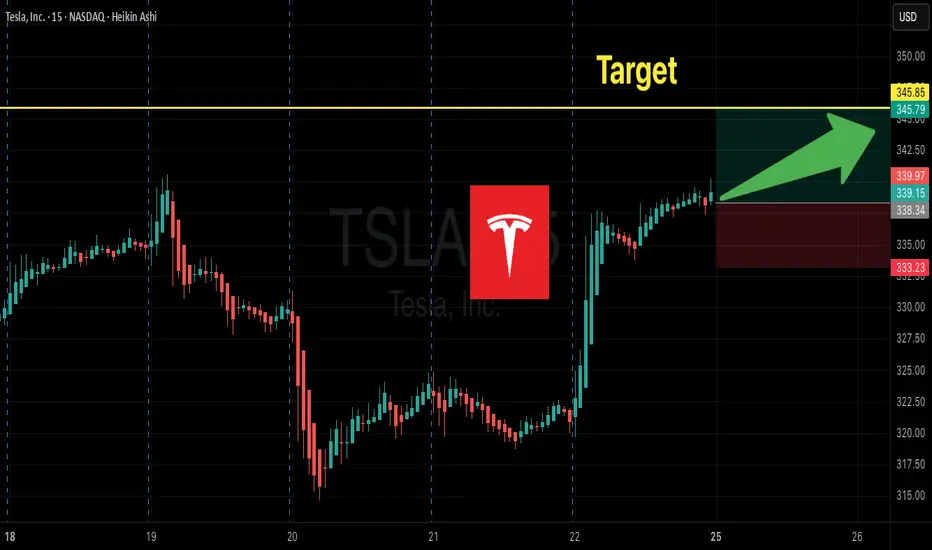
TESLA 20TH AUGUST 2025price action for Tesla is here. I have clearly explained my plan on how to trade tesla considering every factor in market.
NOTE: OPTION WILL BURN YOUR CAPITAL

TSLA daytrading (fill gap)1. tsla still have a gapp need to fill
2. tsla break down the trend line could pull back a little bit
* in the past tsla is not often fill fill the gap so just watch. dont put down