TSLA (Tesla) Long Set Up Entry Price 1: $432.00
Entry Price 2: $424.00
Stop Loss: $414.00
Take Profit 1: $442.00 (Close 25%)
Take Profit 2: $452.00 (Close 50%)
Take Profit 3: $462.00 (Close 75%)
Take Profit 4: $475.00 (Close 100%)
Tslaforecast
TSLA Trading at Key Gamma Level (435) — Volatility DecisionNASDAQ:TSLA 📊 | Price + Gamma Alignment
435 is the key.
🧲 Gamma Flip / HVL: 435
Above = controlled, range behavior
Below = volatility expansion
🔴 Resistance: 449 → 460
🟢 Support: 435 → 431 → 420
GEX still positive, but dealer support weakening.
Acceptance below 435 opens downside.
Trade price — let gamma explain why 🎯

TSLA Outlook : Momentum Still Favors the UpsideTesla continues to show strong price behavior, with momentum and structure still pointing higher. The move highlighted on the chart reflects controlled buying pressure and healthy continuation rather than signs of exhaustion. At this stage, the focus remains on staying aligned with the dominant flow and letting price confirm the bias, instead of trying to anticipate early reversals. As long as this momentum remains intact, the upside outlook stays firmly in play.
Disclosure: We are part of Trade Nation's Influencer program and receive a monthly fee for using their TradingView charts in our analysis.

Tesla - The next bullrun is coming!🚗Tesla ( NASDAQ:TSLA ) is clearly breaking out:
🔎Analysis summary:
In mid 2025, Tesla perfectly retested a major confluence of support. After Tesla then created bullish confirmation, the recent strong rally was totally expected. And with the current triangle breakout, Tesla is just starting its next major parabolic rally much higher.
📝Levels to watch:
$400 and $600
SwingTraderPhil
SwingTrading.Simplified. | Investing.Simplified. | #LONGTERMVISION

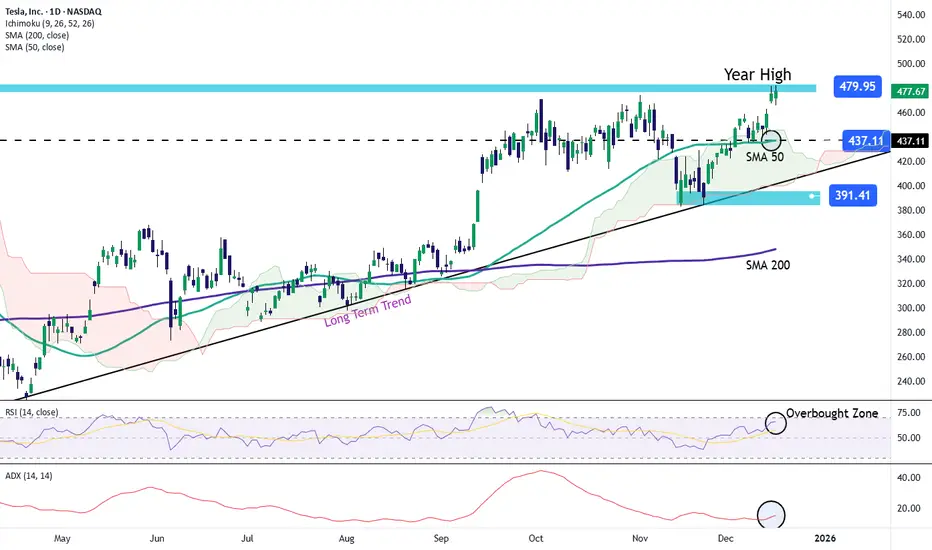
Tesla Stock Holds Strength and Breaks Above Yearly HighsTesla’s stock has achieved a streak of three consecutive bullish sessions, recording a gain of more than 5% over that period. For now, buying pressure has remained firm following recent announcements indicating that the company has confirmed unsupervised robotaxi testing, a development that could mark a significant milestone in Tesla’s autonomous vehicle program and become a project with major long-term impact. This announcement has reinforced confidence in the stock in recent sessions and may continue supporting consistent buying pressure in the coming days.
Long-Term Uptrend Remains Intact
It is important to remember that Tesla’s bullish movements have maintained a consistent upward trend since April of this year. In recent sessions, buying pressure has strengthened again, even pushing the price toward the 480-dollar zone — a level not seen consistently since December 2024.
If buying pressure remains stable in the short term, the long-term uptrend could continue dominating Tesla’s price action toward year-end. However, it is also important to consider that confronting current highs may create room for short-term bearish corrections.
RSI
At the moment, the RSI line continues to oscillate above the neutral 50 level, indicating that buying momentum still dominates short-term price action. However, the RSI is now approaching the overbought zone (70), which may signal a potential imbalance in momentum and open the door for short-term pullbacks.
ADX
The ADX line remains below the 20 level, suggesting a period of neutrality in average volatility over the last 14 sessions. This indicates that unless a stronger directional move occurs in the short term, a phase of persistent indecision may continue, potentially leading to temporary bearish corrections.
Key Levels to Watch:
480 dollars – Crucial resistance:
A level not seen since 2024 and a major high for 2025. Sustained buying above this level could reinforce the bullish bias and potentially push the price toward the psychological 500-dollar mark.
437 dollars – Nearby support:
This level aligns with the 50-period moving average and may act as initial support should short-term bearish corrections occur.
391 dollars – Final support:
This level corresponds to recent lows. A pullback toward this zone could reactivate a bearish bias and put the current bullish structure at risk.
Written by Julian Pineda, CFA, CMT – Market Analyst
Is Tesla Setting Up for a Rebound? Key Entry Levels Inside🎯 TSLA: The "Thief Strategy" Playbook | Swing/Day Trade Setup 📈
🔥 Quick Overview
Asset: Tesla, Inc. (TSLA)
Bias: 🐂 BULLISH
Strategy Type: Thief Layering Entry Method
Risk Level: Medium-High (Swing/Day Trade)
💰 The "Thief" Entry Strategy Explained
The "Thief Strategy" uses multiple limit orders (layering method) to accumulate position at different price levels. Think of it like setting traps at various floors of a building—you catch opportunities wherever price decides to visit! 🎣
📊 Entry Zones (Layer Your Orders):
Layer 1: $430.00
Layer 2: $435.00
Layer 3: $440.00
💡 You can add more layers based on your own risk appetite and account size. The beauty of layering? You average your entry and reduce timing risk!
🛡️ Stop Loss (SL):
Thief SL: $415.00
⚠️ Important Note: This is MY stop loss level based on the Thief Strategy framework. You're the captain of your own ship! 🚢 Adjust your SL based on YOUR risk tolerance and account management rules. Trade at your own risk—make money, take money, manage wisely!
🎯 Target (TP):
Primary Target: $490.00
🚨 Why $490? This zone represents a confluence of:
Strong resistance area
Potential overbought conditions
Historical trap zone where bulls get exhausted
📢 Thief OG's Reminder: I'm NOT saying you MUST take profit only at my TP level. If you see profits that make you smile, SECURE THEM! 💵 The market gives, and the market takes. Be greedy when you can, be smart always.
🔍 Technical Analysis Breakdown
Tesla is showing bullish momentum structure with potential for continuation toward the $490 resistance zone. The layering strategy allows us to build position as price potentially dips into demand zones before the next leg up.
Key Technical Levels:
Support Zone: $430-$440 (Our entry layers)
Invalidation: Below $415 (Stop loss)
Resistance Target: $490
📌 Related Pairs to Watch (Correlation Play)
Understanding correlated assets helps confirm your thesis:
AMEX:SPY (S&P 500 ETF)
TSLA often moves with broader market sentiment
Watch SPY for overall risk-on/risk-off environment
NASDAQ:QQQ (Nasdaq 100 ETF)
Tech-heavy index where TSLA is a major component
Strong correlation with TSLA price action
NASDAQ:NVDA (NVIDIA)
Both are high-beta tech growth stocks
Often move together during risk appetite shifts
TVC:DXY (US Dollar Index)
Inverse correlation: Strong dollar = pressure on growth stocks like TSLA
Weak dollar = tailwind for equities
💡 Key Point: If SPY/QQQ are bullish + DXY weakening = Strong confirmation for TSLA upside!
⚡ Trading Tips for Thief OG's
Don't FOMO — Let price come to your layers
Manage position size — Each layer should be equal weight
Trail your stop — Once profitable, protect gains
Watch volume — Confirm breakouts with volume spikes
Stay flexible — Market conditions change; so should you!
🎬 Final Words
This setup is all about patience, precision, and profit extraction! 🎯 The Thief Strategy isn't about stealing from the market—it's about being SMART and setting yourself up for success with calculated entries.
Remember: The best trades are the ones where you're prepared, not scared! 😎
✨ If you find value in my analysis, a 👍 and 🚀 boost is much appreciated — it helps me share more setups with the community!
#TSLA #TeslaStock #SwingTrading #DayTrading #ThiefStrategy #LayeringStrategy #StockMarket #TradingIdeas #TechnicalAnalysis #BullishSetup #TradingStrategy #RiskManagement #StockTrading #MarketAnalysis #TradingCommunity

Tesla - The triangle is still valid!🎀Tesla ( NASDAQ:TSLA ) can still confirm the breakout:
🔎Analysis summary:
Just two months ago, Tesla perfectly broke out of the major ascending triangle pattern. In the meantime we just witnessed a major consolidation at the all time high. Quite likely that Tesla will soon confirm the breakout, launching another parabolic rally from here.
📝Levels to watch:
$400
SwingTraderPhil
SwingTrading.Simplified. | Investing.Simplified. | #LONGTERMVISION

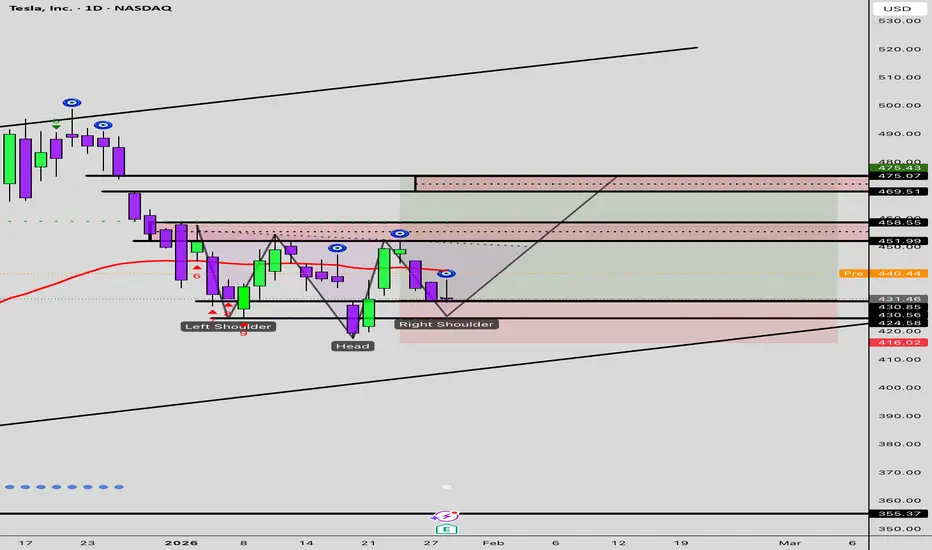
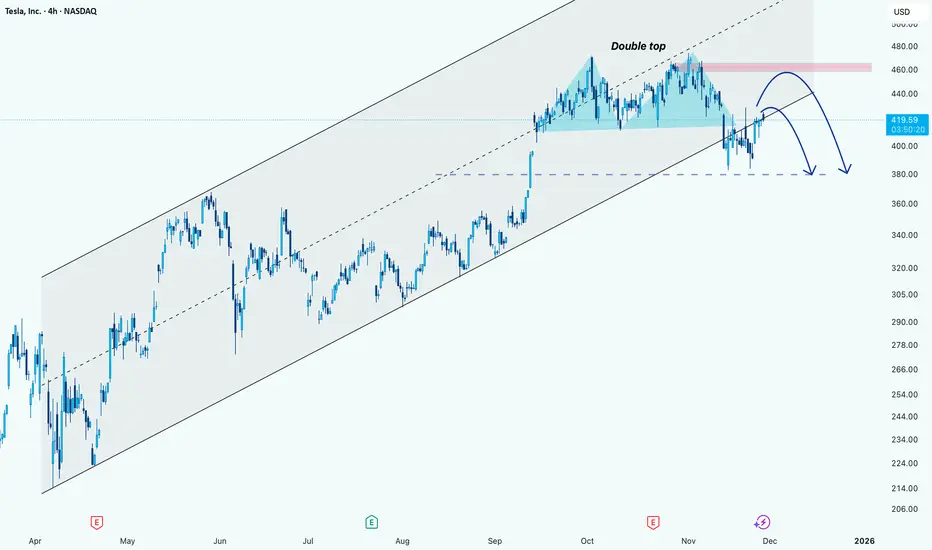
Tesla: A overview of itHi!
Trend Analysis:
TSLA has been trading in an ascending channel for several months, with higher highs and higher lows visible since April.
The recent price action broke above the midline of the channel but is currently consolidating near the $420-$425 area.
Pattern Formation:
A Double Top pattern near the $460 level formed.
This pattern signals a potential reversal if the price fails to break above the resistance zone (marked in pink).
The neckline of this double top appears around $400, which is also a key support zone.
Potential Price Action:
Short-term rebound:
TSLA could retest the resistance zone near $455-$460.
If it fails to break this area convincingly, the double top pattern could trigger a reversal.
Medium-term correction:
If the reversal occurs at the resistance zone, price may fall toward the neckline/support area near $380.
This aligns with the lower boundary of the channel and previous support levels.
Tesla - Withstanding all weakness!🏹Tesla ( NASDAQ:TSLA ) can still break out:
🔎Analysis summary:
Since Tesla was listed on the Nasdaq back in 2013, we witnessed a lot of triangle breakouts. And starting all the way back in 2020, Tesla once again created a bullish triangle. Last month we saw the breakout and this month we have to see the confirmation
📝Levels to watch:
$400
SwingTraderPhil
SwingTrading.Simplified. | Investing.Simplified. | #LONGTERMVISION

Tesla - Here comes the third breakout!🚀Tesla ( NASDAQ:TSLA ) is finally breaking out:
🔎Analysis summary:
For the past four years, Tesla has been trading in a very clear ascending triangle pattern. But just last month, we finally saw the expected bullish triangle breakout. Considering all of the previous triangle breakouts, Tesla is setting up for another parabolic rally soon.
📝Levels to watch:
$450
SwingTraderPhil
SwingTrading.Simplified. | Investing.Simplified. | #LONGTERMVISION

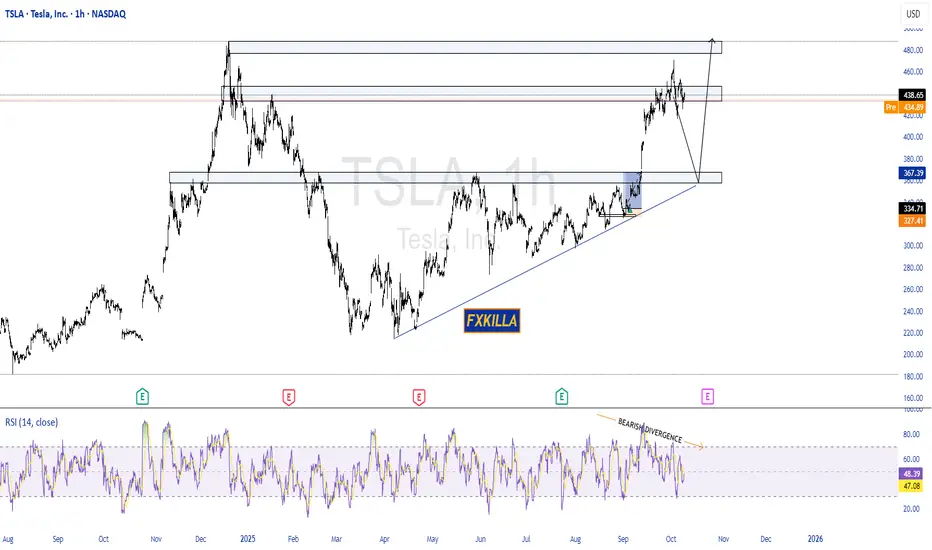
TESLA BIG SELL PROBABILITY SETUP SOON!!!🚨 TESLA HIGH PROBABILITY SELL SETUP 🚨
* Here We Can See Clearly The Next Potential Moves For TSLA Coming Hours/Days.
* Keep Your Eyes Close On Your Trading Positions.
* Happy PIP Hunting Traders.
FXKILLA.

TSLA is going UP! .. time to buy!Tsla aka Tesla was stuck in-between 2 powerful support and resistance zones (the red and green lines) .. It finally broke to the upside and broke above the resistance level. It is now very likely to head to the next resistance zone which was the previous high (the next resistance zone has been drawn as the white line shown on the chart) - this is where we will be taking profit at. BUY NOW!

Tesla - The massive triangle breakout!🪩Tesla ( NASDAQ:TSLA ) is breaking out:
🔎Analysis summary:
Last month, we witnessed an incredible but expected rally of about +35% on Tesla. Furthermore, with this move Tesla is attempting to break above the previous all time highs. After bullish confirmation, this would also lead to a massive triangle breakout.
📝Levels to watch:
$400
SwingTraderPhil
SwingTrading.Simplified. | Investing.Simplified. | #LONGTERMVISION

TSLA – Calm Before the Storm or Just Another Dip Buy?Tesla (TSLA) is trading around $315, bouncing off recent lows, but this isn’t just a clean technical setup. With Elon Musk’s political drama escalating (hello, “America Party”) and ongoing tension with Trump, TSLA is becoming a battleground stock with serious volatility.
As swing traders, that’s exactly where we thrive.
📍 Entry Plan
✅ Entry #1 – $315
✅ Entry #2 – $300
• Previous breakout zone — ideal for dip buyers
✅ Entry #3 – $265
• Strong macro support; only activated if market correction deepens.
🎯 Profit Targets
• TP1: $335
• TP2: $355
• TP3: 400+ – if sentiment + volume align with narrative momentum (think: Robotaxi or AI catalyst)
If $265 gets hit, I’m not panicking, I’m preparing for high-reward setups.
⚠️ Disclaimer: This is not financial advice. I’m just sharing my plan and technical zones. Always do your own research and manage your risk.
📌 Follow for more ideas based on price, narrative, and timing. Trade smart — not loud. 🧭📈

TESLA HIGH PROBABILITY SETUPS SOON!!!🚨 TESLA HIGH PROBABILITY SELL/BUY SETUPS 🚨
* Here We Can See Clearly The Next Potential Move For TSLA Coming Hours/Days.
* Keep Your Eyes Close On Your Trading Positions.
* Happy PIP Hunting Traders.
FXKILLA.
Tesla - Here we goooooo!🚗Tesla ( NASDAQ:TSLA ) is finally breaking out:
🔎Analysis summary:
Finally, after a consolidation of four years, Tesla is attempting another all time high breakout. With the bullish triangle coming to an end, bulls are dominating this stock. It just comes down to the next couple of months but a triangle breakout remains far more likely.
📝Levels to watch:
$400
SwingTraderPhil
SwingTrading.Simplified. | Investing.Simplified. | #LONGTERMVISION

Tesla - Technicals are pretty clear!🚨Tesla ( NASDAQ:TSLA ) respects the triangle:
🔎Analysis summary:
Ever since Tesla was listed on the Nasdaq, we saw perfect cycles playing out. Since 2021, Tesla has once again been consolidating within a bullish triangle pattern. Therefore with the recent bullish break and retest, it becomes more and more likely that Tesla will break out soon.
📝Levels to watch:
$400, $250
SwingTraderPhil
SwingTrading.Simplified. | Investing.Simplified. | #LONGTERMVISION

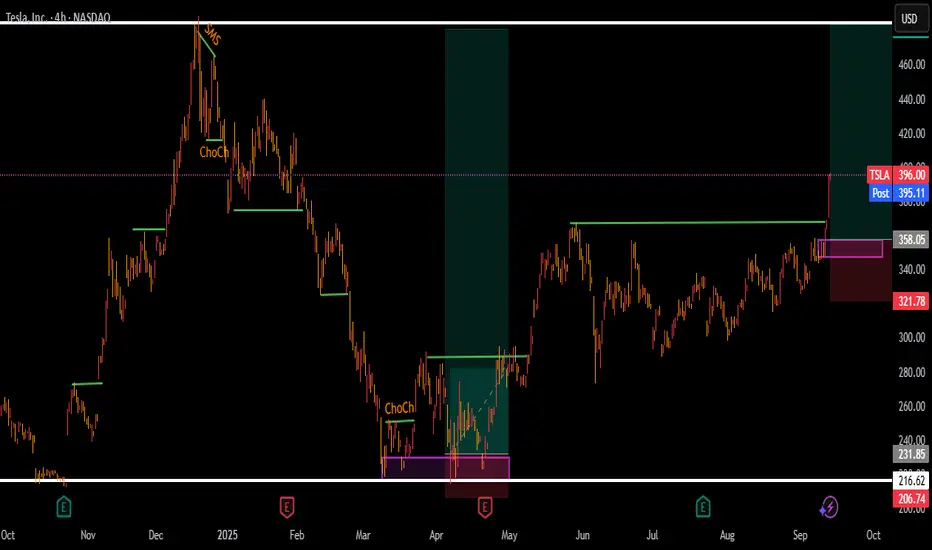
TESLA stock to gain more heights again!Tesla has finally broke out of that ardous consolidation it was in! investors can look for the buying opportunities for a probable pullback on a shown order block!
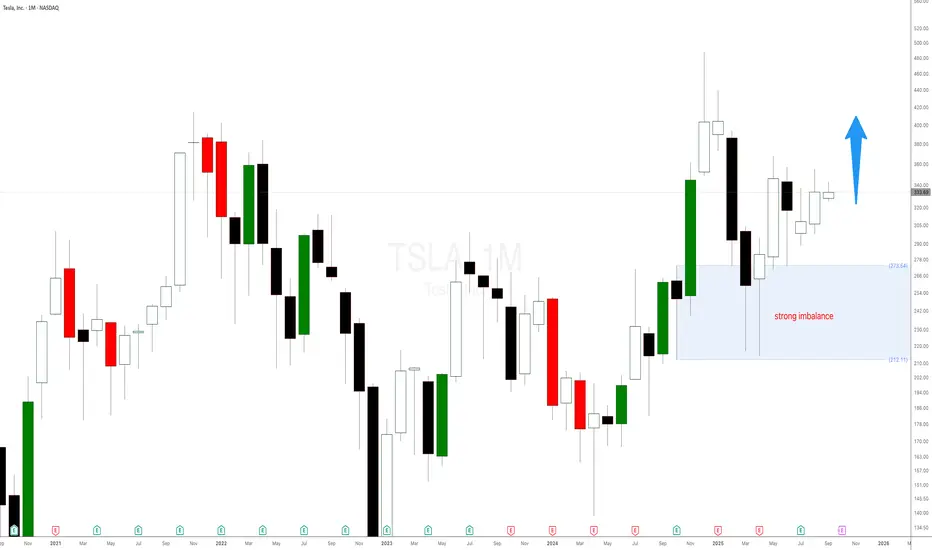
Tesla stock is printing new highs helped by the strong imbalanceTesla stock is printing new highs helped by the strong weekly imbalance as expected and mentioned in a previous Tesla stock analysis. The weekly demand level at $298 is playing out well. There is still a lot of room for NASDAQ:TSLA stock to keep on rallying. You can use the smaller timeframes to add more long positions or new imbalance to trade with even higher probability.
Tesla - The triangle is still valid!🚔Tesla ( NASDAQ:TSLA ) remains totally bullish:
🔎Analysis summary:
If we look at the chart of Tesla, we can see a very long term consolidation over the past four years. This, however, does not mean that the bullrun is over but rather preparing for the next bullish move. We just have to wait for the bullish ascending triangle pattern breakout.
📝Levels to watch:
$400
SwingTraderPhil
SwingTrading.Simplified. | Investing.Simplified. | #LONGTERMVISION

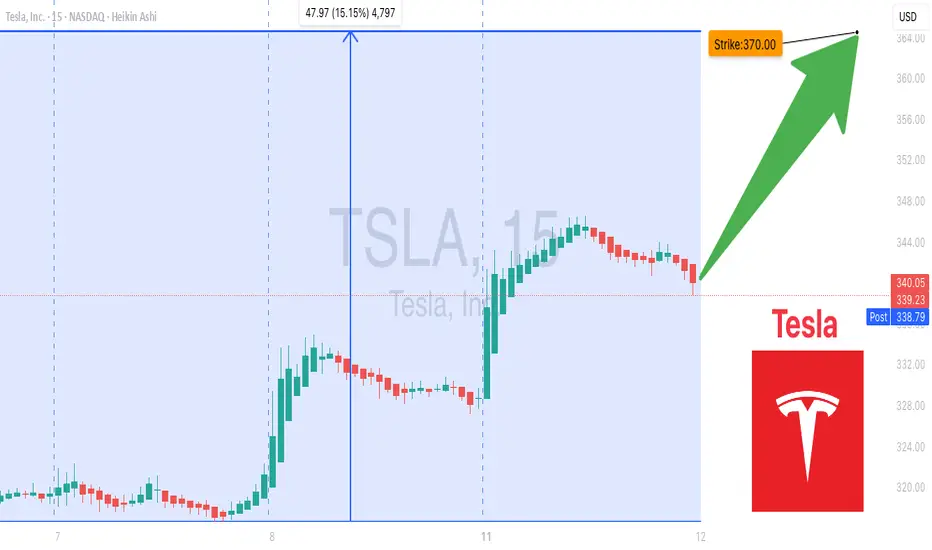
TSLA Momentum Unstoppable To $370— Don’t Miss Out! 🚀 TSLA Weekly Options Analysis — Bullish Momentum Confirmed! (2025-08-11) 🚀
### 🔥 Key Highlights:
* **RSI Signals Bullish:** Daily RSI at **59.5**, Weekly RSI at **54.9** — momentum is building strong!
* **Massive Weekly Gain:** +13.62% this week, breaking past key moving averages & resistance levels.
* **Options Flow:** Call/Put ratio at **1.77** — traders and institutions betting big on upside!
* **Volatility:** VIX low at **15.8** — ideal environment for bullish directional trades.
* **⚠️ Volume Caution:** Weekly volume at **0.8x** last week — watch closely for institutional commitment shifts.
---
### 📈 Consensus:
Most models say: **BULLISH** ✅
* Momentum + Options Flow + Low Volatility = Perfect setup
* Volume dip is a caution flag but not a dealbreaker (yet).
---
### 🎯 Trade Setup: Buy Calls on TSLA
| Parameter | Details |
| ----------------- | ------------------------------------ |
| **Strike** | \$370 |
| **Expiry** | Aug 15, 2025 |
| **Entry Price** | \$0.53 (market open) |
| **Stop Loss** | \$0.26 (50% loss) |
| **Profit Target** | \$1.06 (100% gain) |
| **Position Size** | Risk 2-4% of account (1-2 contracts) |
---
### ⚠️ Risk Management & Notes
* Moderate gamma risk — manage actively as expiry nears
* Watch volume trends for sudden shifts
* Confidence level: **75%** — strong bullish signals but stay nimble!
---
### 📊 JSON Trade Snapshot for Algo Fans
```json
{
"instrument": "TSLA",
"direction": "call",
"strike": 370.00,
"expiry": "2025-08-15",
"confidence": 0.75,
"profit_target": 1.06,
"stop_loss": 0.26,
"size": 2,
"entry_price": 0.53,
"entry_timing": "open",
"signal_publish_time": "2025-08-11 14:59:39 UTC-04:00"
}
```
---
💡 **TL;DR:** TSLA’s weekly surge + bullish options flow make \$370 calls a compelling play this week. Manage risk, watch volume, and aim for that 2x profit target!
Tesla - The all time high breakout!🚗Tesla ( NASDAQ:TSLA ) will break out soon:
🔎Analysis summary:
For the past five years Tesla has overall been consolidating between support and resistance. But following the recent bullish break and retest, bulls are slowly taking over control. It is actually quite likely that Tesla will soon break above the previous all time highs.
📝Levels to watch:
$400
🙏🏻#LONGTERMVISION
SwingTraderPhil

TSLA Don't Miss Out
### 🔥 TradingView Viral Post Format 🔥
---
### 📢 **Title:**
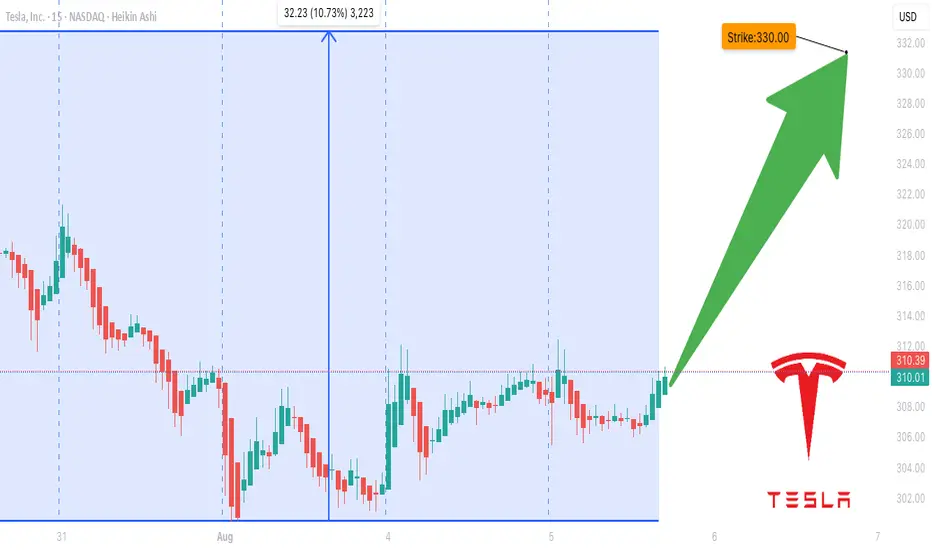
**TSLA Options Surge? \$330 Call Could Double in 3 Days — Here's the Setup** 🚀📈
---
### 📝 **Description:**
Tesla’s options market is flashing **moderate bullish signals** this week! 📊
✔️ Call/Put Ratio: **1.39** (Bullish)
✔️ RSI (Daily & Weekly): **Rising**
⚠️ Volume is light, but sentiment leans bullish.
🎯 **Trade Idea:**
Buy TSLA \$330 Call (Exp: Aug 8)
💰 Entry: \$0.85
🎯 Target: \$1.70
🛑 Stop: \$0.43
⏱️ Confidence: 65%
⚡ Gamma risk rising with time decay — tight execution is key.
Is this the breakout or a bull trap? Let’s watch it play out 👀
👇 Drop your thoughts or setups in the comments!
---
### 🏷️ **Tags (for TradingView):**
```
#TSLA #Tesla #OptionsTrading #CallOptions #BullishSetup #TSLAOptions #StockMarket #WeeklySetup #TradingStrategy #TechnicalAnalysis #TradeIdea #MomentumTrade #UnusualOptionsActivity #TradingView