Tesla Reversal Signal Triggered at the 200 SMA!TSLA 🚗 Bullish Pullback Playbook — Smart Layered Entry Setup!
📈 Asset:
TSLA — Tesla Inc. (NASDAQ)
Swing Trade Playbook | Trend-Continuation Setup
🧠 Market Thesis
TSLA shows a bullish pullback into the 200-Day Simple Moving Average, a level historically respected by trend-followers. The latest Heikin-Ashi Doji Reversal signals buyers regaining momentum ⚡ — suggesting the pullback is stabilizing and demand is stepping back in.
This combination of trend support + reversal confirmation forms the core of this structured swing setup.
🎯 Plan Overview
A clean bullish continuation strategy using a refined layered entry method (professionally framed as “scaled limit entries”). This maintains your signature thief-style energy, but aligned with TradingView rules and presentation standards. 😎
🟢 Entry Plan (Layered / Scaled Limit Orders)
Using a scaling approach allows better average pricing during volatility.
Proposed buy-limit layers:
Buy Limit 1 → $420.00
Buy Limit 2 → $410.00
Buy Limit 3 → $400.00
👉 Traders may increase or reduce the number of layers based on risk tolerance and personal strategy.
🔻 Stop-Loss (Risk Control)
A defensive stop-loss is placed near $380.00, below recent liquidity pockets and under the 200 SMA structure.
⚠️ This level is optional — traders should select their own SL based on personal risk management.
🎯 Take-Profit Zone
Target area sits around $470.00, where:
Major historical resistance awaits
Overbought conditions often develop
High-volume sellers tend to re-enter
This zone is treated as a profit-taking escape point, but traders can exit based on their own judgment.
📡 Related Markets to Watch (Correlation Insight)
Keeping the global view helps improve trade confidence:
NASDAQ:QQQ — High correlation with mega-cap tech, TSLA often follows Nasdaq momentum.
NASDAQ:NDX — Strong tech index correlation; strength supports TSLA continuation.
SP:SPX — Broad-market risk sentiment gauge.
NASDAQ:NVDA / NASDAQ:AMD — Momentum flow in growth-tech impacts liquidity rotation into TSLA.
AMEX:XLY — Consumer Discretionary ETF (TSLA is a major component).
Key takeaway:
Strong tech-sector momentum + risk-on environment = enhanced TSLA bullish continuation probability 📊⚡
🧰 Notes for the Community
Dear Traders (Thief OG-style Family 😄) —
SL/TP levels shared here are only examples for educational purposes. You’re always free to manage your own positions using your own risk preferences. Trade smart, trade safe, trade stylish. 💼✨
✨ “If you find value in my analysis, a 👍 and 🚀 boost is much appreciated — it helps me share more setups with the community!”
This is a thief-style trading strategy presentation strictly for fun and educational purposes. Not financial advice.
#TSLA #Tesla #SwingTrade #BullishSetup #LayeredEntries #HeikinAshi #200SMA #NASDAQ #MomentumTrading #TechnicalAnalysis #TradingView #RiskManagement #TraderLifestyle #StockMarket
Tslasignal

TSLA: Wave 4 or Explosive Momentum – Get Ready for a Big MoveTSLA: Wave 4 or Explosive Momentum – Get Ready for a Big Move
📈 Weekly Scenarios
Bullish scenario:
The price holds the $436–$449 zone, ending the correction with wave 4.
Breaks above $470–$471, triggering wave 5 → target of $488–$505+.
Consolidation:
The price is in the $436–$471 range, without a clear breakout, preparing for the next impulse.
Bearish scenario:
Breakthrough of support at $425–$397 → possible reversal or deep correction instead of growth.
✅ Conclusion
Tesla is at an important wave crossroads – it either completes the correction and prepares for a strong rally, or reverses downward.
Key points to watch: $436–$449 (correction support) and $470–$471 (resistance breakout).
Confirmation of the wave structure and price reaction at these levels will be critical for making trading decisions.
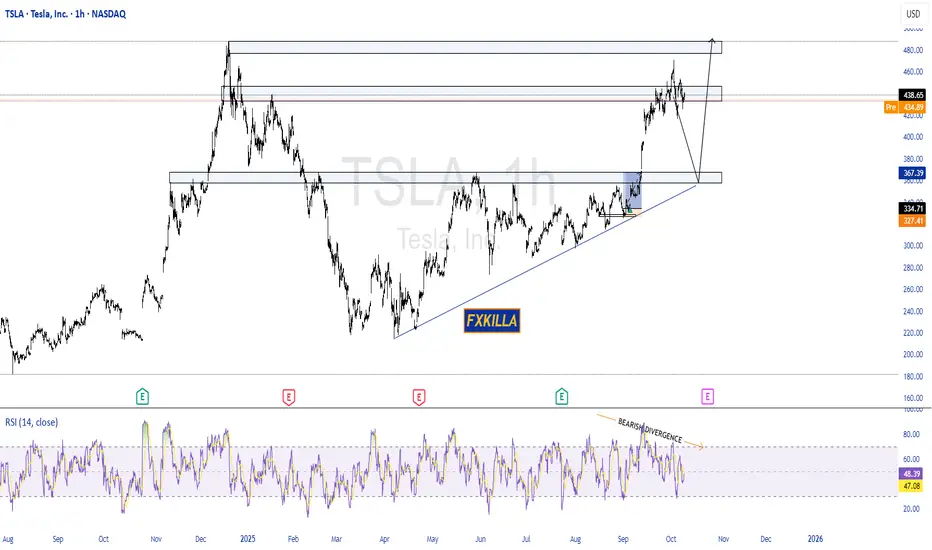
TESLA BIG SELL PROBABILITY SETUP SOON!!!🚨 TESLA HIGH PROBABILITY SELL SETUP 🚨
* Here We Can See Clearly The Next Potential Moves For TSLA Coming Hours/Days.
* Keep Your Eyes Close On Your Trading Positions.
* Happy PIP Hunting Traders.
FXKILLA.

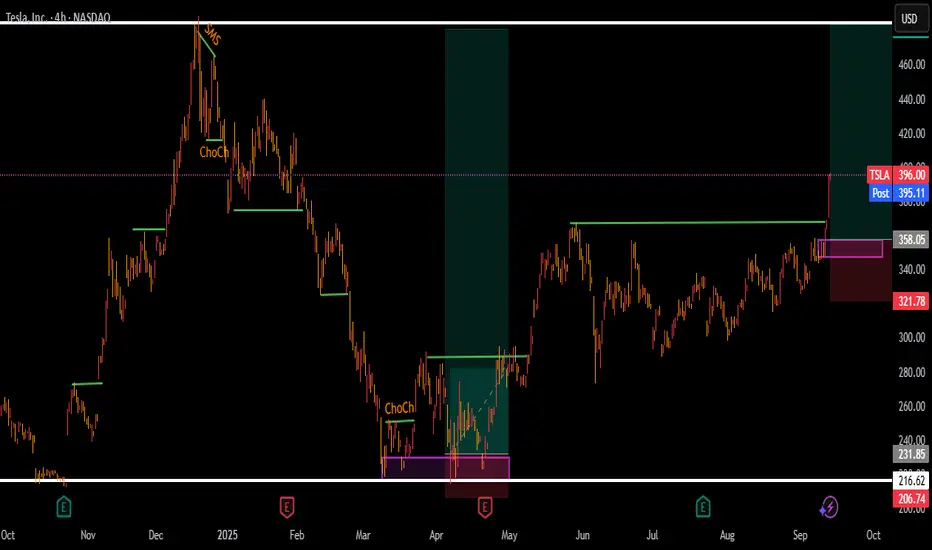
TESLA HIGH PROBABILITY SETUPS SOON!!!🚨 TESLA HIGH PROBABILITY SELL/BUY SETUPS 🚨
* Here We Can See Clearly The Next Potential Move For TSLA Coming Hours/Days.
* Keep Your Eyes Close On Your Trading Positions.
* Happy PIP Hunting Traders.
FXKILLA.
TESLA stock to gain more heights again!Tesla has finally broke out of that ardous consolidation it was in! investors can look for the buying opportunities for a probable pullback on a shown order block!
TSLA $375 Call –Momentum + Options Flow Edge!
⚡ **TSLA 1‑Day Earnings/Weekly Scalp!**
📅 **Expiry:** 2025-09-12
🎯 **Strike:** \$375 CALL
💵 **Entry:** \$1.38 (Ask)
🛑 **Stop Loss:** \$0.69 → strict 50%
📈 **Profit Target:** \$2.07 (\~+50%)
📊 **Confidence:** 70% (Moderate Bullish)
⏰ **Entry Timing:** Market Open
💎 **Why This Trade:**
* Multi-timeframe momentum bullish (daily RSI 70.4, weekly RSI 67.8)
* Institutional call flow C/P = 1.57 → strong directional skew
* Low VIX (14.9) supports call buying
* Balanced strike with high liquidity (OI 16,237)
* Quick scalp: exit by Thursday close — avoid Friday gamma crush
⚠️ **Key Risks:**
* 1 DTE → extreme gamma & theta decay
* Underlying volume moderate → pullbacks possible
* News can reverse the move rapidly
* Use **small position sizing** (1–3% max risk)
💡 **Execution Tips:**
* Use limit at ask (\$1.38) or slightly better for control
* Hard stop at \$0.69
* Scale out at \$2.07 or partial at \$1.80
* Monitor intraday VWAP & price action; abort if momentum stalls
🎯 **Quick Take:** Cheap, high-conviction 1-day scalp with defined risk & asymmetric upside. Fast in, fast out, gamma-aware trade.

TSLA $352.50 Call—Capture Momentum Before Thursday!Here’s a **TradingView-friendly, viral-ready summary** for your TSLA weekly trade with punchy readability and attractive titles:
---
⚡ **TSLA Weekly Options Alert — Tactical Short-Duration Play**
**Directional View:** **Moderate Bullish** 💹
**Confidence:** 65%
**Trade Setup:**
* **Instrument:** TSLA
* **Strategy:** BUY CALL (single-leg)
* **Strike:** \$352.50
* **Expiry:** 2025-09-12 (4 DTE)
* **Entry Price:** \$5.00
* **Entry Timing:** Market Open
* **Size:** 1 contract
**Targets & Risk:**
* **Profit Target:** \$8.00 (\~60%+ gain)
* **Stop Loss:** \$2.50 (\~50% loss)
* **Max Hold:** No later than Thursday close (avoid Friday gamma/theta)
**Why This Trade?**
✅ Options Flow: Call/Put skew 1.35 → institutional call concentration \$350–\$355
✅ Daily Momentum: RSI 58.5 rising → near-term bullish signal
✅ Volatility: Low VIX (\~15–16) → cheaper premium, supportive environment
✅ Strike & Liquidity: \$352.50 slightly OTM with strong OI (5,781)
**Key Risks:**
⚠️ Weak weekly volume (0.9x) → institutional confirmation limited
⚠️ Short DTE → high theta/gamma; strict stop mandatory
⚠️ Negative news/catalyst risk → potential gap or intraday pullback
⚠️ Bid/ask spreads → manage fills carefully
**Quick Takeaway:**
* Tactical, short-duration directional trade leveraging **options flow + daily momentum**
* Strict risk management: **50% stop + exit by Thursday**
* Not high-conviction (>75%) — suitable for **speculative, nimble traders**
**Alternate Strikes / Ideas:**
* None provided — \$352.50 balances premium and upside potential for this 4-DTE window
---
📊 **TRADE DETAILS (JSON for precision)**
```json
{
"instrument": "TSLA",
"direction": "call",
"strike": 352.5,
"expiry": "2025-09-12",
"confidence": 0.65,
"profit_target": 8.00,
"stop_loss": 2.50,
"size": 1,
"entry_price": 5.00,
"entry_timing": "open",
"signal_publish_time": "2025-09-08 11:49:21 UTC-04:00"
}
```
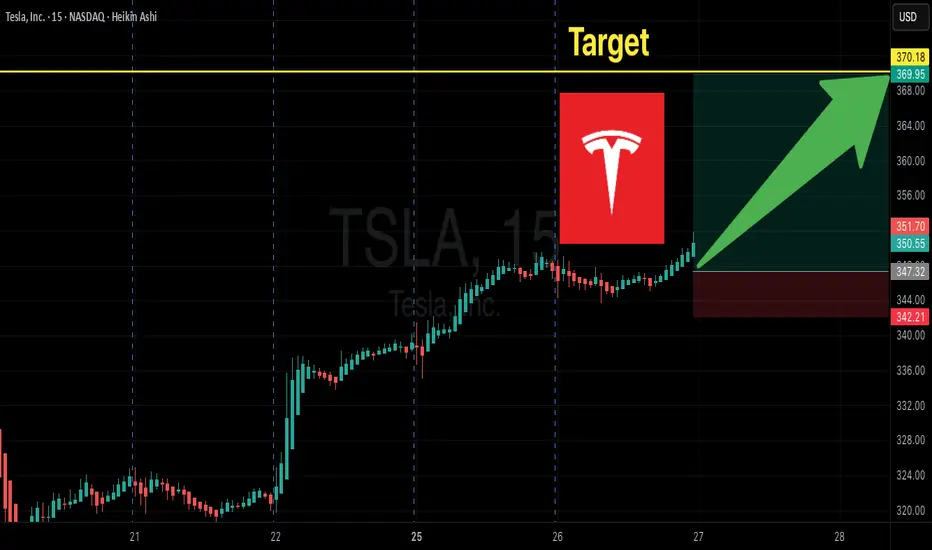
Tesla Options Flow Signals BIG Upside! $370C Momentum Trade
# 🚀 TSLA Weekly Options Setup | 370C Targeting 100%+ 📈
### 🔑 Key Highlights
* **Momentum:** RSI rising on both Daily (63.5) & Weekly (68.4) ✅
* **Options Flow:** Strong bullish skew (C/P = 1.79) 🟢
* **Volume:** Weak overall (0.9x), but institutional spike into close ⚡
* **Volatility:** VIX low → favorable for directional calls 😎
---
### 📊 Trade Setup (Consensus Pick)
* 🎯 **Instrument:** TSLA Weekly Call
* 💵 **Strike:** \$370C
* 📅 **Expiry:** 2025-08-29
* 💰 **Entry:** \$0.98 (ask) — open
* 🛑 **Stop:** \$0.49 (-50%)
* 🎯 **Target:** \$1.96 (+100%)
* ⏳ **Max Hold:** Close by **Thursday EOD** to avoid Friday theta/gamma crush
---
### 📌 Why \$370C?
* Best **liquidity** (OI \~18,450, vol 20k) → tightest fills ✅
* Balanced **delta & leverage** for short-term momentum 🎯
* Aligns with most model recommendations 📊
---
### ⚠️ Risks to Watch
* 🔻 **Theta decay** accelerates mid-week → avoid holding to Friday
* 🔻 **Gap risk** at open — manage entries with limit orders
* 🔻 **Market reversal** can kill momentum fast
---
## ✅ Final Verdict: **Strong Weekly Bullish Bias**
TSLA looks primed for an upside push — \$370C is the sweet spot for this week’s expiry.
---
### 🔥 Hashtags
\#TSLA #OptionsTrading #WeeklyOptions #StocksToWatch #MomentumTrading #TradingSignals #CallOptions #BullishSetup #TeslaStock
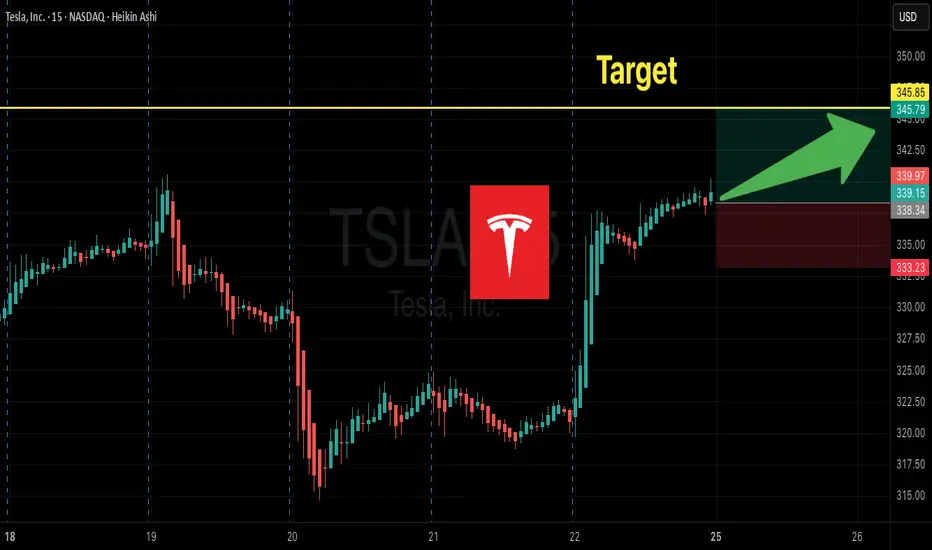
TSLA Weekly Options Setup:345C--Don’t Miss Out
# 🚀 TSLA Weekly Options Setup: Bullish Momentum Play w/ \$345C 🎯 (Aug 29 Expiry)
### 🔑 Multi-Model Summary
✅ RSI (Daily 60.1 → Weekly 65) = Bullish momentum
✅ VIX \~14.2 = Favorable volatility regime
⚠️ Weak weekly volume (0.9x) + neutral options flow (C/P \~1.10)
⚖️ Mixed models → Some lean bullish (\$345–355C), others prefer **no trade** due to weak institutional flow
---
### 📊 Recommended Trade (If You Take It)
* 🎯 **Instrument**: \ NASDAQ:TSLA
* 📈 **Direction**: Call (Long)
* 🎯 **Strike**: \$345C
* 💵 **Entry**: \~\$6.00 (limit at open)
* 🛑 **Stop**: \$3.60 (40% risk control)
* 🎯 **Target**: \$9.00 (+50%)
* 📅 **Expiry**: 2025-08-29
* 📏 **Size**: 1 contract (scalable)
* ⚡ **Exit**: By **Thursday close** (avoid Friday gamma decay)
* 🔒 **Confidence**: 65% (moderate conviction)
---
### ⚠️ Key Risks
* Weak volume = no big-money confirmation
* Event risk (SpaceX headlines)
* 5 DTE = aggressive theta decay
* Gamma swings → fast intraday moves
---
### 📌 Conclusion
Momentum favors upside, but lack of strong institutional confirmation = **medium conviction**.
👉 Conservative traders: wait.
👉 Active traders: \$345C is the best balance of **delta, liquidity, and leverage** this week.
---
### 🔥 Hashtags
\#TSLA #OptionsTrading #WeeklyOptions #CallOptions #SwingTrade #DayTrading #MomentumTrading #OptionsFlow #BreakoutTrading #StockMarket 🚀📈💎🔥
TSLA $365 Calls Heating Up – Big Move Ahead, Don’t Miss Out! 🚀 TSLA Weekly Options Analysis (2025-08-17) – Don’t Miss Out!
### 🔎 Model Insights Recap
**Grok/xAI Report**
* 📊 Signals: Bullish RSI + Options Flow + Volatility
* 🔊 Volume: Weak → ⚠️ caution
* 🛑 Decision: **No trade** (mixed confirmations)
**Gemini/Google Report**
* 📊 RSI: Rising (Weekly 63.7 = bullish momentum)
* 📈 Call/Put Ratio: **1.58** → institutional bullish bias
* ✅ Decision: **Buy \$365 Call** (Moderate Bullish)
**Claude/Anthropic Report**
* 📊 Weekly trend & call flow strong
* 🔊 Volume weak = confidence tempered
* ✅ Decision: **Buy \$340 Call** w/ strict risk mgmt
**Llama/Meta Report**
* 📊 Weekly momentum bullish, daily RSI neutral
* 📈 Options Flow: Positive
* 🔊 Volume: Weak
* ✅ Decision: **Buy \$352.50 Call**, targeting moderate gains
---
### 📌 Agreement
✔️ All models = **Moderate Bullish** bias (weekly RSI strength + options flow)
✔️ Key driver = **institutional positioning** & favorable volatility
### 📌 Disagreement
⚖️ Grok → **No trade** (volume too weak)
⚖️ Gemini/Claude/Llama → **Bullish calls** w/ different strikes & risk levels
---
## 📊 Recommended Trade Setup
* **Direction:** CALL (Long)
* **Strike:** \$365
* **Expiry:** 2025-08-22
* **Entry Price:** \$0.65 (limit order)
* **Stop Loss:** \$0.32 (50% premium)
* **Profit Target:** \$1.30 (100% return)
* **Strategy:** Single-leg naked calls
* **Entry Timing:** Market Open
* **Confidence:** 65%
---
### ⚠️ Key Risks
* Weak **volume** = 🚫 risk of failed breakout
* Must monitor **follow-through** carefully → momentum may stall without institutional push
---
## 📌 Final Outlook
**TSLA = Moderate Bullish Bias** ✅
Institutional call flow supports upside, but weak volume = proceed with **tight risk management**.
---
📊 **TRADE DETAILS JSON**
```json
{
"instrument": "TSLA",
"direction": "call",
"strike": 365.0,
"expiry": "2025-08-22",
"confidence": 0.65,
"profit_target": 1.30,
"stop_loss": 0.32,
"size": 1,
"entry_price": 0.65,
"entry_timing": "open",
"signal_publish_time": "2025-08-17 09:22:38 EDT"
}
```

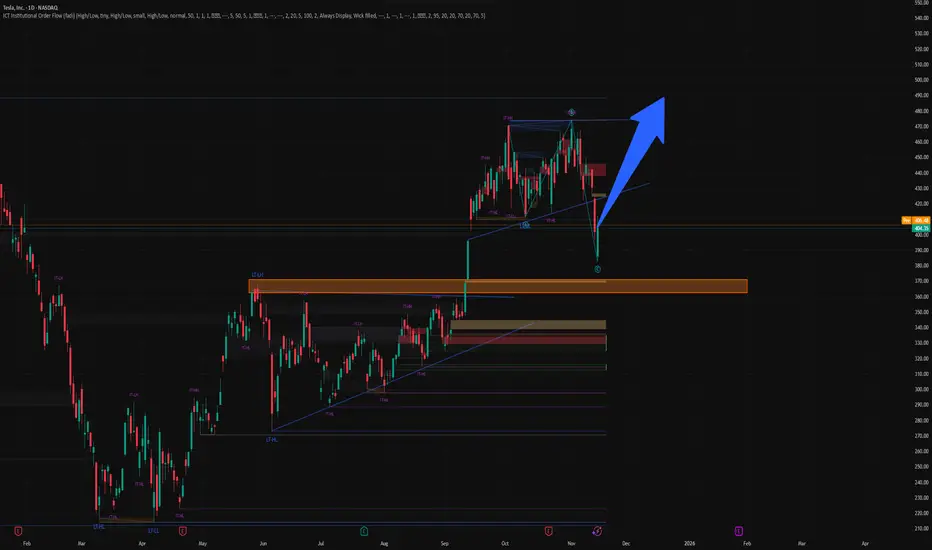
TESAL HEADING TO $500+ RANGE ANALYSIS HERE Afternoon Trading Fam
So here is our in-depth look at Tesla: Currently the monthly trend is bullish giving us levels of $500 and above.
Locally though we can break this $338 top expect to see $444 and $480 getting hit next
If we need to correct and we break the lows of $319 expect to see the levels of $307 then $301 being hit
Happy Trading
Trade Smarter Live Better
Kris

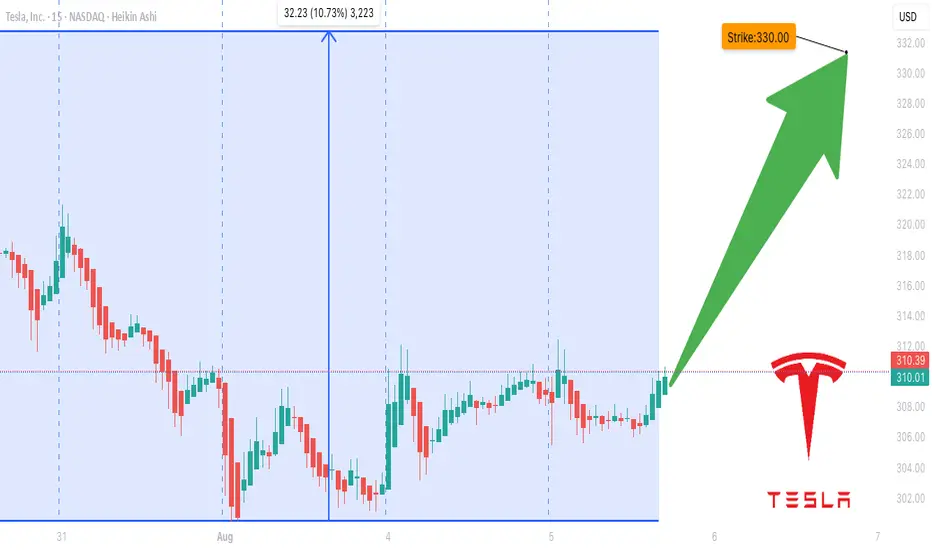
TSLA Don't Miss Out
### 🔥 TradingView Viral Post Format 🔥
---
### 📢 **Title:**
**TSLA Options Surge? \$330 Call Could Double in 3 Days — Here's the Setup** 🚀📈
---
### 📝 **Description:**
Tesla’s options market is flashing **moderate bullish signals** this week! 📊
✔️ Call/Put Ratio: **1.39** (Bullish)
✔️ RSI (Daily & Weekly): **Rising**
⚠️ Volume is light, but sentiment leans bullish.
🎯 **Trade Idea:**
Buy TSLA \$330 Call (Exp: Aug 8)
💰 Entry: \$0.85
🎯 Target: \$1.70
🛑 Stop: \$0.43
⏱️ Confidence: 65%
⚡ Gamma risk rising with time decay — tight execution is key.
Is this the breakout or a bull trap? Let’s watch it play out 👀
👇 Drop your thoughts or setups in the comments!
---
### 🏷️ **Tags (for TradingView):**
```
#TSLA #Tesla #OptionsTrading #CallOptions #BullishSetup #TSLAOptions #StockMarket #WeeklySetup #TradingStrategy #TechnicalAnalysis #TradeIdea #MomentumTrade #UnusualOptionsActivity #TradingView
TSLA Weekly Bearish Play — August 2, 2025
🔻 **TSLA Weekly Bearish Play — August 2, 2025** 🔻
🚨 **Multi-Model Consensus Signals a Tactical Put Opportunity**
### 🔍 Market Snapshot:
* **Daily RSI:** 39.9 (Bearish)
* **Weekly RSI:** 53.2 → Falling
* **Volume:** Weak (0.8x last week)
* **Options Flow:** Neutral (C/P Ratio \~1.04)
* **VIX:** 20.38 → Favorable for Options Plays
* **Institutional Support:** Weak
---
### 🔮 Model Consensus:
📉 **All major models (xAI, Google, Claude, Meta, DeepSeek)** confirm:
* Bearish momentum on both daily + weekly RSI
* Weak volume = cautious institutional behavior
* Volatility setup perfect for short-dated puts
---
### 🎯 Viral Trade Setup:
**💥 Trade Type:** PUT (Short TSLA)
**🔻 Strike:** \$300
**📆 Expiry:** 2025-08-08
**💰 Entry Price:** \$6.65
**🎯 Target Exit:** \$10.64 – \$13.30 (60%-100% gain)
**🛑 Stop Loss:** \$3.99
**📊 Confidence:** 65%
**📍 Entry Timing:** Monday open
**🕒 Signal Timestamp:** 2025-08-03 01:33:56 EDT
---
### ⚠️ Key Levels:
* Support to watch: **\$297.82**
* News/event risks: Stay alert ⚡
* Use tight risk controls for weekly plays!
---
🔥 **If you trade TSLA — don’t sleep on this one.**
Bearish consensus + clean setup = **high-probability weekly play.**

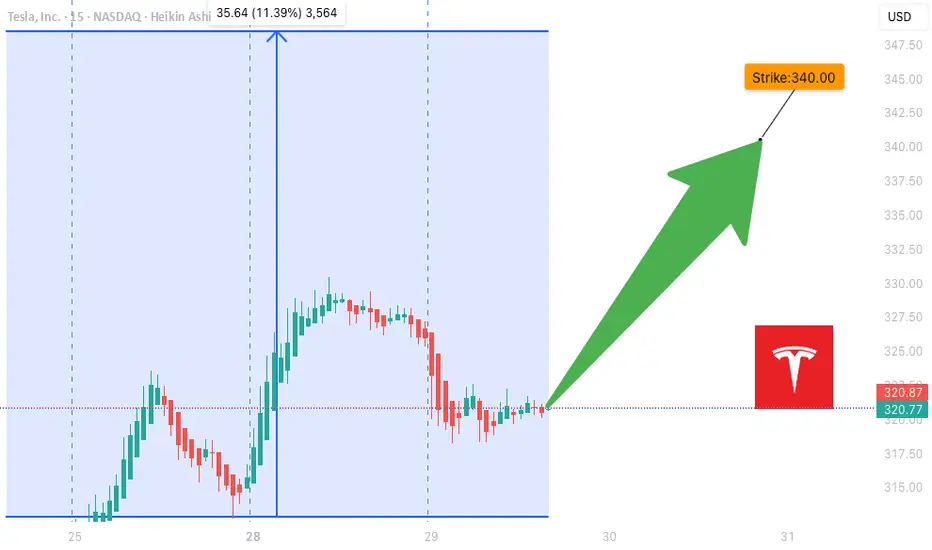
SLA Moderate Bullish Setup – Weekly Play for 08/01 Expiry
## ⚡ TSLA Moderate Bullish Setup – Weekly Play for 08/01 Expiry
🎯 *"Volume confirms it. RSI supports it. Time to strike—or stand by."*
---
### 🔍 Market Intelligence Snapshot:
📊 **Consensus**: Moderately Bullish
📈 **Weekly RSI**: Rising
📉 **Daily RSI**: Still Neutral (momentum building)
📉 **VIX**: Low → Great environment for call buying
📦 **Volume**: Strong institutional activity across models
---
### ✅ Recommended Trade Setup:
**TSLA \$340 CALL (Exp: Aug 1)**
💰 *Entry*: \~\$0.88
📈 *Target*: \$1.38
🛑 *Stop*: \$0.35
📆 *DTE*: 3 Days
🎯 *Entry*: Market Open
⚖️ *Confidence*: 65%
---
### 🔧 Model Blended Strategy Notes:
* Meta & Anthropic: Suggest ATM/ITM (\$327.50–\$330) → safer, higher cost
* Google & xAI: Prefer \$340–\$342.50 for a better risk/reward
* DeepSeek: Targets \$320 but with heavier premium
🧠 *Takeaway*: \$340 offers a balanced shot — affordable, but still responsive to upside flow.
---
### ⚠️ Risk Notes:
* ⏳ Time Decay → Quick exits = better outcomes
* 📰 External news or earnings reactions = watch for sudden volatility
* 🎯 Position size = keep light due to only 3 DTE
---
### 📊 TRADE SNAPSHOT (JSON):
```json
{
"instrument": "TSLA",
"direction": "call",
"strike": 340.0,
"expiry": "2025-08-01",
"confidence": 0.65,
"profit_target": 1.38,
"stop_loss": 0.35,
"size": 1,
"entry_price": 0.88,
"entry_timing": "open",
"signal_publish_time": "2025-07-29 10:16:14 UTC-04:00"
}
```
---
### 🧠 Quick Captions for Social:
* “TSLA bulls waking up? \$340C looks lit for the week 📈🔥”
* “Call volume surging. RSI rising. Low VIX. This \ NASDAQ:TSLA 340C might run 💥”
* “Risk-managed breakout shot — in and out fast 🎯”
TSLA WEEKLY OPTIONS SETUP
### 🚗 TSLA WEEKLY OPTIONS SETUP (2025-07-28)
**Big Call Flow. Low VIX. Can Bulls Hold \$325?**
---
📊 **Momentum Overview:**
* **Daily RSI:** 48.2 🔻 → *Neutral-to-Weak*
* **Weekly RSI:** 57.1 🔻 → *Still bullish zone, but falling*
⚠️ **Interpretation:** Momentum is softening, trend in question.
📉 **Volume Context:**
* **Volume Ratio:** 1.3x ⬆️ (vs. last week)
* **Price Change:** -0.77% despite that volume
🔍 *Distribution Alert:* Institutions may be selling into strength.
📈 **Options Flow:**
* **Call/Put Ratio:** **1.70** = 🚨 *Bullish flow confirmed*
* **Volatility (VIX):** 15.16 🟢 Favorable for directional plays
✅ Strong setup for options traders riding short-term momentum
---
### 🧠 **Weekly Sentiment Scorecard:**
* ✅ **Bullish Signals (2):** Options Flow, Volatility
* ⚠️ **Neutral Signals (2):** Daily & Weekly RSI
* ❌ **Bearish Signal (1):** Volume pattern = distribution risk
**Overall Bias:** 🟢 *Moderate Bullish*
---
### 🔥 **TRADE SETUP IDEA:**
🎯 **Strategy:** Long Call Option
* 📌 **Instrument:** TSLA
* 💵 **Strike:** \$355C
* 📅 **Expiry:** Aug 1, 2025
* 💸 **Entry:** \~\$0.75
* 🎯 **Profit Target:** \$1.50
* 🛑 **Stop Loss:** \$0.45
* 🔒 **Key Support to Watch:** \$327.50 — lose that = exit fast
📈 **Confidence Level:** 65%
⚠️ **Gamma Risk:** High → trade small, manage tight.
---
### 📦 TRADE\_DETAILS (JSON Format for Algo/Backtest):
```json
{
"instrument": "TSLA",
"direction": "call",
"strike": 355.0,
"expiry": "2025-08-01",
"confidence": 0.65,
"profit_target": 1.50,
"stop_loss": 0.45,
"size": 1,
"entry_price": 0.75,
"entry_timing": "open",
"signal_publish_time": "2025-08-01 09:30:00 UTC-04:00"
}
```
---
### 🧭 **Quick Notes for Traders:**
* ✅ Bulls have short-term edge — but **momentum is fading**
* ⚠️ If TSLA breaks below **\$325**, exit fast.
* 🔍 Watch for fakeouts: options flow is bullish, but volume says “not so fast.”
---
📊 TSLA \$355C → Risk \$0.75 to potentially double 📈
💬 Will this hold, or is it a bull trap before a dump? 👀
Comment below ⬇️ and follow for Monday updates!
---
**#TSLA #OptionsFlow #WeeklyTrade #TradingSetup #GammaRisk #AITrading #TeslaStock #UnusualOptionsActivity #SmartMoneyMoves**

TSLA Earnings Play (Bearish Bias)
🚨 TSLA Earnings Play (Bearish Bias) 🚨
Earnings Date: July 23, 2025 (AMC)
🧠 Confidence: 75% Bearish | 🎯 Target Move: -10%
⸻
🔍 Key Takeaways:
• 📉 TTM Revenue Growth: -9.2% → EV demand weakness
• 🧾 Margins Under Pressure: Gross 17.7%, Operating 2.5%, Net 6.4%
• ❌ EPS Beat Rate: Only 25% in last 8 quarters
• 🐻 Options Flow: High put volume at $330 strike
• 🧊 Low Volume Drift: Trading above 20/50MA but losing steam
• 📉 Sector Macro: EV competition + cyclical headwinds
⸻
🧨 Earnings Trade Setup:
{
"instrument": "TSLA",
"direction": "put",
"strike": 300,
"expiry": "2025-07-25",
"entry_price": 2.02,
"confidence": 75,
"profit_target": 6.06,
"stop_loss": 1.01,
"entry_timing": "pre_earnings_close",
"expected_move": 7.1,
"iv_rank": 0.75
}
⸻
🛠️ Trade Details:
Parameter Value
🎯 Strike Price $300 PUT
💰 Premium Paid $2.02
📅 Expiry Date 2025-07-25
🛑 Stop Loss $1.01
🚀 Profit Target $6.06
📏 Size 1 Contract
⏱ Entry Timing Pre-Earnings
📊 IV Rank 75%
🕒 Signal Time 7/23 @ 14:14 EDT
⸻
📈 Strategy Notes:
• 🧯 IV Crush Risk: Exit within 2 hours post-earnings
• 🎲 Risk/Reward: 1:3 setup | Max Loss: $202 | Max Gain: $606+
• 🧭 Volume Weakness & put/call skew signal downside
• 🧩 Macro + Tech + Flow Alignment = Tactical bearish play
⸻
🧠 “Not all dips are worth buying — this might be one to short.”
📢 Drop your thoughts — would you take the trade or fade it?

TSLA WEEKLY CALL SETUP — 07/23/2025
🚀 TSLA WEEKLY CALL SETUP — 07/23/2025
📈 AI Consensus Signals 🔥 Bullish Move Incoming
⸻
🔍 SENTIMENT SNAPSHOT
5 AI Models (Grok, Gemini, Claude, Meta, DeepSeek) =
✅ MODERATE BULLISH BIAS
➡️ Why?
• ✅ RSI Momentum (Daily + Weekly = UP)
• ✅ Bullish VIX sentiment
• ⚠️ Weak volume + neutral options flow
• 🧠 No model signals bearish direction
⸻
🎯 TRADE IDEA — CALL OPTION PLAY
{
"instrument": "TSLA",
"direction": "CALL",
"strike": 380,
"entry_price": 0.88,
"profit_target": 1.76,
"stop_loss": 0.44,
"expiry": "2025-07-25",
"confidence": 65%,
"entry_timing": "Open",
"size": 1 contract
}
⸻
📊 TRADE PLAN
🔹 🔸
🎯 Strike 380 CALL
💵 Entry Price 0.88
🎯 Target 1.76 (2× gain)
🛑 Stop Loss 0.44
📅 Expiry July 25, 2025
📈 Confidence 65%
⏰ Entry Market Open
⚠️ Risk High gamma / low time (2DTE)
⸻
📉 MODEL CONSENSUS
🧠 Grok – Bullish RSI, cautious due to volume
🧠 Gemini – Momentum confirmed, weekly strength
🧠 Claude – RSI + VIX = green light
🧠 Meta – 3 bullish signals, minor risk caution
🧠 DeepSeek – RSI + volatility favorable, careful on size
⸻
💬 Drop a 🟢 if you’re in
📈 Drop a ⚡ if you’re watching this flip
🚀 TSLA 380C looks primed if we break resistance near $376
#TSLA #OptionsTrading #CallOptions #WeeklySetup #AIPowered #MomentumTrade #TeslaTrade #GammaRisk #ZeroDTEReady

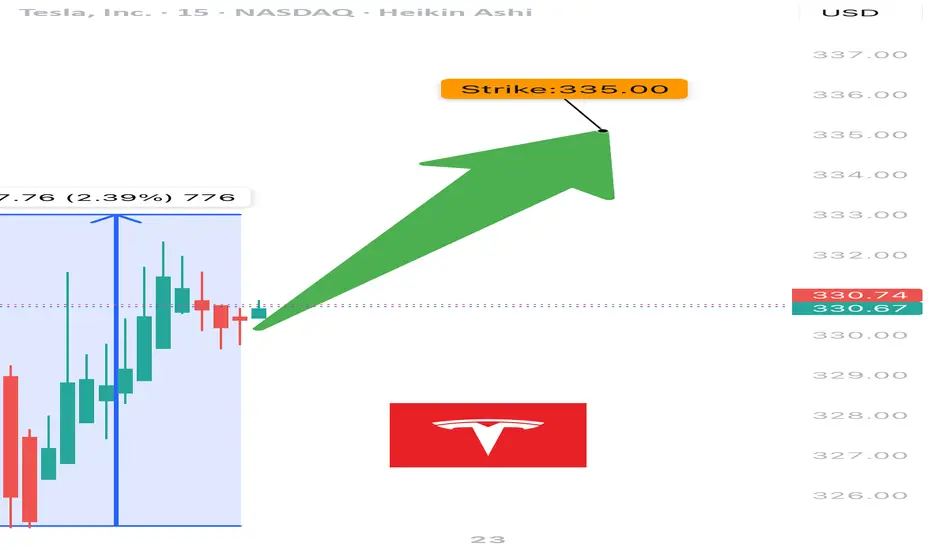
$TSLA Weekly Call Play – 07/22/25
🚀 NASDAQ:TSLA Weekly Call Play – 07/22/25
RSI Bullish 📈 | Options Flow Strong 🔁 | Volume Weak 💤 | 3DTE Tactical Entry
⸻
📊 Market Snapshot
• Price: ~$332–335 (spot near strike)
• Call/Put Ratio: 🔁 1.24 – Bullish Flow
• Daily RSI: ✅ 57.6 – Rising momentum
• Weekly RSI: ⚠️ 54.8 – Neutral / flattening
• Volume: ❌ Weak – Institutional absence
• Gamma Risk: ⚠️ Moderate (DTE = 3)
• VIX: ✅ Favorable
⸻
🧠 Trade Setup
{
"Instrument": "TSLA",
"Direction": "CALL",
"Strike": 335.00,
"Entry": 9.90,
"Profit Target": 15.00,
"Stop Loss": 6.00,
"Expiry": "2025-07-25",
"Confidence": 0.65,
"Size": 1,
"Entry Timing": "Open"
}
⸻
🔬 Sentiment Breakdown
Indicator Signal
📈 Daily RSI ✅ Bullish – confirms entry
📉 Weekly RSI ⚠️ Flat – no long-term edge
🔊 Volume ❌ Weak – no institutional bid
🔁 Options Flow ✅ Bullish (C/P = 1.24)
💨 VIX ✅ Favorable for upside trades
⏳ Gamma Decay ⚠️ High risk (3DTE)
⸻
📍 Chart Focus
• Support Zone: $328–$330
• Breakout Watch: $335+
• Target Zone: $340–$345
• ⚠️ Risk Watch: Volume divergence + gamma decay on low move
⸻
📢 Viral Caption / Hook (for TradingView, X, Discord):
“ NASDAQ:TSLA bulls flash 335C with confidence, but volume’s asleep. RSI’s in, gamma’s ticking. 3DTE lotto with caution tape.” 💥📉
💵 Entry: $9.90 | 🎯 Target: $15.00+ | 📉 Stop: $6.00 | ⚖️ Confidence: 65%
⸻
⚠️ Who This Trade Is For:
• 🔁 Options traders chasing short-term call flows
• 📈 Momentum scalpers riding RSI pop
• 🧠 Disciplined risk managers eyeing 3DTE setups
⸻
💬 Want a safer bull call spread (e.g., 330/340) or risk-defined iron fly for theta control?
Just ask — I’ll build and optimize it for you.
TSLA WEEKLY TRADE IDEA – JULY 21, 2025
🚀 TSLA WEEKLY TRADE IDEA – JULY 21, 2025 🚀
🔔 Bullish Play, But Handle With Caution 🔔
Models split, but momentum wins (for now)…
⸻
📈 Trade Setup
🟢 Call Option – Strike: $332.50
📆 Expiry: July 25, 2025 (Weekly)
💰 Entry: $11.05
🎯 Target: $22.11 (100% Gain)
🛑 Stop: $5.53 (50% Loss)
🕰️ Entry Time: Monday Open
📊 Confidence: 65% (Moderate)
⸻
🧠 Why This Trade?
✅ RSI trending bullish on both daily + weekly
⚠️ Weak volume & bearish options flow (C/P ratio > 1)
📉 Institutions may be hedging into earnings
🌪️ Earnings risk looms – volatility expected
📉 Some models say no trade – we say: controlled risk, tight leash
⸻
🧨 Strategy:
🔹 Single-leg naked call only
🔹 Avoid spreads due to IV & potential gap risk
🔹 Scale out if gain >30% early-week
🔹 CUT FAST if volume + price diverge
⸻
🔥 Quick Verdict:
Momentum > fear, but don’t ignore the smoke.
TSLA 332.5C — Risk 1 to Make 2+
Ready? Let’s ride the wave 📊⚡
#TSLA #OptionsTrading #CallOption #TradingSetup #WeeklyTrade #EarningsSeason #MomentumPlay #TradingViewIdeas #SwingTrade #SmartMoneyMoves

TSLA Rebounds from $290 | Buy the Dip or Political Trap?⚠️Just when it looked like Tesla was heading for a breakdown, we got a sharp bounce off the $290 level — and traders are watching closely. But here’s the twist: the move came after a headline-heavy week featuring none other than Trump vs. Elon.
🗞️ According to Politico, tensions flared after Trump made comments suggesting EVs were "doomed without government subsidies." Elon clapped back, defending Tesla’s profitability and independence. This added pressure on TSLA... and then came the bounce. Coincidence? Or whales buying fear?
📥 Entry Zones
• $290 – Strong demand zone, tested and respected
• $275 – Deeper retest if market pulls back
• $240 – Extreme fear level, unlikely unless macro worsens
🎯 Profit Targets
• $305 – Gap-fill magnet
• $320 – Resistance test
• $355+ – If Robotaxi or AI hype returns in force

TSLA A.M. Dump IdeaHere is a bearish imuplse at close breaking structure to the downside creating a sell opportunity if price retraces back to the arrow. Simple Idea.

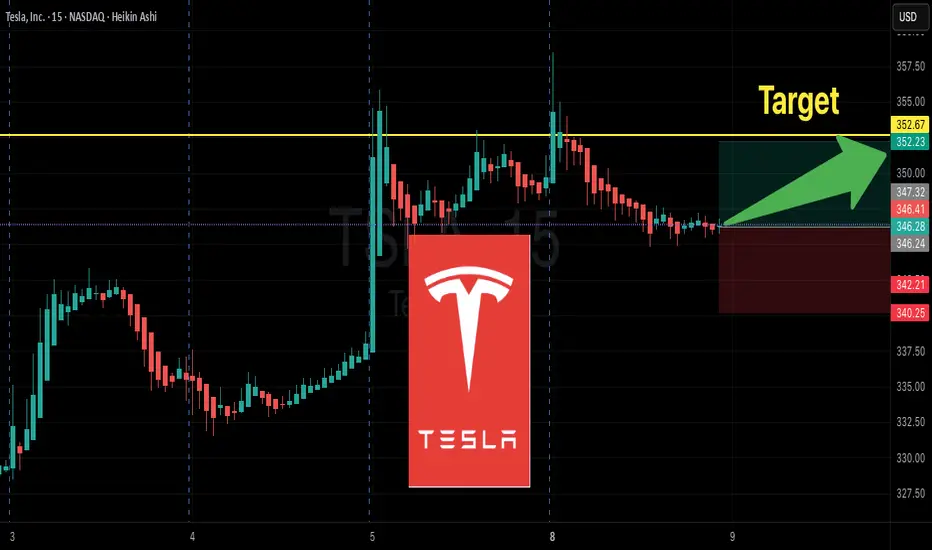
$Tsla will continue to go bullish after a short term pullbackNASDAQ:TSLA is in a bullish market overall speaking.
the price will probably continue to go up after this short term pullback!

Swing Trade Plan for TSLA (as of $285)TSLA has rallied from its previous consolidation zone and is approaching a potential resistance area between $290–$295. Momentum is solid, but RSI and volume trends may suggest we’re nearing short-term exhaustion.
✅ Strategy 1: Wait for the Pullback (Safer Play)
Entry zone:
• $240 – Ideal level near former resistance turned support
• $215 – Strong support with higher reward potential
Stop-loss:
• Below $200 (to protect against deeper trend reversal)
Profit targets:
• $265 – Conservative
• $290 – Re-test zone
• $355 – Bullish breakout continuation (if sentiment remains strong)
This setup gives room for the price to breathe and positions you after a healthy correction.
⚡️ Strategy 2: Momentum Breakout Trade (Aggressive)
Entry:
• On breakout above $295 with volume confirmation
Stop-loss:
• Below $280 (tight, breakout failure protection)
Target:
• $320, $340+, depending on follow-through
This is higher risk, higher reward — you’re betting on bulls continuing the charge without a pullback.
⚠️ Disclaimer: This is not financial advice. Trading involves risk. Always do your own analysis and trade with proper risk management.
