TESLA Is December seasonality about to hit it hard?Tesla (TSLA) has been trading within a 3-year Channel Up and has been on a Bullish Leg since the April 07 market low. Not everything on its long-term outlook is positive though as December in the past 5 years, holds a bearish seasonality for the stock as it has aggressively declined.
A 1W MACD Bearish Cross was always present during these times and so is today. With the price trading under a familiar Lower Highs trend-line as in 2023, we see strong probabilities that Tesla starts a new long-term correction. The minimum drop on these corrections has been -50% so a repeat of that would put the price exactly at the bottom of the Channel Up at $236, with only the 1M MA100 (red trend-line) in support.
---
** Please LIKE 👍, FOLLOW ✅, SHARE 🙌 and COMMENT ✍ if you enjoy this idea! Also share your ideas and charts in the comments section below! This is best way to keep it relevant, support us, keep the content here free and allow the idea to reach as many people as possible. **
---
💸💸💸💸💸💸
👇 👇 👇 👇 👇 👇
Tslasignals

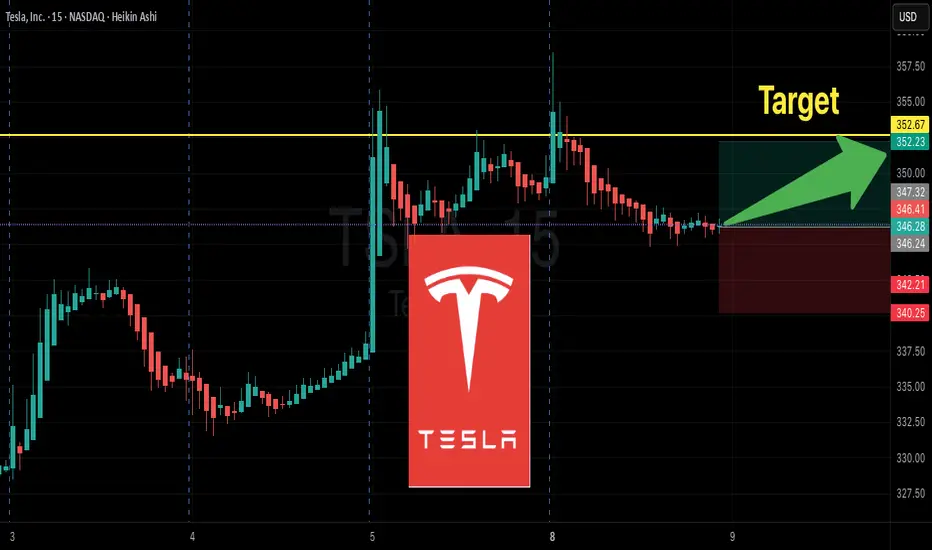
TSLA $352.50 Call—Capture Momentum Before Thursday!Here’s a **TradingView-friendly, viral-ready summary** for your TSLA weekly trade with punchy readability and attractive titles:
---
⚡ **TSLA Weekly Options Alert — Tactical Short-Duration Play**
**Directional View:** **Moderate Bullish** 💹
**Confidence:** 65%
**Trade Setup:**
* **Instrument:** TSLA
* **Strategy:** BUY CALL (single-leg)
* **Strike:** \$352.50
* **Expiry:** 2025-09-12 (4 DTE)
* **Entry Price:** \$5.00
* **Entry Timing:** Market Open
* **Size:** 1 contract
**Targets & Risk:**
* **Profit Target:** \$8.00 (\~60%+ gain)
* **Stop Loss:** \$2.50 (\~50% loss)
* **Max Hold:** No later than Thursday close (avoid Friday gamma/theta)
**Why This Trade?**
✅ Options Flow: Call/Put skew 1.35 → institutional call concentration \$350–\$355
✅ Daily Momentum: RSI 58.5 rising → near-term bullish signal
✅ Volatility: Low VIX (\~15–16) → cheaper premium, supportive environment
✅ Strike & Liquidity: \$352.50 slightly OTM with strong OI (5,781)
**Key Risks:**
⚠️ Weak weekly volume (0.9x) → institutional confirmation limited
⚠️ Short DTE → high theta/gamma; strict stop mandatory
⚠️ Negative news/catalyst risk → potential gap or intraday pullback
⚠️ Bid/ask spreads → manage fills carefully
**Quick Takeaway:**
* Tactical, short-duration directional trade leveraging **options flow + daily momentum**
* Strict risk management: **50% stop + exit by Thursday**
* Not high-conviction (>75%) — suitable for **speculative, nimble traders**
**Alternate Strikes / Ideas:**
* None provided — \$352.50 balances premium and upside potential for this 4-DTE window
---
📊 **TRADE DETAILS (JSON for precision)**
```json
{
"instrument": "TSLA",
"direction": "call",
"strike": 352.5,
"expiry": "2025-09-12",
"confidence": 0.65,
"profit_target": 8.00,
"stop_loss": 2.50,
"size": 1,
"entry_price": 5.00,
"entry_timing": "open",
"signal_publish_time": "2025-09-08 11:49:21 UTC-04:00"
}
```
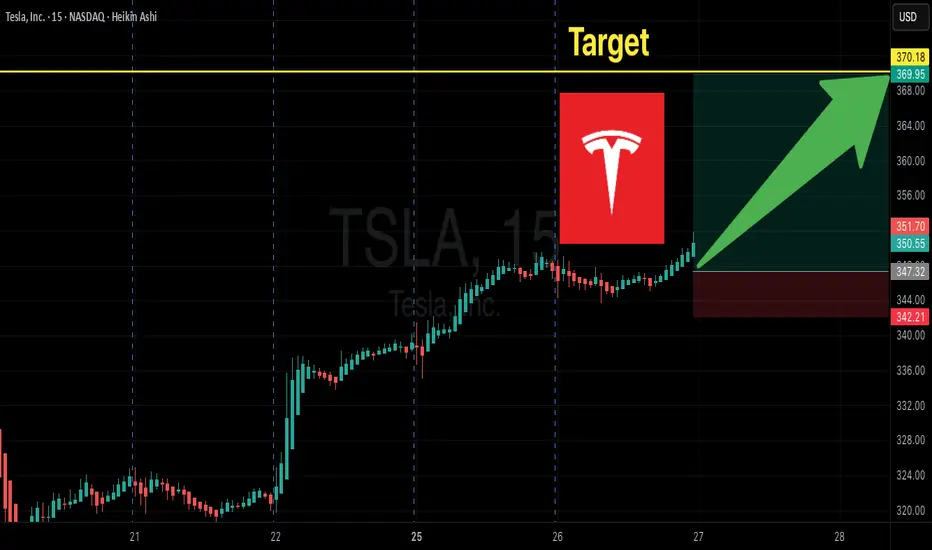
Tesla Options Flow Signals BIG Upside! $370C Momentum Trade
# 🚀 TSLA Weekly Options Setup | 370C Targeting 100%+ 📈
### 🔑 Key Highlights
* **Momentum:** RSI rising on both Daily (63.5) & Weekly (68.4) ✅
* **Options Flow:** Strong bullish skew (C/P = 1.79) 🟢
* **Volume:** Weak overall (0.9x), but institutional spike into close ⚡
* **Volatility:** VIX low → favorable for directional calls 😎
---
### 📊 Trade Setup (Consensus Pick)
* 🎯 **Instrument:** TSLA Weekly Call
* 💵 **Strike:** \$370C
* 📅 **Expiry:** 2025-08-29
* 💰 **Entry:** \$0.98 (ask) — open
* 🛑 **Stop:** \$0.49 (-50%)
* 🎯 **Target:** \$1.96 (+100%)
* ⏳ **Max Hold:** Close by **Thursday EOD** to avoid Friday theta/gamma crush
---
### 📌 Why \$370C?
* Best **liquidity** (OI \~18,450, vol 20k) → tightest fills ✅
* Balanced **delta & leverage** for short-term momentum 🎯
* Aligns with most model recommendations 📊
---
### ⚠️ Risks to Watch
* 🔻 **Theta decay** accelerates mid-week → avoid holding to Friday
* 🔻 **Gap risk** at open — manage entries with limit orders
* 🔻 **Market reversal** can kill momentum fast
---
## ✅ Final Verdict: **Strong Weekly Bullish Bias**
TSLA looks primed for an upside push — \$370C is the sweet spot for this week’s expiry.
---
### 🔥 Hashtags
\#TSLA #OptionsTrading #WeeklyOptions #StocksToWatch #MomentumTrading #TradingSignals #CallOptions #BullishSetup #TeslaStock
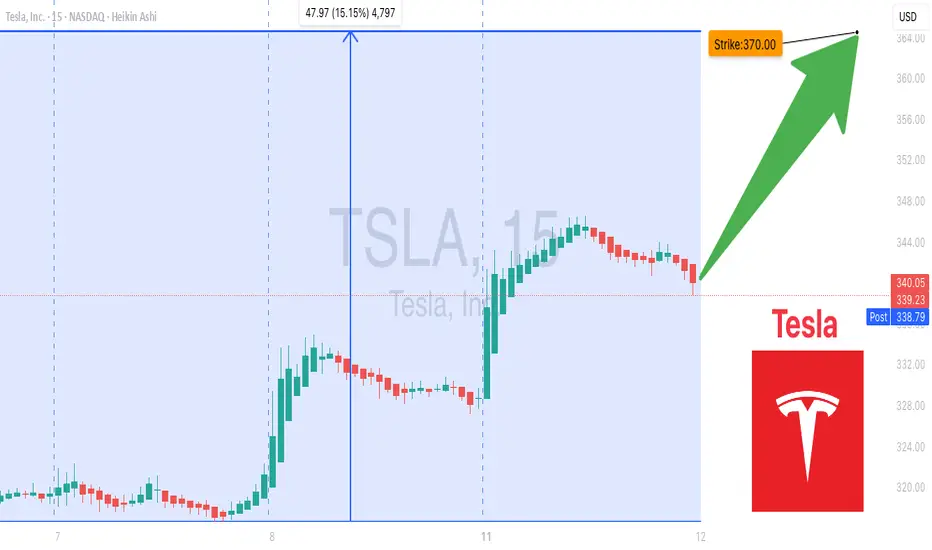
TSLA Momentum Unstoppable To $370— Don’t Miss Out! 🚀 TSLA Weekly Options Analysis — Bullish Momentum Confirmed! (2025-08-11) 🚀
### 🔥 Key Highlights:
* **RSI Signals Bullish:** Daily RSI at **59.5**, Weekly RSI at **54.9** — momentum is building strong!
* **Massive Weekly Gain:** +13.62% this week, breaking past key moving averages & resistance levels.
* **Options Flow:** Call/Put ratio at **1.77** — traders and institutions betting big on upside!
* **Volatility:** VIX low at **15.8** — ideal environment for bullish directional trades.
* **⚠️ Volume Caution:** Weekly volume at **0.8x** last week — watch closely for institutional commitment shifts.
---
### 📈 Consensus:
Most models say: **BULLISH** ✅
* Momentum + Options Flow + Low Volatility = Perfect setup
* Volume dip is a caution flag but not a dealbreaker (yet).
---
### 🎯 Trade Setup: Buy Calls on TSLA
| Parameter | Details |
| ----------------- | ------------------------------------ |
| **Strike** | \$370 |
| **Expiry** | Aug 15, 2025 |
| **Entry Price** | \$0.53 (market open) |
| **Stop Loss** | \$0.26 (50% loss) |
| **Profit Target** | \$1.06 (100% gain) |
| **Position Size** | Risk 2-4% of account (1-2 contracts) |
---
### ⚠️ Risk Management & Notes
* Moderate gamma risk — manage actively as expiry nears
* Watch volume trends for sudden shifts
* Confidence level: **75%** — strong bullish signals but stay nimble!
---
### 📊 JSON Trade Snapshot for Algo Fans
```json
{
"instrument": "TSLA",
"direction": "call",
"strike": 370.00,
"expiry": "2025-08-15",
"confidence": 0.75,
"profit_target": 1.06,
"stop_loss": 0.26,
"size": 2,
"entry_price": 0.53,
"entry_timing": "open",
"signal_publish_time": "2025-08-11 14:59:39 UTC-04:00"
}
```
---
💡 **TL;DR:** TSLA’s weekly surge + bullish options flow make \$370 calls a compelling play this week. Manage risk, watch volume, and aim for that 2x profit target!
TSLA WEEKLY OPTIONS SETUP
### 🚗 TSLA WEEKLY OPTIONS SETUP (2025-07-28)
**Big Call Flow. Low VIX. Can Bulls Hold \$325?**
---
📊 **Momentum Overview:**
* **Daily RSI:** 48.2 🔻 → *Neutral-to-Weak*
* **Weekly RSI:** 57.1 🔻 → *Still bullish zone, but falling*
⚠️ **Interpretation:** Momentum is softening, trend in question.
📉 **Volume Context:**
* **Volume Ratio:** 1.3x ⬆️ (vs. last week)
* **Price Change:** -0.77% despite that volume
🔍 *Distribution Alert:* Institutions may be selling into strength.
📈 **Options Flow:**
* **Call/Put Ratio:** **1.70** = 🚨 *Bullish flow confirmed*
* **Volatility (VIX):** 15.16 🟢 Favorable for directional plays
✅ Strong setup for options traders riding short-term momentum
---
### 🧠 **Weekly Sentiment Scorecard:**
* ✅ **Bullish Signals (2):** Options Flow, Volatility
* ⚠️ **Neutral Signals (2):** Daily & Weekly RSI
* ❌ **Bearish Signal (1):** Volume pattern = distribution risk
**Overall Bias:** 🟢 *Moderate Bullish*
---
### 🔥 **TRADE SETUP IDEA:**
🎯 **Strategy:** Long Call Option
* 📌 **Instrument:** TSLA
* 💵 **Strike:** \$355C
* 📅 **Expiry:** Aug 1, 2025
* 💸 **Entry:** \~\$0.75
* 🎯 **Profit Target:** \$1.50
* 🛑 **Stop Loss:** \$0.45
* 🔒 **Key Support to Watch:** \$327.50 — lose that = exit fast
📈 **Confidence Level:** 65%
⚠️ **Gamma Risk:** High → trade small, manage tight.
---
### 📦 TRADE\_DETAILS (JSON Format for Algo/Backtest):
```json
{
"instrument": "TSLA",
"direction": "call",
"strike": 355.0,
"expiry": "2025-08-01",
"confidence": 0.65,
"profit_target": 1.50,
"stop_loss": 0.45,
"size": 1,
"entry_price": 0.75,
"entry_timing": "open",
"signal_publish_time": "2025-08-01 09:30:00 UTC-04:00"
}
```
---
### 🧭 **Quick Notes for Traders:**
* ✅ Bulls have short-term edge — but **momentum is fading**
* ⚠️ If TSLA breaks below **\$325**, exit fast.
* 🔍 Watch for fakeouts: options flow is bullish, but volume says “not so fast.”
---
📊 TSLA \$355C → Risk \$0.75 to potentially double 📈
💬 Will this hold, or is it a bull trap before a dump? 👀
Comment below ⬇️ and follow for Monday updates!
---
**#TSLA #OptionsFlow #WeeklyTrade #TradingSetup #GammaRisk #AITrading #TeslaStock #UnusualOptionsActivity #SmartMoneyMoves**

TSLA WEEKLY CALL SETUP — 07/23/2025
🚀 TSLA WEEKLY CALL SETUP — 07/23/2025
📈 AI Consensus Signals 🔥 Bullish Move Incoming
⸻
🔍 SENTIMENT SNAPSHOT
5 AI Models (Grok, Gemini, Claude, Meta, DeepSeek) =
✅ MODERATE BULLISH BIAS
➡️ Why?
• ✅ RSI Momentum (Daily + Weekly = UP)
• ✅ Bullish VIX sentiment
• ⚠️ Weak volume + neutral options flow
• 🧠 No model signals bearish direction
⸻
🎯 TRADE IDEA — CALL OPTION PLAY
{
"instrument": "TSLA",
"direction": "CALL",
"strike": 380,
"entry_price": 0.88,
"profit_target": 1.76,
"stop_loss": 0.44,
"expiry": "2025-07-25",
"confidence": 65%,
"entry_timing": "Open",
"size": 1 contract
}
⸻
📊 TRADE PLAN
🔹 🔸
🎯 Strike 380 CALL
💵 Entry Price 0.88
🎯 Target 1.76 (2× gain)
🛑 Stop Loss 0.44
📅 Expiry July 25, 2025
📈 Confidence 65%
⏰ Entry Market Open
⚠️ Risk High gamma / low time (2DTE)
⸻
📉 MODEL CONSENSUS
🧠 Grok – Bullish RSI, cautious due to volume
🧠 Gemini – Momentum confirmed, weekly strength
🧠 Claude – RSI + VIX = green light
🧠 Meta – 3 bullish signals, minor risk caution
🧠 DeepSeek – RSI + volatility favorable, careful on size
⸻
💬 Drop a 🟢 if you’re in
📈 Drop a ⚡ if you’re watching this flip
🚀 TSLA 380C looks primed if we break resistance near $376
#TSLA #OptionsTrading #CallOptions #WeeklySetup #AIPowered #MomentumTrade #TeslaTrade #GammaRisk #ZeroDTEReady

TSLA WEEKLY TRADE IDEA – JULY 21, 2025
🚀 TSLA WEEKLY TRADE IDEA – JULY 21, 2025 🚀
🔔 Bullish Play, But Handle With Caution 🔔
Models split, but momentum wins (for now)…
⸻
📈 Trade Setup
🟢 Call Option – Strike: $332.50
📆 Expiry: July 25, 2025 (Weekly)
💰 Entry: $11.05
🎯 Target: $22.11 (100% Gain)
🛑 Stop: $5.53 (50% Loss)
🕰️ Entry Time: Monday Open
📊 Confidence: 65% (Moderate)
⸻
🧠 Why This Trade?
✅ RSI trending bullish on both daily + weekly
⚠️ Weak volume & bearish options flow (C/P ratio > 1)
📉 Institutions may be hedging into earnings
🌪️ Earnings risk looms – volatility expected
📉 Some models say no trade – we say: controlled risk, tight leash
⸻
🧨 Strategy:
🔹 Single-leg naked call only
🔹 Avoid spreads due to IV & potential gap risk
🔹 Scale out if gain >30% early-week
🔹 CUT FAST if volume + price diverge
⸻
🔥 Quick Verdict:
Momentum > fear, but don’t ignore the smoke.
TSLA 332.5C — Risk 1 to Make 2+
Ready? Let’s ride the wave 📊⚡
#TSLA #OptionsTrading #CallOption #TradingSetup #WeeklyTrade #EarningsSeason #MomentumPlay #TradingViewIdeas #SwingTrade #SmartMoneyMoves

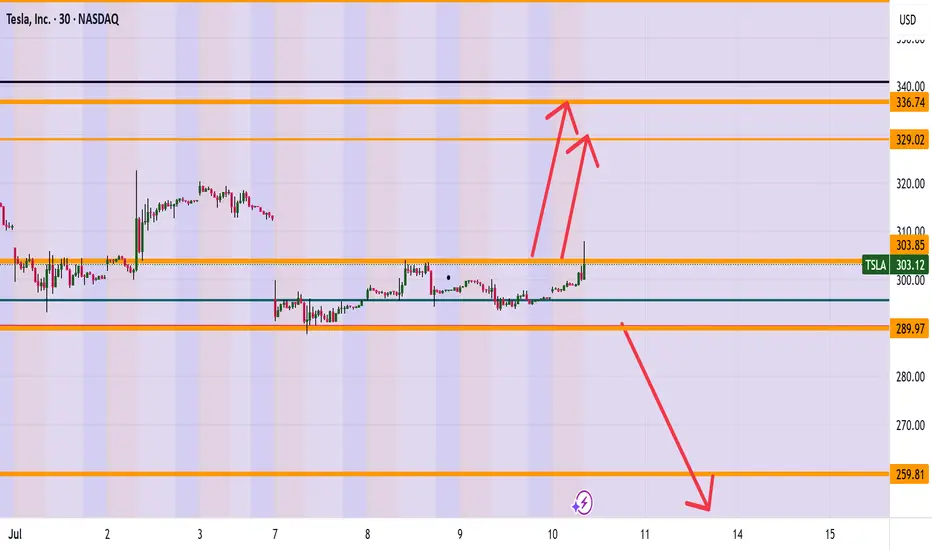
TESLA (TSLA) ARE WE HEADING TO 336? Morning Folks
It appears we are trying to break the highs of 304 and if we are successful a nice range up to 327-336 makes sense. However be careful if sink back down under 289 which then can see levels of 259 getting hit.
What are your thoughts on Tesla? Put in the comments section below
Kris Mindbloome Exchange
Trade Smarter Live Better
Tesla is Going to 303 + Looks like Tesla is going to 303 or possibly higher
Kris/Mindbloome Exchange
Trade Smarter Live Better

Tesla’s Next Move: $425 or $420 – Which Way Will It Break?Morning Trading Tesla is gearing up for a big move, and all eyes are on $425 and $420. These levels are the key to figuring out where the stock is headed next. Let’s break it down so it’s easy to follow.
If Tesla Breaks Above $425
This is where the bulls could take control. Here’s what to watch:
$439: First stop. If we clear this, it’s a sign of strength.
Above $439: Things could really heat up. Long trades make sense here as Tesla could climb higher.
If Tesla Breaks Below $420
The bears might step in, and we’ll be looking for lower levels. Watch these zones:
$417: The first area where buyers might show up.
$402: A deeper pullback, but still within range for a bounce.
$394: A critical level—if this breaks, we could see more selling.
$374: The big one. If it gets this low, it’ll be a major area of interest.
Here’s the Game Plan
Keep it simple: Watch $425 and $420. If one of these breaks, it’ll give us a clear direction. Don’t forget to plan your trades, set stop-losses, and stick to your strategy.
If you enjoyed this breakdown, give it a follow or a like. Got questions about Tesla, other charts, or feeling stuck with trading? Send me a DM—I’d love to help!
Struggling with burnout, trading stress, or figuring out how to stay consistent as a trader? Reach out. I’m here to help you stay balanced and build a sustainable trading mindset.
Kirs/Mindbloome Exchange
Trade What You See

Sliding In December: Is Tesla (TSLA) Losing Its Spark?
As always, we like to keep it clean and simple, with technicals and analysis that's easy to see and understand. Let's get into it:
Losing all its spark? Nah. But, we see a correction for TSLA happening this December, starting within the next 1-2 days. Why?
- It’s currently bumping into price levels we last saw in 2022, which served as a strong ceiling back then and might trigger profit-taking now.
- It's well into a Wave 5 Elliott Wave, signaling exhaustion in 4h/8h/1D timeframes.
- Overbought.
Additionally, many are noting that Tesla’s valuation feels stretched compared to its earnings and growth prospects. Analysts point out that its current price may rely on overly optimistic assumptions about future market share, tech breakthroughs, and profitability. Some also highlight that competitors are catching up, which could eat into Tesla’s premium valuation. Meanwhile, skeptics argue that the stock’s recent run has simply gotten ahead of fundamentals, and a correction might be due as more realistic expectations set in.
We see a 10% slide to the $360 range.
Let's see what December brings.
Be Alert.
Trade Green.

TESLA Will it turn the former 2-year Resistance into Support?Tesla (TSLA) fulfilled our August 15 buy signal (see chart below) as after the minor pull-back we expected, it rose aggressively on its new Bullish Leg of the 2-year Channel Up and came close to a new Higher High:
The correction of the past 4 days may be one last great short-term buy opportunity as it hit yesterday the former Resistance Zone of July 2022. If it holds, it will turn into its new technical Support Zone, thus will be an additional buy for out $380.00 Target.
Beyond that we need to see the ATH break before formulating a new strategic plan on the pattern that will emerge.
-------------------------------------------------------------------------------
** Please LIKE 👍, FOLLOW ✅, SHARE 🙌 and COMMENT ✍ if you enjoy this idea! Also share your ideas and charts in the comments section below! This is best way to keep it relevant, support us, keep the content here free and allow the idea to reach as many people as possible. **
-------------------------------------------------------------------------------
💸💸💸💸💸💸
👇 👇 👇 👇 👇 👇

Tesla Update Potential Great ROI Trade coming up Good evening or morning trading family
So I created a quick video on a update with Tesla which I felt was important to create for everyone. Currently we are retracing up from a target that I will show you how I got in the video. However two things to mention if we can break 260-263 range we are looking pretty healthy for a bull run up. However if we go back to retest 255.66 we could potentially face another break and further bearish momentum.
Any questions or comments let me know, like follow boost if you found this helpful
Have a great night trading fam
Mindbloome Trading
Trade What You See

Tesla Great Bearish Trade if We go South Good morning Trading Family
Currently with Tesla, an update we made a lower low which is great news for the bears. However we can still go to 213.82 and punch up hard with a bullish movement up.
However if we break down further this can be a great trade for the bears down to 190
Put your alerts in for 213.80-90 zone and lets see what happens with this news coming out today
Mindbloome Trading
Trade What You See

Tesla 4-Hour Chart: Path to $191 or $261?Alright, trading fam, grab your boards—Tesla’s (TSLA) chart just served up a crucial break below $213.78, and things are starting to get spicy. Think of that level like a solid wave that held you steady for a bit—until it dumped you off the board. Now that the market’s broken out of the channel, we’re eyeing $191.20 as the next potential landing spot. This could be where the bulls regroup and paddle back in for another try, but if they miss the chance, the market might pull us further under.
Now, here’s the exciting part: it’s not over for the bulls. If Tesla regains its footing and pushes above $223.70, that’s our green light to ride toward $261–264. This area is prime territory for locking in some early profits—it’s like the perfect wave where some surfers might hop off and call it a day. But if the bulls stay committed, they could break through that resistance and catch even bigger waves ahead.
So what’s the plan? Below $213.78, we stay cool and watch for $191—it could be a solid zone to hop back on. But if we reclaim $223.70, we ride that momentum to $261 for a sweet first profit. No need to rush or panic—just like surfing, it’s all about waiting for the right set and not forcing things.
If this breakdown gave you good vibes, boost it with a like or follow—let’s keep riding the markets together, one wave at a time.
Mindbloome Trader

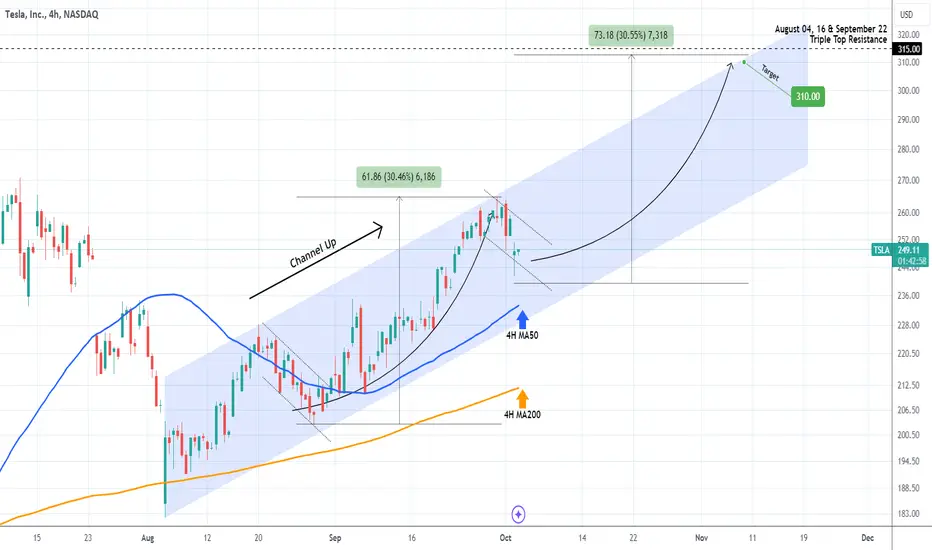
TESLA pulling back on Q3 deliveries. Is there a reason to panic?Tesla (TSLA) opened considerably lower today as they announced Q3 deliveries of 463000 units, below the heightened expectations of around 470,000 from the buy-side and just slightly above the consensus estimate of 462,000. Is this a typical market overreaction on data or the start of a stronger correction ahead of the Robotaxi event next week?
Well from a technical standpoint, our thesis on Tesla is well known and hasn't changed since the August 15 update (see chart below), where we called for a $380 target within the long-term Channel Up:
Even on the more short-term 1D time-frame, we can see that the stock is respecting a Channel Up pattern that started on the August 05 bottom and for the past 30 days has been supported by the 4H MA50 (blue trend-line).
The last correction like the one we're having this week, was from August 20 to 28, which then rallied by +30.50%. As a result, the minimum Target now for November is $310.
-------------------------------------------------------------------------------
** Please LIKE 👍, FOLLOW ✅, SHARE 🙌 and COMMENT ✍ if you enjoy this idea! Also share your ideas and charts in the comments section below! This is best way to keep it relevant, support us, keep the content here free and allow the idea to reach as many people as possible. **
-------------------------------------------------------------------------------
💸💸💸💸💸💸
👇 👇 👇 👇 👇 👇
TSLA ( Tesla ) BUY TF H1 TP = 248.08 Good luck!On the H1 chart the trend started on Aug. 8 (linear regression channel).
There is a high probability of profit taking. Possible take profit level is 248.08
Using a trailing stop is also a good idea!
Please leave your feedback, your opinion. I am very interested in it. Thank you!
Good luck!
Regards, WeBelievelnTrading

Tesla Wave Analysis: Key Weekly to 30-Minute Projections to WatcHey traders, here’s a quick Tesla update! We’re sitting around $238, and here are the key scenarios I’m watching:
Scenario 1: If we hold here, we could see a move up to $250 before a deeper correction.
Scenario 2: We might break down to $235-$233, then potentially rebound from there.
Worst Case #1: If a deeper correction happens now, Tesla could drop to $222, but eventually head toward $260.
Worst Case #2: If we break below $222, then $210 is imminent. This would be a major red flag, so we need to be careful—it could lead to further breakdown in the market.
What do you think? Agree with these levels? I’d love to hear your feedback on what you like, don’t like, or any thoughts you have. Let’s stay sharp and safe out there!
MB Trader

TESLA Huge gap down after Earnings! Buy opportunity in disguise?Tesla (TSLA) was down more than -8.00% in pre-market trading after reporting its lowest profit margin in over five years and missing second-quarter earnings expectations. This was largely due to cut prices to revive demand and increased spending on AI projects.
This however can technically be a buy opportunity in disguise as following the ATH Lower Highs trend-line of November 2021 break-out, a new bullish potential emerged and the pattern may very well be a Channel Up as so far the rally since the April 22 Low resembles the 7-month Bullish Leg following the January 06 2023 bottom.
The Target can be within the Resistance 2 level and a potential +194.87% rise (previous Bullish Leg) range. We update our long-term Target to $380.00, slightly below Resistance 2.
-------------------------------------------------------------------------------
** Please LIKE 👍, FOLLOW ✅, SHARE 🙌 and COMMENT ✍ if you enjoy this idea! Also share your ideas and charts in the comments section below! This is best way to keep it relevant, support us, keep the content here free and allow the idea to reach as many people as possible. **
-------------------------------------------------------------------------------
💸💸💸💸💸💸
👇 👇 👇 👇 👇 👇

TESLA Massive pump to $360 coming based on historical behaviour.Tesla (TSLA) is recovering today after a sharp pull-back yesterday of around -14%. This marks the stock's first serious correction since the rally started in late June. Ahead of an emerging Golden Cross on the 1D time-frame, we looked at Tesla's similar historical patterns since the IPO that offer remarkable insight.
First and foremost, Tesla's recent pattern has been an Inverse Head and Shoulders (IH&S), which as we've noted on a previous analysis, was its bottom reversal formation that made the price break above the 3-year Lower Highs Resistance trend-line.
Similar IH&S patterns were formed in 2019/20, 2016/17 and 2012/13. So we can claim that there might be a roughly 4-year Cyclical Behavioural Pattern behind Tesla's growth. The word 'growth' is key here as after every such pattern and more importantly a correction of around -15% after breaking above the IH&S, the stock price rallied parabolically into new expansion levels.
As you can see on the 2019/20 pattern the correction was around -10%, on the 2016/17 around -15% and on the 2012/13 around -15% as well. Yesterday's -14% correction along with today's sharp recovery to the 0.5 Fib (losses cut by 50%), seems to fulfil this growth pattern.
As far as a Target is concerned, on all previous cases, the price reached (and even surpasses significantly) at least the 1.5 Fibonacci extension measuring from the pattern's bottom (Head of the IH&S). In 2019/20 it took the price around 1.5 month to approach the 1.5 Fib while in 2012/13 it took roughly 2 months.
As a result, our new medium-term Target on Tesla is $360.00 (marginally below the 1.5 Fib).
-------------------------------------------------------------------------------
** Please LIKE 👍, FOLLOW ✅, SHARE 🙌 and COMMENT ✍ if you enjoy this idea! Also share your ideas and charts in the comments section below! This is best way to keep it relevant, support us, keep the content here free and allow the idea to reach as many people as possible. **
-------------------------------------------------------------------------------
💸💸💸💸💸💸
👇 👇 👇 👇 👇 👇

TSLA (Tesla) Technical Analysis and Trade Idea Upon analyzing TSLA (Tesla), we can see that it has been in a sustained downward trend. Notably, price has entered a critical support zone, exhibiting a double bottom pattern on the chart. Additionally, there has been a downward move beneath this double bottom, tapping into liquidity.
Given the significance of this support zone, I anticipate a reaction, potentially leading to a substantial retracement. Another noteworthy aspect is the imbalance above the current price range, which could serve as a target. Furthermore, I acknowledge the influence of seasonality in stock markets, a topic I delve into within the accompanying video. In the video, we explore trends, price action, market structure, and other essential elements of technical analysis.

TESLA Inverse Head and Shoulders formed. Is this the bottom?Tesla (TSLA) appears to have completed the Right Shoulder of an Inverse Head and Shoulders (IH&S) pattern, which is technically a bullish reversal structure that is formed on market bottoms. We have already talked in our previous analysis about the IH&S formed on the 1D RSI and as you can see by the circle drawing, this is consistent with the all previous Right Shoulder formations since December 2022.
As you can see, the long-term pattern since the July 19 2023 High is a Channel Down and this IH&S is the Lower High formation that should technically start the new Bullish Leg towards the pattern's top (Lower Highs trend-line).
As a result, our technical target is $245.00, which represents a Lower High level slightly lower than a projected +41% rise (last Lower High was +36%, the one before +31%, so we estimate a +5% progression). We will book the profit earlier though if the 1D RSI hits its Resistance Zone before the price reaches $245.00.
-------------------------------------------------------------------------------
** Please LIKE 👍, FOLLOW ✅, SHARE 🙌 and COMMENT ✍ if you enjoy this idea! Also share your ideas and charts in the comments section below! This is best way to keep it relevant, support us, keep the content here free and allow the idea to reach as many people as possible. **
-------------------------------------------------------------------------------
💸💸💸💸💸💸
👇 👇 👇 👇 👇 👇

TESLA made a Channel Down bottom. Buy but watch these breakouts.Tesla (TSLA) has been trading within a Channel Down pattern since the July 19 2023 High (which was an emphatic Lower Highs rejection on the ATH Lower Highs trend-line of the November 04 2021 All Time High) and on our last analysis (January 12, see chart below) we called for a tight SL buy but mentioned the importance of taking the loss quickly if the April 27 2023 trend-line broke and reverse to a sell on a $180.00 Target:
The price did make that bearish break-out and hit $180.00, a level that has been holding since last Thursday. Even though the fundamentals surrounding the company are very volatile, this is a strong medium-term buy opportunity from a technical perspective. Not only is it at the bottom (Lower Lows trend-line) of the 7-month Channel Down, but also the RSI is forming an Inverse Head and Shoulders pattern, which is a structure that has been formed on every single bottom since the December 27 2022 market bottom.
In fact the 1D RSI reached last Thursday those exact vastly oversold levels (17.50) it has last seen on that global December 2022 (price bottomed on January 06 2023) market bottom. As a result, there are much more reasons to consider the current level a strong medium-term opportunity than not. The technical target is $245.00, which represents a Lower High level slightly lower than a projected +41% rise (last Lower High was +36%, the one before +31%, so we estimate a +5% progression). We will book the profit earlier though if the 1D RSI hits its Resistance Zone before the price reaches $245.00.
If the uptrend is extended and the price breaks above the ATH Lower Highs trend-line (already has 5 rejections since November 2021), we will take it as a bullish break-out signal and target $315.00, which is the September 21 2022 Triple Top. On the other hand, if the stock closes a 1D candle below the Lower Lows (bottom) trend-line of the 7-month Channel Down, we will sell and target $152.50, which is the Support 2 level.
-------------------------------------------------------------------------------
** Please LIKE 👍, FOLLOW ✅, SHARE 🙌 and COMMENT ✍ if you enjoy this idea! Also share your ideas and charts in the comments section below! This is best way to keep it relevant, support us, keep the content here free and allow the idea to reach as many people as possible. **
-------------------------------------------------------------------------------
💸💸💸💸💸💸
👇 👇 👇 👇 👇 👇
