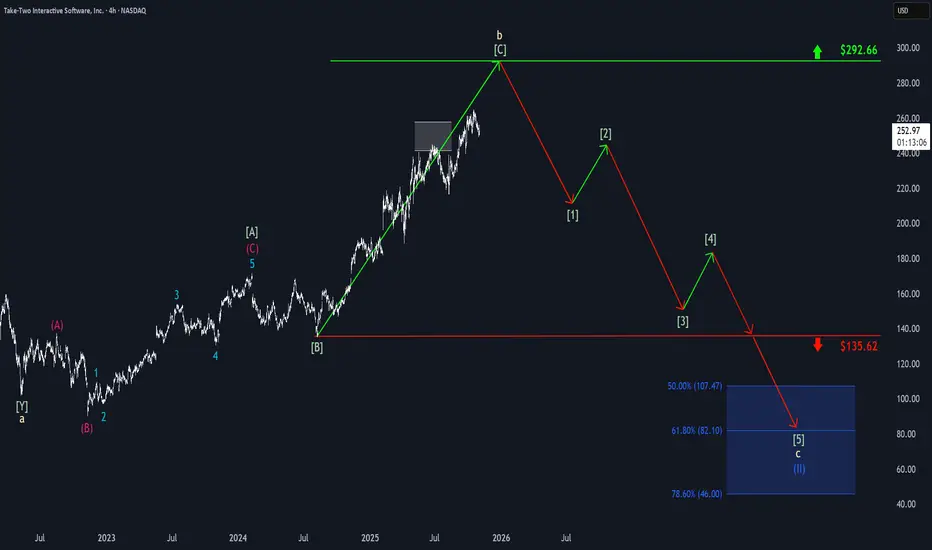
Take-Two: Momentum Fades, but Recovery ExpectedTake-Two’s upward momentum has faded recently, leading to a noticeable pullback. However, we expect the stock to rebound soon and resume the corrective advance of beige wave b, moving closer to resistance at $292.66. At that point, the stock is likely to reverse course and begin a green downward impulse, which should ultimately finalize the correction of blue wave (II). We have identified a blue Target Zone between $107.47 and $46 for this significant bottom.
Ttwoanalysis
Take-Two: Continued Sideways MovementSince the beginning of February, Take-Two Interactive has been moving mostly sideways with a slight downward bias. Currently, the ongoing beige wave b should continue upward, driving the stock into the beige Target Zone between $241.59 and $257.87. There, this corrective rally should conclude, setting the stage for a sharp downward move. However, if the stock breaks below the support at $135.62, this will signal a premature correction low of the blue wave alt.(II) in the blue Target Zone between $107.47 and $46. We assign this scenario a 33% probability.

Take-Two: Target Zone in Focus!Although a slight downward tendency has been observed in TTWO’s sideways phase, the stock has recently shown new motivation on the upside. While short-term pullbacks cannot be ruled out, we still expect the beige b-wave to extend into our beige Target Zone (coordinates: $241.59 – $257.87), where we anticipate a significant trend reversal. This outlook remains intact as long as the support at $135.62 holds fast. An early sell-off below this level would trigger our alternative scenario of a premature correction low within our blue Target Zone between $107.47 and $46 (33% probability).

TAKE-TWO INTERACTIVE SOFTWARE $TTWO - Feb. 28th, 2024TAKE-TWO INTERACTIVE SOFTWARE NASDAQ:TTWO - Feb. 28th, 2024
BUY/LONG ZONE (GREEN): $153.00 - $168.45
DO NOT TRADE/DNT ZONE (WHITE): $143.65 - $153.00
SELL/SHORT ZONE (RED): $133.00 - $143.65
Weekly: Bearish
Daily: Bearish
4H: Bearish
Currently in a DNT zone as it would be unfair to automatically wait for price to drop and then say it's a bearish area; however, price is strongly bearish on the weekly, daily, and 4H. Shown in blue is previous zones that I would follow and the order in which I would follow them, the previous bullish trend was fairly clear and strong (labels A-E & 1-3). About three weeks ago we saw a drop that pushed right into a bearish zone below level $156.75 (bottom of the zone). Drawn now are the current zones where price currently resides and the trends I would follow in each of them. The arrows show simple potential price movement to look for, but the market is always subject to change and create new levels. Bulls can look for early entry at the bottom of the DNT zone at $143.65 and seek a bounce or wait for price to break back above $153.00. Bears can look for price continuing below level $143.65 or a pullback anywhere up to $153.00 and rejection back towards the $143.65 level and lower.
This is what I would personally look at before entering trades, everything is subject to change on a daily basis and as I analyze different timeframes and ideas.
ENTERTAINMENT PURPOSES ONLY, NOT FINANCIAL ADVICE!
trend analysis, chart patterns, support and resistance
