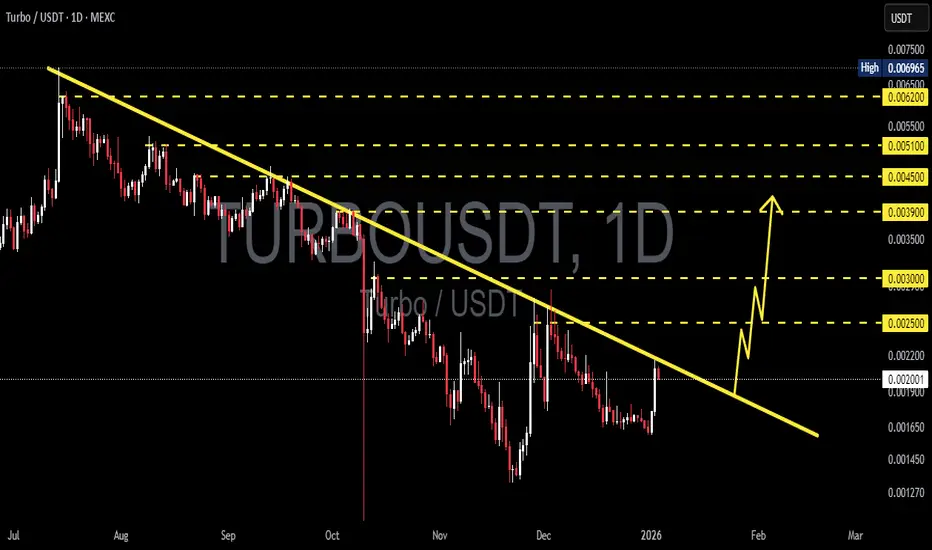
TURBO/USDT Major Downtrend Under Pressure Breakout or Rejection?TURBO/USDT on the 1D timeframe is still moving within a clear medium-term downtrend structure. Price continues to print lower highs and lower lows, capped by a well-respected descending trendline that has been tested multiple times since the previous peak. Currently, price is making a short-term bullish pullback and approaching this critical trendline area.
---
Pattern Explanation
The dominant structure is a Descending Trendline (Bearish Bias).
However, recent price action shows a relief rally, which could evolve into:
An early bullish breakout, if price breaks and holds above the trendline.
A continuation lower high, if price gets rejected and fails at resistance.
This places price in a key decision zone.
---
Key Levels
Resistance Zones:
0.00250 – minor resistance
0.00300 – key resistance
0.00390 – structural resistance
0.00450 – major resistance
0.00510 – supply zone
0.00620 – extreme resistance / previous distribution
Support Zones:
0.00200 – short-term support
0.00165 – critical support
0.00145 – last major support
---
Bullish Scenario
Bullish confirmation occurs if:
Price breaks and closes strongly above the descending trendline on the daily timeframe.
Followed by a clean retest with increasing volume.
Potential upside targets:
0.00250
0.00300
0.00390
0.00450
A clean break above 0.00300 could signal an early medium-term trend reversal.
---
Bearish Scenario
Bearish continuation remains valid if:
Price fails to break the trendline and forms a strong rejection candle.
Strong selling pressure appears around 0.00250 – 0.00300.
Potential downside targets:
0.00200
0.00165
0.00145
A breakdown below 0.00165 may open the door for further downside continuation.
---
Conclusion
TURBO/USDT is currently trading at a highly critical technical zone. As long as price remains below the descending trendline, the broader structure stays bearish.
A confirmed daily breakout above the trendline would be the first early signal of a potential trend reversal. Waiting for confirmation is strongly recommended.
---
#TURBO #TURBOUSDT #CryptoAnalysis #Altcoin #TechnicalAnalysis #Downtrend #Trendline #Breakout #Bearish #Bullish #PriceAction
Turbo
TURBOUSDT UPDATE#TURBO
UPDATE
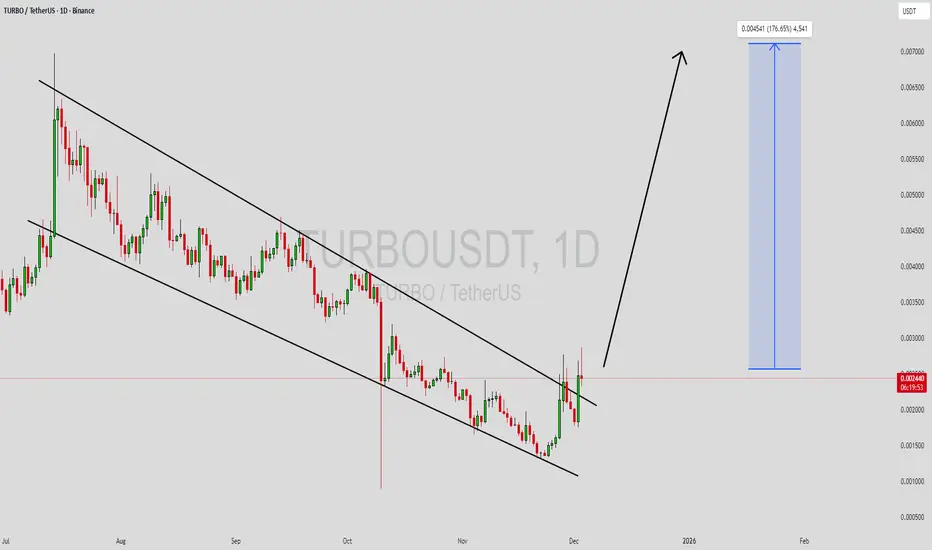
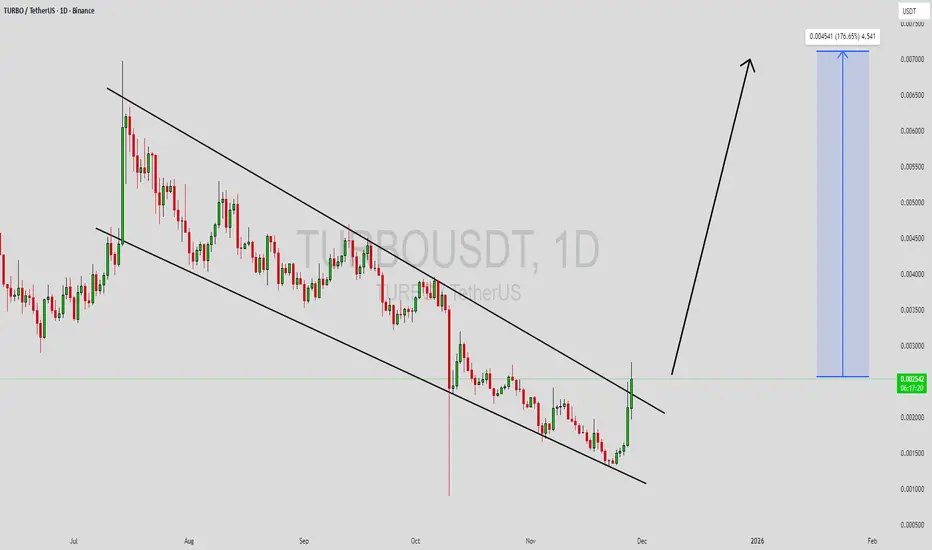
TURBO Technical Setup
Pattern: Falling Wedge Pattern
Current Price: 0.001975$
Target Price: 0.003172$
Target % Gain: 175.44%
Technical Analysis: TURBO is breaking out of a falling wedge pattern on the 1D chart, indicating bullish potential. Price has pushed above the descending resistance trendline after a prolonged downtrend, suggesting a possible trend reversal. The projected upside move aligns with the measured target highlighted on the chart.
Time Frame: 1D
Risk Management Tip: Always use proper risk management.

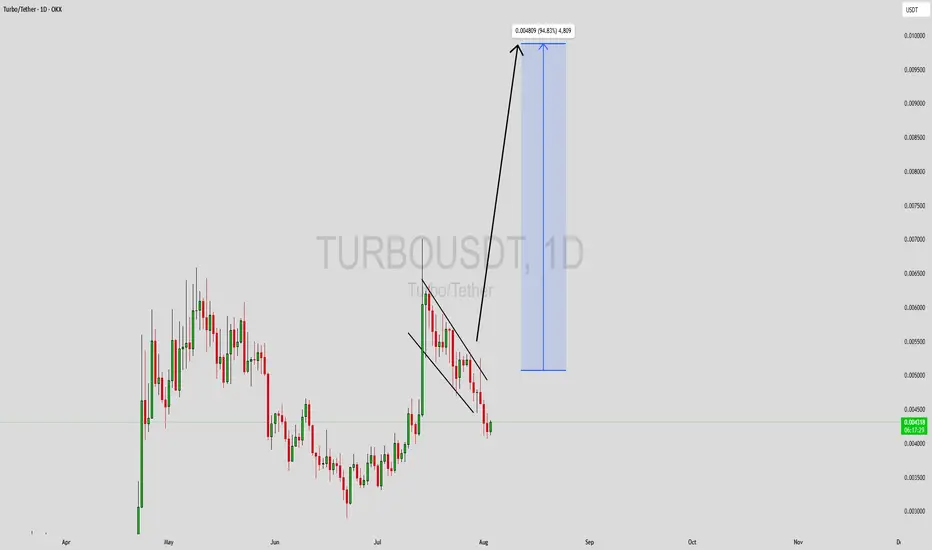
TURBO Impulse Followed by Healthy RetracementTURBO printed a strong impulsive move to the upside after a base formation, clearly shifting short-term momentum bullish. Following this expansion, price entered a corrective phase and is now retracing into a well-defined demand zone aligned with Fibonacci retracement levels.
This pullback is so far constructive rather than bearish. As long as price holds above the highlighted demand region, the structure supports continuation toward the previous high and potentially into the upper resistance zone near zero point zero zero two two.
If the demand zone fails to hold, the retracement could extend deeper toward the lower support area around zero point zero zero one six, delaying continuation and resetting structure.
This setup is based on impulse and retracement behavior, demand reaction, and Fibonacci confluence. Confirmation from the demand zone will determine the next directional leg.

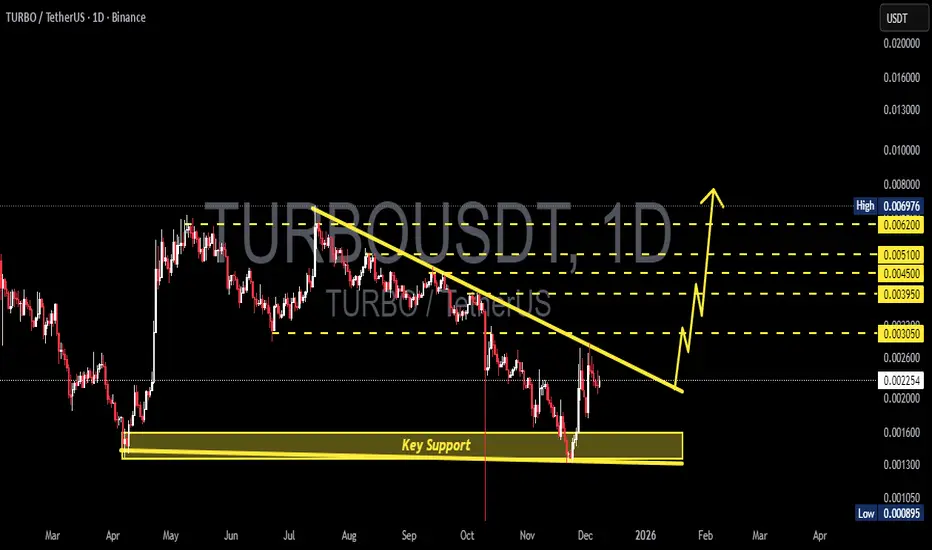
TURBO/USDT — Decision Point: Reversal Incoming or Breakdown?TURBO/USDT is approaching its “Decision Point” — a moment where the market must choose between continuing the multi-month downtrend or triggering a major reversal from a demand zone that has repeatedly saved the price from collapse.
For months, TURBO has been trapped beneath a descending trendline, with every bounce rejected by persistent selling pressure.
But now something different is happening:
Price has once again bounced strongly from the Key Support at 0.00135 – 0.0016, a zone that has acted as the base of every recovery since April.
In simple terms:
If TURBO is ever going to reverse, this is the place.
---
Why This Yellow Zone Matters So Much
The 0.00135 – 0.0016 support is a historical demand zone.
Each touch has produced strong wicks, sharp rejections, or recovery legs.
Sellers appear to be losing momentum in this area.
This zone defines market psychology:
Breakdown = capitulation.
Breakout = reversal ignition.
There is no more important battlefield on this chart.
---
The Big Pattern Forming
The structure combines:
Descending trendline → ongoing bearish pressure
Flat horizontal support (yellow zone) → strong demand floor
Potential descending triangle structure — but with signs of bounce strength that could cause a triangle failure, which often triggers explosive upside.
When a descending triangle fails to break down, trapped shorts fuel a rally.
TURBO is approaching exactly this type of setup — but it requires a confirmed trendline breakout.
---
Bullish Scenario (The Exciting One)
Key confirmation:
✔ Daily candle close above the descending trendline
✔ Retest turning the trendline into support
If this happens, the entire market structure shifts into early reversal mode.
Potential upside targets:
0.00305 → first resistance
0.00395 – 0.00450 → major supply block
0.00510 → structural retest level
0.00620 → extended target if momentum accelerates
If TURBO breaks and retests the trendline cleanly…
This could turn into a powerful swing reversal.
---
Bearish Scenario (If Support Breaks)
Bearish confirmation: daily close below 0.00135
This would mean:
Demand zone is broken
Market structure returns fully bearish
Next key target: 0.000895
Increased probability of setting new lower lows
This scenario represents a capitulation phase where recoveries become much harder.
---
TURBO is balancing on its final major foundation — a historical demand zone that will decide between a major trend reversal or the continuation of the macro downtrend.
Breakout above the trendline = bullish structure shift + high-reward upside.
Breakdown of 0.00135 = full bearish continuation.
This is one of those setups where:
risk is small, but the decision and direction will be massive.
#TURBO #TURBOUSDT #CryptoTA #MarketStructure #BreakoutSetup #AltcoinAnalysis #SupportAndResistance #TrendlineBreak #DemandZone
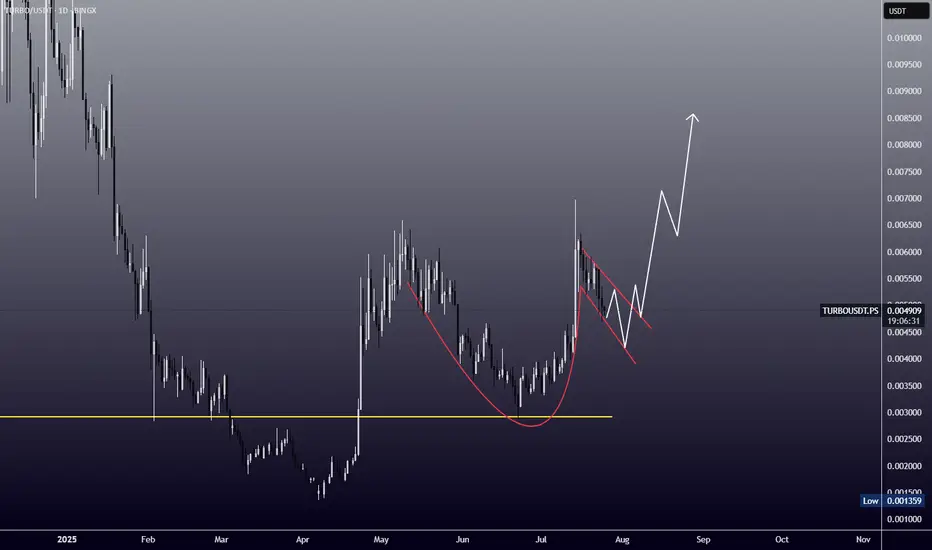
TURBOUSDT Forming Falling WedgeTURBOUSDT is forming a clear falling wedge pattern, a classic bullish reversal signal that often indicates an upcoming breakout. The price has been consolidating within a narrowing range, suggesting that selling pressure is weakening while buyers are beginning to regain control. With consistent volume confirming accumulation at lower levels, the setup hints at a potential bullish breakout soon. The projected move could lead to an impressive gain of around 140% to 150% once the price breaks above the wedge resistance.
This falling wedge pattern is typically seen at the end of downtrends or corrective phases, and it represents a potential shift in market sentiment from bearish to bullish. Traders closely watching TURBOUSDT are noting the strengthening momentum as it nears a breakout zone. The good trading volume adds confidence to this pattern, showing that market participants are positioning early in anticipation of a reversal.
Investors’ growing interest in TURBOUSDT reflects rising confidence in the project’s long-term fundamentals and current technical strength. If the breakout confirms with sustained volume, this could mark the start of a fresh bullish leg. Traders might find this a valuable setup for medium-term gains, especially as the wedge pattern completes and buying momentum accelerates.
✅ Show your support by hitting the like button and
✅ Leaving a comment below! (What is your opinion about this Coin?)
Your feedback and engagement keep me inspired to share more insightful market analysis with you!
TURBO/USDT : SELLHello friends
Given the good pump we had, this currency was unable to stabilize the price above the specified resistance, which means that buyers were unable to decisively break the resistance and when this happens, the price can correct.
This analysis is purely from a technical perspective and is not a buy or sell recommendation.
*Trade safely with us*

TURBOUSDT Forming Falling WedgeTURBOUSDT is forming a clear falling wedge pattern, a classic bullish reversal signal that often indicates an upcoming breakout. The price has been consolidating within a narrowing range, suggesting that selling pressure is weakening while buyers are beginning to regain control. With consistent volume confirming accumulation at lower levels, the setup hints at a potential bullish breakout soon. The projected move could lead to an impressive gain of around 140% to 150% once the price breaks above the wedge resistance.
This falling wedge pattern is typically seen at the end of downtrends or corrective phases, and it represents a potential shift in market sentiment from bearish to bullish. Traders closely watching TURBOUSDT are noting the strengthening momentum as it nears a breakout zone. The good trading volume adds confidence to this pattern, showing that market participants are positioning early in anticipation of a reversal.
Investors’ growing interest in TURBOUSDT reflects rising confidence in the project’s long-term fundamentals and current technical strength. If the breakout confirms with sustained volume, this could mark the start of a fresh bullish leg. Traders might find this a valuable setup for medium-term gains, especially as the wedge pattern completes and buying momentum accelerates.
✅ Show your support by hitting the like button and
✅ Leaving a comment below! (What is your opinion about this Coin?)
Your feedback and engagement keep me inspired to share more insightful market analysis with you!
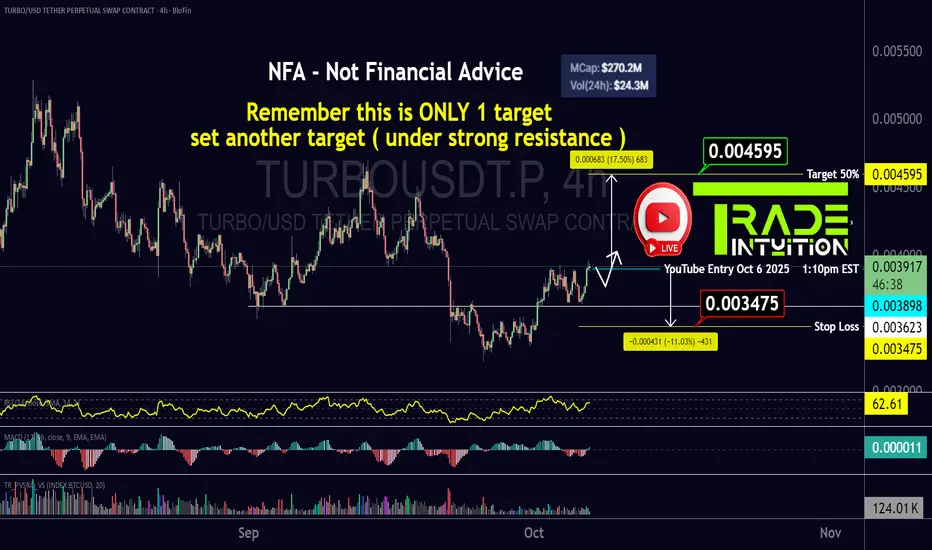
TURBO with Bullish Pattern - Ready to Go !Talked about this on todays Live Stream
Broke out of side ways accumulation
and is now currently in another side ways accumulation
(bull flag - bullish pattern)
Price action at top of accumulation range
- would like to see a retracement
( about the mid-line of the zone )
before upward continuation
Instructions on chart
NFA - Not Financial Advice
Join the Streams for Free Mentorship
TURBO : Points I want to buyHello friends
Given the good growth we had, we have now achieved important price support with Fibonacci in the price pullback and I think the price can move from these areas to the specified targets.
*Trade safely with us*

TURBOUSDT UPDATE#TURBO
UPDATE
TURBO Technical Setup
Pattern: Bullish Falling Wedge Pattern
Current Price: $0.00445
Target Price: $0.00650
Target % Gain: 50.49%
MYX:TURBO is breaking out of a falling wedge on the 1D timeframe. The breakout confirms bullish momentum with structure favoring continuation toward $0.00650. Always use proper risk management.
Time Frame: 1D
Risk Management Tip: Always use proper risk management.
TURBOUSDT Forming Falling WedgeTURBOUSDT is showing a breakout from a falling wedge pattern on the daily chart, which is a strong bullish reversal signal. After a period of consolidation and steady accumulation, the price has pushed above resistance, confirming momentum shift in favor of buyers. With good volume supporting the move, the setup looks technically strong for further continuation.
The projected target indicates a potential 50% to 60% gain from the current price zone, making this a promising opportunity for swing traders. Falling wedge breakouts are often followed by sharp upside rallies, and if momentum sustains, TURBOUSDT could quickly test higher levels.
Investor interest is steadily increasing as the chart structure aligns with favorable technicals, suggesting that market sentiment is turning bullish. Keeping an eye on follow-through volume will be crucial for confirmation of the next leg upward.
✅ Show your support by hitting the like button and
✅ Leaving a comment below! (What is You opinion about this Coin)
Your feedback and engagement keep me inspired to share more insightful market analysis with you!
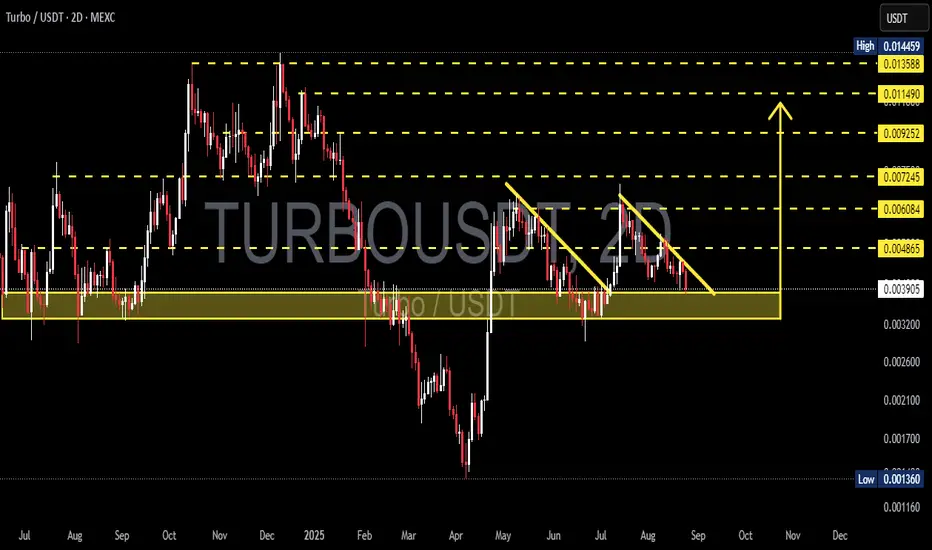
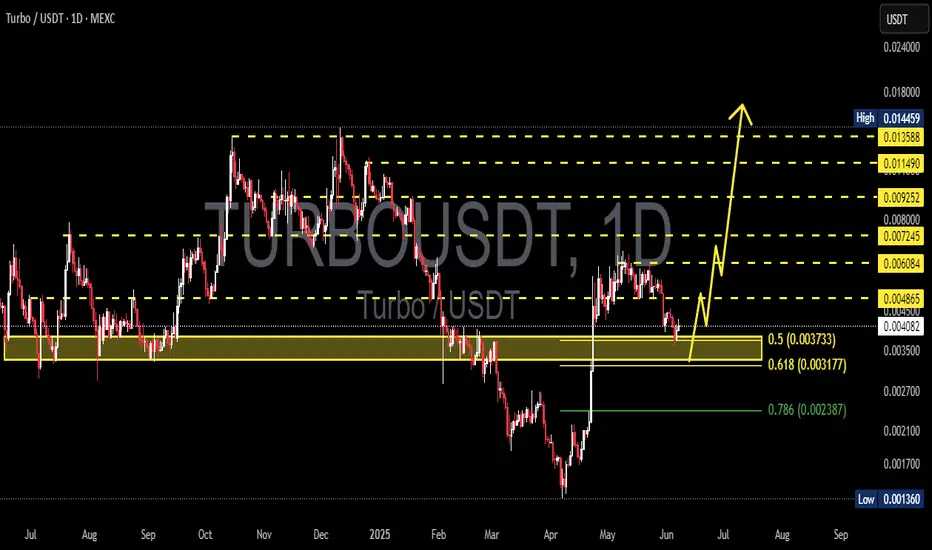
TURBO/USDT – at Key Demand Zone! Falling Wedge Near Breakout?📊 Full Analysis:
Currently, TURBO/USDT is trading at a very critical level. The chart shows price consistently being pressed down by the descending trendline (yellow), forming a Falling Wedge pattern—a structure that often signals a bullish reversal once broken to the upside.
At the same time, price is holding right above the historical demand zone 0.0033–0.0040 (yellow box), which has acted as strong accumulation and defended multiple downside attempts in the past. In other words, this zone is the last stand for the bulls to maintain the structure.
---
🔹 Pattern & Key Levels
Falling Wedge:
Sellers are losing momentum as volatility compresses. Statistically, this pattern tends to break upward, especially when supported by strong demand zones.
Demand Zone 0.0033–0.0040:
Strong support, repeatedly tested, still holding as the main bullish defense line.
Major Resistances & Targets:
0.004865 → 0.006084 → 0.007245 → 0.009252 → 0.011490 → 0.013588 (close to High 0.014459).
Supports if Broken:
0.0030 → 0.0026 → 0.0021 → 0.0017 → 0.001360 (historical Low).
---
🟢 Bullish Scenario
1. Trigger: Breakout above the descending trendline with a 2D close > 0.0041 confirms wedge breakout.
2. Healthy Retest: Holding 0.0040–0.0041 as new support after breakout strengthens the bullish case.
3. Targets (scale-out strategy):
Minor: 0.004865 → 0.006084
Mid: 0.007245 → 0.009252
Major: 0.011490 → 0.013588
4. Invalidation: If price fails and closes back < 0.0039 after breakout (fakeout risk).
---
🔴 Bearish Scenario
1. Trigger: Breakdown with 2D close < 0.0033 confirms demand zone failure.
2. Downside Targets: 0.0030 → 0.0026 → 0.0021 → 0.0017 → 0.001360 (historical Low).
3. Invalidation: Bearish outlook invalidated if price reclaims and holds > 0.0041.
---
📌 Conclusion & Strategy
The chart highlights a critical battle between bulls and bears at a strong historical demand zone.
Bullish case: More attractive due to the Falling Wedge + solid support, but requires a confirmed breakout to validate.
Bearish case: Activated only if demand breaks down, opening doors for deeper continuation to historical lows.
Risk management is essential: use stops below demand (0.0033) if long, and scale out profits gradually at resistance levels.
#TURBO #TURBOUSDT #CryptoTA #TechnicalAnalysis #PriceAction #SupportResistance #FallingWedge #Breakout #Altcoins #RiskManagement #CryptoTrading
TURBOUSDT Forming Bullish PennantTURBOUSDT is currently exhibiting a bullish pennant pattern on the charts—a continuation setup that often leads to strong upward movement after a period of consolidation. This pattern typically forms after a sharp upward move, followed by a tightening range that resembles a pennant or small symmetrical triangle. The breakout from this structure is generally explosive, especially when backed by strong volume. TURBOUSDT has seen just that—an increase in trading volume that aligns with growing investor confidence.
The technical structure suggests that the recent consolidation phase is nearing its end, and a breakout to the upside could potentially yield a move of 80% to 90% or more. Bullish pennants are powerful indicators of renewed buying interest, and with price coiling near resistance, the odds of a breakout are increasing. Traders are watching this setup closely for confirmation, as a successful breakout could attract further momentum and trigger a new bullish trend leg.
Beyond the technicals, TURBO’s growing presence in the meme and altcoin sectors has captured investor attention. The project has been gaining traction due to its unique branding, active community engagement, and listings on major exchanges. These fundamental strengths further reinforce the bullish outlook from a technical standpoint.
If the breakout confirms with strong volume, this could be one of the top short-term opportunities in the current market. Keep a close eye on the price action in the coming sessions as the pattern nears its apex—TURBOUSDT could soon enter a high-velocity rally phase.
✅ Show your support by hitting the like button and
✅ Leaving a comment below! (What is You opinion about this Coin)
Your feedback and engagement keep me inspired to share more insightful market analysis with you!
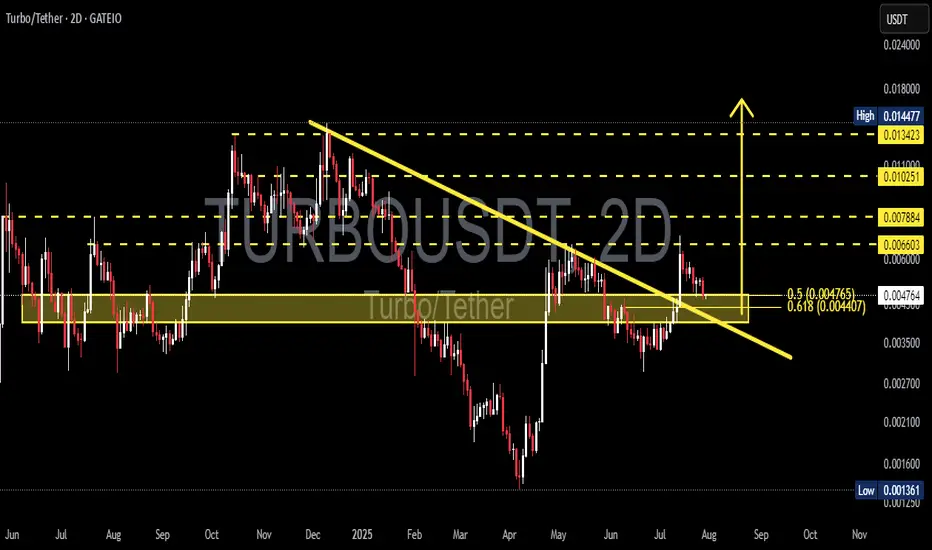
TURBO/USDT: Critical Decision Point – Breakout or Bull Trap?🧩 Overview
TURBO/USDT is currently sitting at a decisive technical juncture. After a prolonged downtrend since its late 2024 peak, the price has recently shown signs of a momentum shift by breaking out from a major descending trendline. The key question now: Is this the beginning of a bullish reversal, or just a temporary fakeout?
---
📉 Pattern Breakdown
Descending Triangle Breakout (Confirmed)
This classical bearish continuation pattern had formed since November 2024 with consistent lower highs. The recent breakout to the upside suggests a shift in market sentiment.
Historical Accumulation Zone (Demand Zone)
The yellow horizontal box (around 0.0042 – 0.0047 USDT) has acted as a strong historical accumulation and reaction area.
Golden Pocket Retest (Fibonacci 0.5 – 0.618)
The price is currently retesting the golden pocket retracement zone, which often acts as a decision zone for institutional buyers and swing traders.
---
📈 Bullish Scenario (Breakout Confirmation)
If the price holds above the golden pocket zone and prints a higher low, we could see:
🎯 Next Bullish Targets:
0.00660 USDT – Minor resistance
0.00788 USDT – Psychological level
0.01025 USDT – Mid-range resistance
0.01342 USDT – Major key level before recent highs
0.01447 USDT – Local high and full breakout target
✅ Bullish Confirmation:
A strong 2D candle close above 0.0066 with rising volume would validate the bullish breakout and signal continuation.
---
📉 Bearish Scenario (Fakeout Risk)
If price fails to hold the 0.0044 – 0.0047 USDT range and breaks back down:
🔻 Bearish Targets:
0.0035 USDT – Previous local support
0.0025 USDT – Old consolidation zone
0.00136 USDT – All-time low (last defense level)
❗️Bearish Confirmation:
A breakdown below 0.0044 USDT with bearish volume would invalidate the breakout and open the door for deeper downside.
---
🧠 Additional Insights
The initial breakout had solid volume, but current price action is testing the breakout validity.
RSI or momentum indicators (not shown here) should be monitored for divergence or confluence with this setup.
---
📌 Conclusion
> TURBO/USDT is at a make-or-break moment. While the breakout from the descending triangle is a strong bullish signal, the retest of the golden pocket zone must hold to confirm the trend reversal. Failure to do so could turn this into a bull trap with deeper downside risk.
⏳ Eyes on this level — market is choosing a direction.
#TURBO #USDT #CryptoAnalysis #BreakoutOrFakeout #TechnicalAnalysis #DescendingTriangle #FibonacciGoldenPocket #BullishScenario #BearishScenario #AltcoinWatch #CryptoTrading
Cup and handle on TOSHIEvery time I look at the TURBO chart I can't help but see this cup and handle formation.
TURBO/USDT - H4 - Wedge Breakout (29.06.2025)The TURBO/USDT pair on the H4 timeframe presents a Potential Buying Opportunity due to a recent Formation of a Wedge Breakout Pattern. This suggests a shift in momentum towards the upside and a higher likelihood of further advances in the coming Days.
Possible Long Trade:
Entry: Consider Entering A Long Position around Trendline Of The Pattern.
Target Levels:
1st Resistance – 0.005173
2nd Resistance – 0.005994
🎁 Please hit the like button and
🎁 Leave a comment to support for My Post !
Your likes and comments are incredibly motivating and will encourage me to share more analysis with you.
Best Regards, KABHI_TA_TRADING
Thank you.

TURBOUSDT 1D AnalysisTURBO ~ 1D Analysis
#TURBO Buy gradually from here if you still have confidence in this coin with a short term target of at least 15%+ from here. Long term target $0.0145
Buy in fear, sell in greed.Hello dears
Due to the price growth, now in the pullback you can buy in support areas in steps and move with it to the specified targets, of course with capital management.
*Trade safely with us*

TurboTurbo is cryptocurrency with low volume be careful
Entry price
0.0036
stop loss 0.0009
take profit
0.012
0.031
#TURBO/USDT#TURBO
The price is moving within a descending channel on the 1-hour frame, adhering well to it, and is heading for a strong breakout and retest.
We are seeing a bounce from the lower boundary of the descending channel, which is support at 0.005170.
We have a downtrend on the RSI indicator that is about to be broken and retested, supporting the upward trend.
We are looking for stability above the 100 moving average.
Entry price: 0.005466
First target: 0.005592
Second target: 0.005746
Third target: 0.005962

turboThere is a 50% selling pressure area against it that is likely to be allowed to enter the red box to stimulate buyers and this is if the green lines do not disappear
After that I think it can ......
Although there is a visible pattern for the price to increase
But I do not accept the risk of that area very much

TURBO price analysisWell, admit it, at least someone took a chance / was lucky enough to buy #TURBO at $0.0014-0.0015 with a pending limit order that they forgot about ?)
The price of OKX:TURBOUSDT rebounded well, now it would be a "blessing lucky" to buy this #memcoin at $0.0029-$0.0033
With the prospect of #Turbo continuing to grow at least to $0.010
_____________________
Did you like our analysis? Leave a comment, like, and follow to get more

#TURBO/USDT Trade Setup, 22% Scalping Signal!TURBO is ready for another round!
Entry:- .004212 to .003955.004744
Targets:
.004434
.004833
.005010
Stop Loss:- .003874
Leverage: 3x to 5x
Just keep your SL intact.
dyor, nfa.
Please hit the like button if you like these charts.
thank you
#PEACE
