TURBO/USDT – at Key Demand Zone! Falling Wedge Near Breakout?📊 Full Analysis:
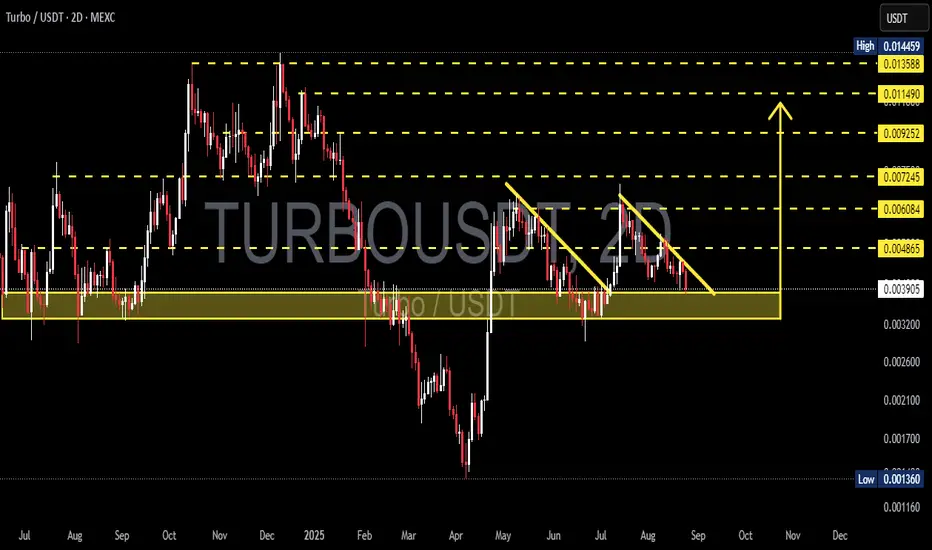
Currently, TURBO/USDT is trading at a very critical level. The chart shows price consistently being pressed down by the descending trendline (yellow), forming a Falling Wedge pattern—a structure that often signals a bullish reversal once broken to the upside.
At the same time, price is holding right above the historical demand zone 0.0033–0.0040 (yellow box), which has acted as strong accumulation and defended multiple downside attempts in the past. In other words, this zone is the last stand for the bulls to maintain the structure.
---
🔹 Pattern & Key Levels
Falling Wedge:
Sellers are losing momentum as volatility compresses. Statistically, this pattern tends to break upward, especially when supported by strong demand zones.
Demand Zone 0.0033–0.0040:
Strong support, repeatedly tested, still holding as the main bullish defense line.
Major Resistances & Targets:
0.004865 → 0.006084 → 0.007245 → 0.009252 → 0.011490 → 0.013588 (close to High 0.014459).
Supports if Broken:
0.0030 → 0.0026 → 0.0021 → 0.0017 → 0.001360 (historical Low).
---
🟢 Bullish Scenario
1. Trigger: Breakout above the descending trendline with a 2D close > 0.0041 confirms wedge breakout.
2. Healthy Retest: Holding 0.0040–0.0041 as new support after breakout strengthens the bullish case.
3. Targets (scale-out strategy):
Minor: 0.004865 → 0.006084
Mid: 0.007245 → 0.009252
Major: 0.011490 → 0.013588
4. Invalidation: If price fails and closes back < 0.0039 after breakout (fakeout risk).
---
🔴 Bearish Scenario
1. Trigger: Breakdown with 2D close < 0.0033 confirms demand zone failure.
2. Downside Targets: 0.0030 → 0.0026 → 0.0021 → 0.0017 → 0.001360 (historical Low).
3. Invalidation: Bearish outlook invalidated if price reclaims and holds > 0.0041.
---
📌 Conclusion & Strategy
The chart highlights a critical battle between bulls and bears at a strong historical demand zone.
Bullish case: More attractive due to the Falling Wedge + solid support, but requires a confirmed breakout to validate.
Bearish case: Activated only if demand breaks down, opening doors for deeper continuation to historical lows.
Risk management is essential: use stops below demand (0.0033) if long, and scale out profits gradually at resistance levels.
#TURBO #TURBOUSDT #CryptoTA #TechnicalAnalysis #PriceAction #SupportResistance #FallingWedge #Breakout #Altcoins #RiskManagement #CryptoTrading
Turbolong
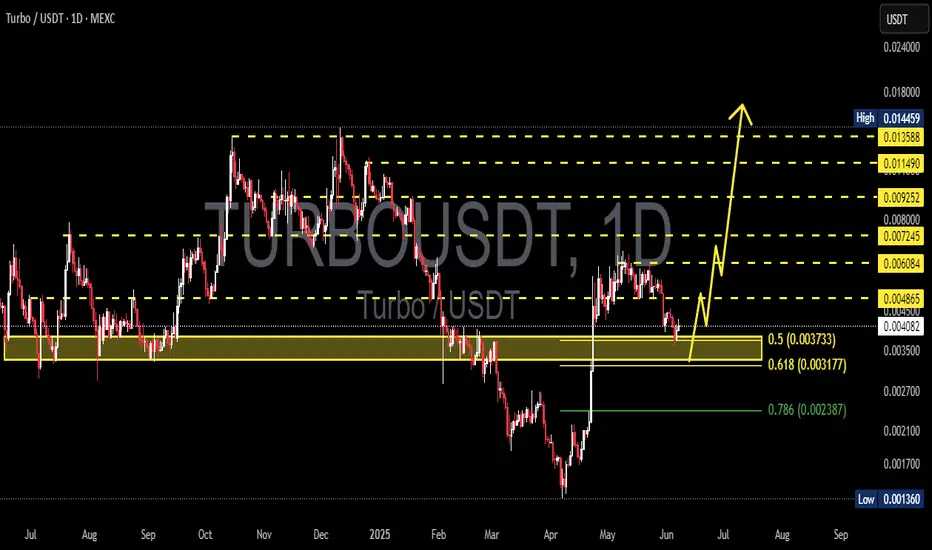
TURBOUSDT 1D AnalysisTURBO ~ 1D Analysis
#TURBO Buy gradually from here if you still have confidence in this coin with a short term target of at least 15%+ from here. Long term target $0.0145
#TURBO/USDT#TURBO
The price is moving within a descending channel on the 1-hour frame, adhering well to it, and is heading for a strong breakout and retest.
We are seeing a bounce from the lower boundary of the descending channel, which is support at 0.005170.
We have a downtrend on the RSI indicator that is about to be broken and retested, supporting the upward trend.
We are looking for stability above the 100 moving average.
Entry price: 0.005466
First target: 0.005592
Second target: 0.005746
Third target: 0.005962

#TURBO/USDT#TURBO
The price is moving in a descending channel on the 1-hour frame and is adhering to it well and is heading to break it strongly upwards and retest it
We have a bounce from the lower limit of the descending channel, this support is at a price of 0.003600
We have a downtrend on the RSI indicator that is about to be broken and retested, which supports the rise
We have a trend to stabilize above the Moving Average 100
Entry price 0.003623
First target 0.003758
Second target 0.003845
Third target 0.003950

TURBOUSDT 3DTURBO ~ 3D Analysis
#TURBO Two buy zones that you might be able to consider. Buy gradually with a minimum target of 20%++.

TURBOUSDT 1DTURBO ~ 1D
#TURBO So far it still maintains this support block,. Buy gradually on this support block,. Minimum target 15%++

TURBOUSDT 1DTURBO ~ 1D
#TURBO If you still have Conviction on the coin,. Buy gradually on this support block,. or buy after breaking through this resistance line. Target 20%++

#TURBO/USDT#TURBO
The price is moving in a descending channel on the 4-hour frame and sticking to it well
We have a bounce from the lower limit of the descending channel and we are now touching this support at a price of 0.0092200
We have a downtrend on the RSI indicator that is about to be broken, which supports the rise
We have a trend to stabilize above the moving average 100
Entry price 0.009552
First target 0.010277
Second target 0.011034
Third target 0.011924
