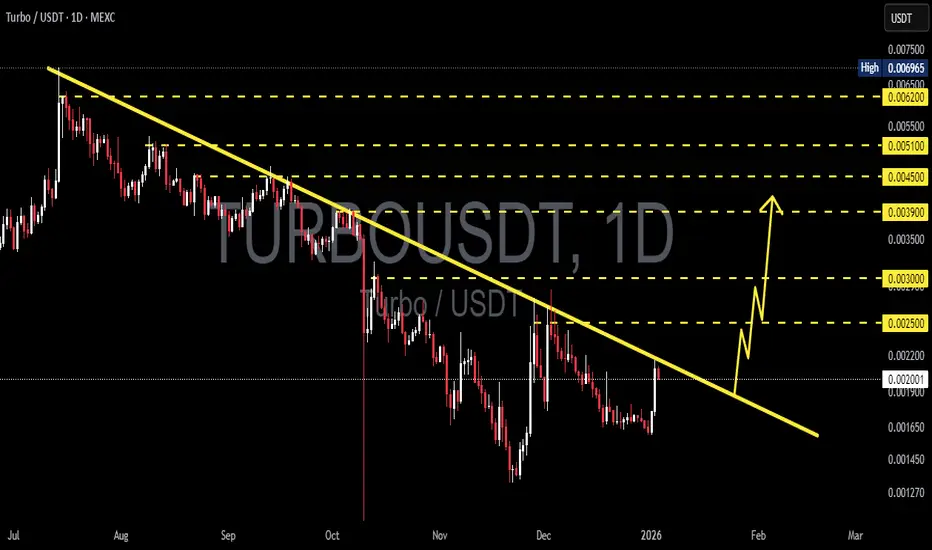
TURBO/USDT Major Downtrend Under Pressure Breakout or Rejection?TURBO/USDT on the 1D timeframe is still moving within a clear medium-term downtrend structure. Price continues to print lower highs and lower lows, capped by a well-respected descending trendline that has been tested multiple times since the previous peak. Currently, price is making a short-term bullish pullback and approaching this critical trendline area.
---
Pattern Explanation
The dominant structure is a Descending Trendline (Bearish Bias).
However, recent price action shows a relief rally, which could evolve into:
An early bullish breakout, if price breaks and holds above the trendline.
A continuation lower high, if price gets rejected and fails at resistance.
This places price in a key decision zone.
---
Key Levels
Resistance Zones:
0.00250 – minor resistance
0.00300 – key resistance
0.00390 – structural resistance
0.00450 – major resistance
0.00510 – supply zone
0.00620 – extreme resistance / previous distribution
Support Zones:
0.00200 – short-term support
0.00165 – critical support
0.00145 – last major support
---
Bullish Scenario
Bullish confirmation occurs if:
Price breaks and closes strongly above the descending trendline on the daily timeframe.
Followed by a clean retest with increasing volume.
Potential upside targets:
0.00250
0.00300
0.00390
0.00450
A clean break above 0.00300 could signal an early medium-term trend reversal.
---
Bearish Scenario
Bearish continuation remains valid if:
Price fails to break the trendline and forms a strong rejection candle.
Strong selling pressure appears around 0.00250 – 0.00300.
Potential downside targets:
0.00200
0.00165
0.00145
A breakdown below 0.00165 may open the door for further downside continuation.
---
Conclusion
TURBO/USDT is currently trading at a highly critical technical zone. As long as price remains below the descending trendline, the broader structure stays bearish.
A confirmed daily breakout above the trendline would be the first early signal of a potential trend reversal. Waiting for confirmation is strongly recommended.
---
#TURBO #TURBOUSDT #CryptoAnalysis #Altcoin #TechnicalAnalysis #Downtrend #Trendline #Breakout #Bearish #Bullish #PriceAction
Turbousdanalysis
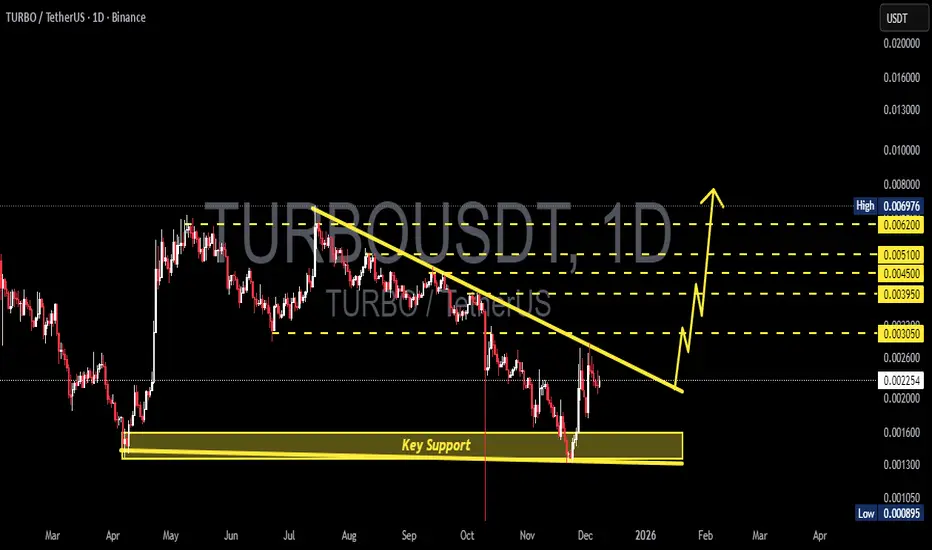
TURBO/USDT — Decision Point: Reversal Incoming or Breakdown?TURBO/USDT is approaching its “Decision Point” — a moment where the market must choose between continuing the multi-month downtrend or triggering a major reversal from a demand zone that has repeatedly saved the price from collapse.
For months, TURBO has been trapped beneath a descending trendline, with every bounce rejected by persistent selling pressure.
But now something different is happening:
Price has once again bounced strongly from the Key Support at 0.00135 – 0.0016, a zone that has acted as the base of every recovery since April.
In simple terms:
If TURBO is ever going to reverse, this is the place.
---
Why This Yellow Zone Matters So Much
The 0.00135 – 0.0016 support is a historical demand zone.
Each touch has produced strong wicks, sharp rejections, or recovery legs.
Sellers appear to be losing momentum in this area.
This zone defines market psychology:
Breakdown = capitulation.
Breakout = reversal ignition.
There is no more important battlefield on this chart.
---
The Big Pattern Forming
The structure combines:
Descending trendline → ongoing bearish pressure
Flat horizontal support (yellow zone) → strong demand floor
Potential descending triangle structure — but with signs of bounce strength that could cause a triangle failure, which often triggers explosive upside.
When a descending triangle fails to break down, trapped shorts fuel a rally.
TURBO is approaching exactly this type of setup — but it requires a confirmed trendline breakout.
---
Bullish Scenario (The Exciting One)
Key confirmation:
✔ Daily candle close above the descending trendline
✔ Retest turning the trendline into support
If this happens, the entire market structure shifts into early reversal mode.
Potential upside targets:
0.00305 → first resistance
0.00395 – 0.00450 → major supply block
0.00510 → structural retest level
0.00620 → extended target if momentum accelerates
If TURBO breaks and retests the trendline cleanly…
This could turn into a powerful swing reversal.
---
Bearish Scenario (If Support Breaks)
Bearish confirmation: daily close below 0.00135
This would mean:
Demand zone is broken
Market structure returns fully bearish
Next key target: 0.000895
Increased probability of setting new lower lows
This scenario represents a capitulation phase where recoveries become much harder.
---
TURBO is balancing on its final major foundation — a historical demand zone that will decide between a major trend reversal or the continuation of the macro downtrend.
Breakout above the trendline = bullish structure shift + high-reward upside.
Breakdown of 0.00135 = full bearish continuation.
This is one of those setups where:
risk is small, but the decision and direction will be massive.
#TURBO #TURBOUSDT #CryptoTA #MarketStructure #BreakoutSetup #AltcoinAnalysis #SupportAndResistance #TrendlineBreak #DemandZone
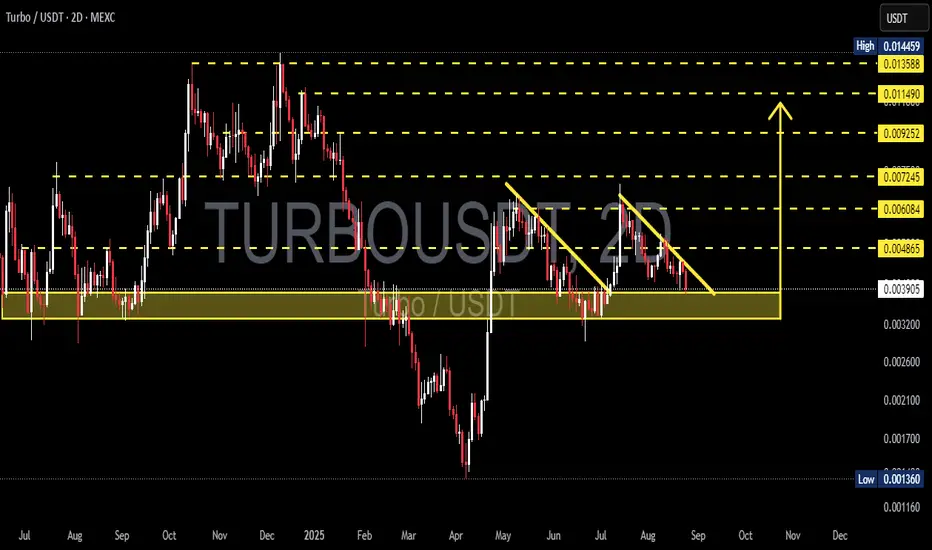
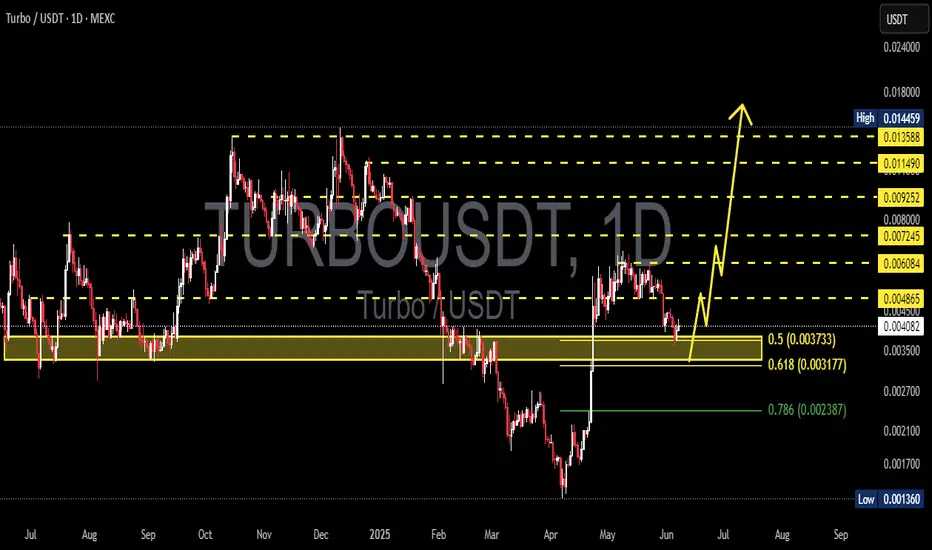
TURBO/USDT – at Key Demand Zone! Falling Wedge Near Breakout?📊 Full Analysis:
Currently, TURBO/USDT is trading at a very critical level. The chart shows price consistently being pressed down by the descending trendline (yellow), forming a Falling Wedge pattern—a structure that often signals a bullish reversal once broken to the upside.
At the same time, price is holding right above the historical demand zone 0.0033–0.0040 (yellow box), which has acted as strong accumulation and defended multiple downside attempts in the past. In other words, this zone is the last stand for the bulls to maintain the structure.
---
🔹 Pattern & Key Levels
Falling Wedge:
Sellers are losing momentum as volatility compresses. Statistically, this pattern tends to break upward, especially when supported by strong demand zones.
Demand Zone 0.0033–0.0040:
Strong support, repeatedly tested, still holding as the main bullish defense line.
Major Resistances & Targets:
0.004865 → 0.006084 → 0.007245 → 0.009252 → 0.011490 → 0.013588 (close to High 0.014459).
Supports if Broken:
0.0030 → 0.0026 → 0.0021 → 0.0017 → 0.001360 (historical Low).
---
🟢 Bullish Scenario
1. Trigger: Breakout above the descending trendline with a 2D close > 0.0041 confirms wedge breakout.
2. Healthy Retest: Holding 0.0040–0.0041 as new support after breakout strengthens the bullish case.
3. Targets (scale-out strategy):
Minor: 0.004865 → 0.006084
Mid: 0.007245 → 0.009252
Major: 0.011490 → 0.013588
4. Invalidation: If price fails and closes back < 0.0039 after breakout (fakeout risk).
---
🔴 Bearish Scenario
1. Trigger: Breakdown with 2D close < 0.0033 confirms demand zone failure.
2. Downside Targets: 0.0030 → 0.0026 → 0.0021 → 0.0017 → 0.001360 (historical Low).
3. Invalidation: Bearish outlook invalidated if price reclaims and holds > 0.0041.
---
📌 Conclusion & Strategy
The chart highlights a critical battle between bulls and bears at a strong historical demand zone.
Bullish case: More attractive due to the Falling Wedge + solid support, but requires a confirmed breakout to validate.
Bearish case: Activated only if demand breaks down, opening doors for deeper continuation to historical lows.
Risk management is essential: use stops below demand (0.0033) if long, and scale out profits gradually at resistance levels.
#TURBO #TURBOUSDT #CryptoTA #TechnicalAnalysis #PriceAction #SupportResistance #FallingWedge #Breakout #Altcoins #RiskManagement #CryptoTrading
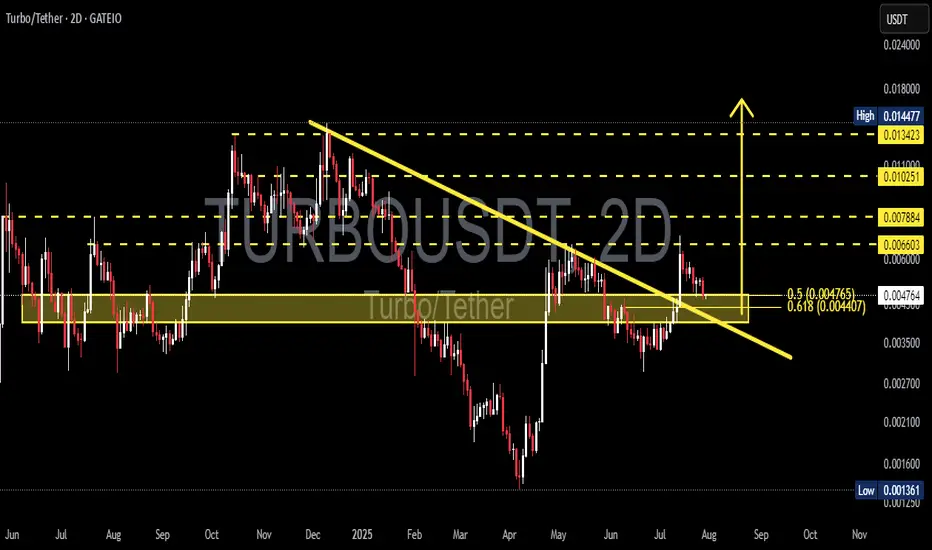
TURBO/USDT: Critical Decision Point – Breakout or Bull Trap?🧩 Overview
TURBO/USDT is currently sitting at a decisive technical juncture. After a prolonged downtrend since its late 2024 peak, the price has recently shown signs of a momentum shift by breaking out from a major descending trendline. The key question now: Is this the beginning of a bullish reversal, or just a temporary fakeout?
---
📉 Pattern Breakdown
Descending Triangle Breakout (Confirmed)
This classical bearish continuation pattern had formed since November 2024 with consistent lower highs. The recent breakout to the upside suggests a shift in market sentiment.
Historical Accumulation Zone (Demand Zone)
The yellow horizontal box (around 0.0042 – 0.0047 USDT) has acted as a strong historical accumulation and reaction area.
Golden Pocket Retest (Fibonacci 0.5 – 0.618)
The price is currently retesting the golden pocket retracement zone, which often acts as a decision zone for institutional buyers and swing traders.
---
📈 Bullish Scenario (Breakout Confirmation)
If the price holds above the golden pocket zone and prints a higher low, we could see:
🎯 Next Bullish Targets:
0.00660 USDT – Minor resistance
0.00788 USDT – Psychological level
0.01025 USDT – Mid-range resistance
0.01342 USDT – Major key level before recent highs
0.01447 USDT – Local high and full breakout target
✅ Bullish Confirmation:
A strong 2D candle close above 0.0066 with rising volume would validate the bullish breakout and signal continuation.
---
📉 Bearish Scenario (Fakeout Risk)
If price fails to hold the 0.0044 – 0.0047 USDT range and breaks back down:
🔻 Bearish Targets:
0.0035 USDT – Previous local support
0.0025 USDT – Old consolidation zone
0.00136 USDT – All-time low (last defense level)
❗️Bearish Confirmation:
A breakdown below 0.0044 USDT with bearish volume would invalidate the breakout and open the door for deeper downside.
---
🧠 Additional Insights
The initial breakout had solid volume, but current price action is testing the breakout validity.
RSI or momentum indicators (not shown here) should be monitored for divergence or confluence with this setup.
---
📌 Conclusion
> TURBO/USDT is at a make-or-break moment. While the breakout from the descending triangle is a strong bullish signal, the retest of the golden pocket zone must hold to confirm the trend reversal. Failure to do so could turn this into a bull trap with deeper downside risk.
⏳ Eyes on this level — market is choosing a direction.
#TURBO #USDT #CryptoAnalysis #BreakoutOrFakeout #TechnicalAnalysis #DescendingTriangle #FibonacciGoldenPocket #BullishScenario #BearishScenario #AltcoinWatch #CryptoTrading
TURBOUSDT 1D AnalysisTURBO ~ 1D Analysis
#TURBO Buy gradually from here if you still have confidence in this coin with a short term target of at least 15%+ from here. Long term target $0.0145
TURBOUSDT 3DTURBO ~ 3D Analysis
#TURBO Two buy zones that you might be able to consider. Buy gradually with a minimum target of 20%++.

Will TURBOUSD Explode Higher? Or Are We Facing a Fakeout?Yello, Paradisers! Have you noticed how TURBOUSD has bounced from its minor support zone recently, hinting at a potential bullish reversal? The bullish I-CHoCH (Internal Change of Character) on the charts certainly has us paying close attention—but is this the real deal or just another trap? Let’s break it down.
💎Currently, TURBOUSD is trading within a resistance trendline that’s giving it a triangle-like pattern. This setup signals a decisive move ahead. If the price manages to break above the trendline and close a strong candle above it, the bullish probability will increase significantly, paving the way for a potential rally.
💎But let’s not forget about the risks here. If the market faces more retracement or panic selling, we could see TURBOUSD dip further to take out the below inducement level. In that scenario, it would be crucial to monitor the lower timeframes for another bullish I-CHoCH to confirm a possible bounce.
💎On the flip side, if the price breaks down and closes a candle below the key support zone, the entire bullish setup will be invalidated. In such a case, staying patient and waiting for stronger price action will be the smart move.
🎖As always, Paradisers, the key is to stay disciplined and let the market reveal its hand. Whether this triangle pattern resolves to the upside or downside, remember: consistency and patience will always win over impulsive decisions. Stay sharp and trade smart—this is the only way to make it long-term in the crypto game.
MyCryptoParadise
iFeel the success🌴

TURBOUSDT 1DTURBO ~ 1D
#TURBO So far it still maintains this support block,. Buy gradually on this support block,. Minimum target 15%++

TURBOUSDT 1DTURBO ~ 1D
#TURBO If you still have Conviction on the coin,. Buy gradually on this support block,. or buy after breaking through this resistance line. Target 20%++
