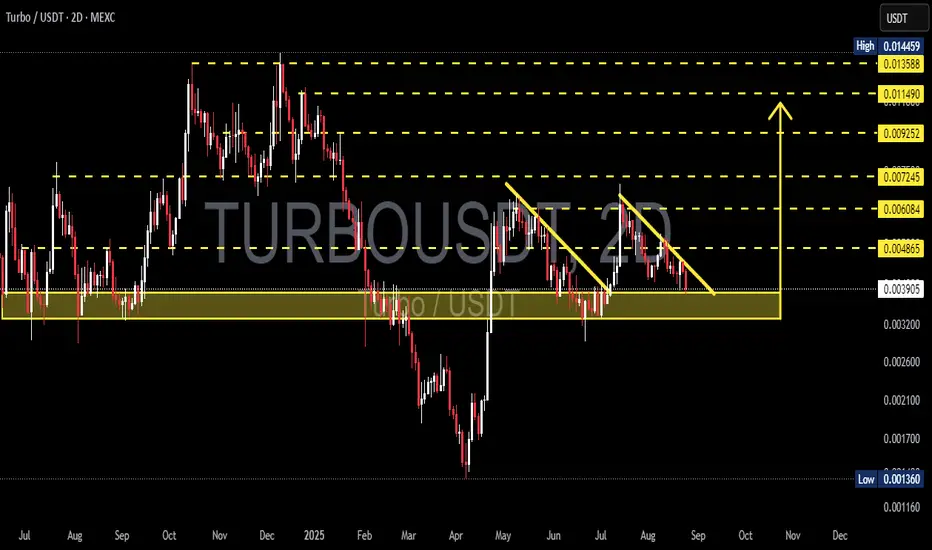
TURBO/USDT – at Key Demand Zone! Falling Wedge Near Breakout?📊 Full Analysis:
Currently, TURBO/USDT is trading at a very critical level. The chart shows price consistently being pressed down by the descending trendline (yellow), forming a Falling Wedge pattern—a structure that often signals a bullish reversal once broken to the upside.
At the same time, price is holding right above the historical demand zone 0.0033–0.0040 (yellow box), which has acted as strong accumulation and defended multiple downside attempts in the past. In other words, this zone is the last stand for the bulls to maintain the structure.
---
🔹 Pattern & Key Levels
Falling Wedge:
Sellers are losing momentum as volatility compresses. Statistically, this pattern tends to break upward, especially when supported by strong demand zones.
Demand Zone 0.0033–0.0040:
Strong support, repeatedly tested, still holding as the main bullish defense line.
Major Resistances & Targets:
0.004865 → 0.006084 → 0.007245 → 0.009252 → 0.011490 → 0.013588 (close to High 0.014459).
Supports if Broken:
0.0030 → 0.0026 → 0.0021 → 0.0017 → 0.001360 (historical Low).
---
🟢 Bullish Scenario
1. Trigger: Breakout above the descending trendline with a 2D close > 0.0041 confirms wedge breakout.
2. Healthy Retest: Holding 0.0040–0.0041 as new support after breakout strengthens the bullish case.
3. Targets (scale-out strategy):
Minor: 0.004865 → 0.006084
Mid: 0.007245 → 0.009252
Major: 0.011490 → 0.013588
4. Invalidation: If price fails and closes back < 0.0039 after breakout (fakeout risk).
---
🔴 Bearish Scenario
1. Trigger: Breakdown with 2D close < 0.0033 confirms demand zone failure.
2. Downside Targets: 0.0030 → 0.0026 → 0.0021 → 0.0017 → 0.001360 (historical Low).
3. Invalidation: Bearish outlook invalidated if price reclaims and holds > 0.0041.
---
📌 Conclusion & Strategy
The chart highlights a critical battle between bulls and bears at a strong historical demand zone.
Bullish case: More attractive due to the Falling Wedge + solid support, but requires a confirmed breakout to validate.
Bearish case: Activated only if demand breaks down, opening doors for deeper continuation to historical lows.
Risk management is essential: use stops below demand (0.0033) if long, and scale out profits gradually at resistance levels.
#TURBO #TURBOUSDT #CryptoTA #TechnicalAnalysis #PriceAction #SupportResistance #FallingWedge #Breakout #Altcoins #RiskManagement #CryptoTrading
TURBOUSDC
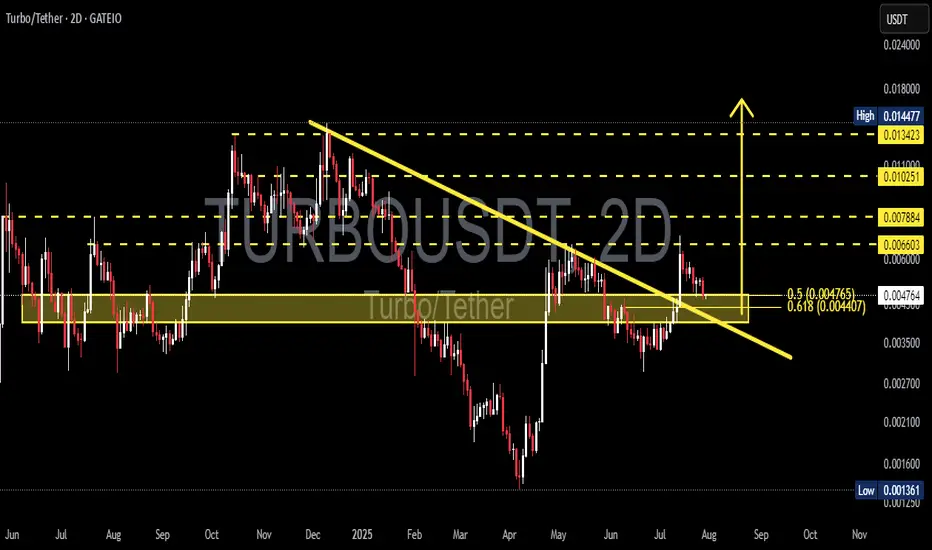
TURBO/USDT: Critical Decision Point – Breakout or Bull Trap?🧩 Overview
TURBO/USDT is currently sitting at a decisive technical juncture. After a prolonged downtrend since its late 2024 peak, the price has recently shown signs of a momentum shift by breaking out from a major descending trendline. The key question now: Is this the beginning of a bullish reversal, or just a temporary fakeout?
---
📉 Pattern Breakdown
Descending Triangle Breakout (Confirmed)
This classical bearish continuation pattern had formed since November 2024 with consistent lower highs. The recent breakout to the upside suggests a shift in market sentiment.
Historical Accumulation Zone (Demand Zone)
The yellow horizontal box (around 0.0042 – 0.0047 USDT) has acted as a strong historical accumulation and reaction area.
Golden Pocket Retest (Fibonacci 0.5 – 0.618)
The price is currently retesting the golden pocket retracement zone, which often acts as a decision zone for institutional buyers and swing traders.
---
📈 Bullish Scenario (Breakout Confirmation)
If the price holds above the golden pocket zone and prints a higher low, we could see:
🎯 Next Bullish Targets:
0.00660 USDT – Minor resistance
0.00788 USDT – Psychological level
0.01025 USDT – Mid-range resistance
0.01342 USDT – Major key level before recent highs
0.01447 USDT – Local high and full breakout target
✅ Bullish Confirmation:
A strong 2D candle close above 0.0066 with rising volume would validate the bullish breakout and signal continuation.
---
📉 Bearish Scenario (Fakeout Risk)
If price fails to hold the 0.0044 – 0.0047 USDT range and breaks back down:
🔻 Bearish Targets:
0.0035 USDT – Previous local support
0.0025 USDT – Old consolidation zone
0.00136 USDT – All-time low (last defense level)
❗️Bearish Confirmation:
A breakdown below 0.0044 USDT with bearish volume would invalidate the breakout and open the door for deeper downside.
---
🧠 Additional Insights
The initial breakout had solid volume, but current price action is testing the breakout validity.
RSI or momentum indicators (not shown here) should be monitored for divergence or confluence with this setup.
---
📌 Conclusion
> TURBO/USDT is at a make-or-break moment. While the breakout from the descending triangle is a strong bullish signal, the retest of the golden pocket zone must hold to confirm the trend reversal. Failure to do so could turn this into a bull trap with deeper downside risk.
⏳ Eyes on this level — market is choosing a direction.
#TURBO #USDT #CryptoAnalysis #BreakoutOrFakeout #TechnicalAnalysis #DescendingTriangle #FibonacciGoldenPocket #BullishScenario #BearishScenario #AltcoinWatch #CryptoTrading
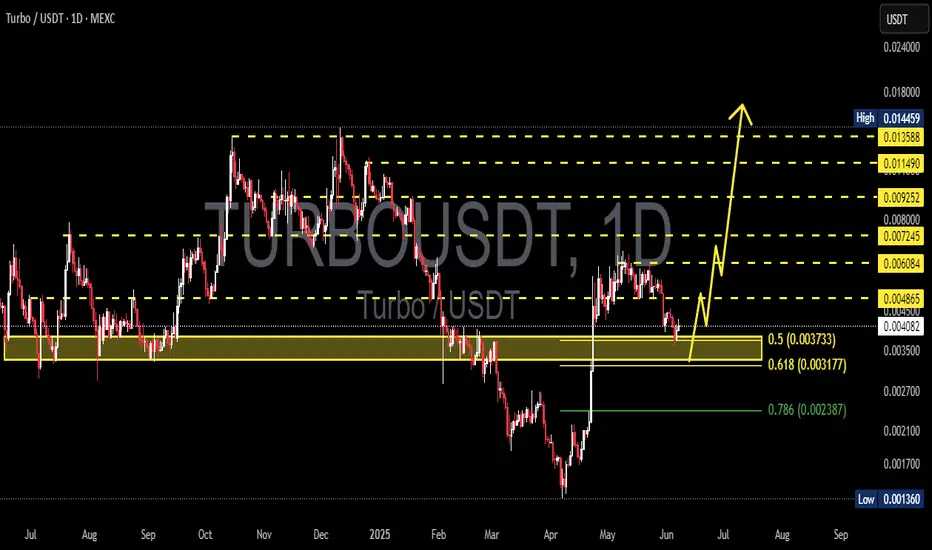
TURBOUSDT 1D AnalysisTURBO ~ 1D Analysis
#TURBO Buy gradually from here if you still have confidence in this coin with a short term target of at least 15%+ from here. Long term target $0.0145
#TURBO/USDT#TURBO
The price is moving within a descending channel on the 1-hour frame, adhering well to it, and is heading for a strong breakout and retest.
We are seeing a bounce from the lower boundary of the descending channel, which is support at 0.005170.
We have a downtrend on the RSI indicator that is about to be broken and retested, supporting the upward trend.
We are looking for stability above the 100 moving average.
Entry price: 0.005466
First target: 0.005592
Second target: 0.005746
Third target: 0.005962

TURBOUSDT 1DTURBO ~ 1D
#TURBO If you still have Conviction on this coin. Buy gradually within this support Block,. With a short term target of at least 15%++
