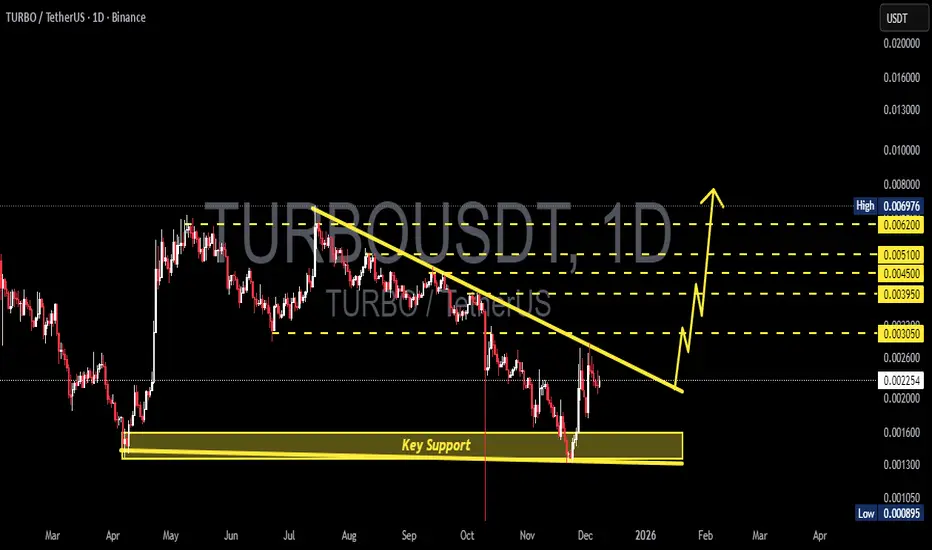
TURBO/USDT — Decision Point: Reversal Incoming or Breakdown?TURBO/USDT is approaching its “Decision Point” — a moment where the market must choose between continuing the multi-month downtrend or triggering a major reversal from a demand zone that has repeatedly saved the price from collapse.
For months, TURBO has been trapped beneath a descending trendline, with every bounce rejected by persistent selling pressure.
But now something different is happening:
Price has once again bounced strongly from the Key Support at 0.00135 – 0.0016, a zone that has acted as the base of every recovery since April.
In simple terms:
If TURBO is ever going to reverse, this is the place.
---
Why This Yellow Zone Matters So Much
The 0.00135 – 0.0016 support is a historical demand zone.
Each touch has produced strong wicks, sharp rejections, or recovery legs.
Sellers appear to be losing momentum in this area.
This zone defines market psychology:
Breakdown = capitulation.
Breakout = reversal ignition.
There is no more important battlefield on this chart.
---
The Big Pattern Forming
The structure combines:
Descending trendline → ongoing bearish pressure
Flat horizontal support (yellow zone) → strong demand floor
Potential descending triangle structure — but with signs of bounce strength that could cause a triangle failure, which often triggers explosive upside.
When a descending triangle fails to break down, trapped shorts fuel a rally.
TURBO is approaching exactly this type of setup — but it requires a confirmed trendline breakout.
---
Bullish Scenario (The Exciting One)
Key confirmation:
✔ Daily candle close above the descending trendline
✔ Retest turning the trendline into support
If this happens, the entire market structure shifts into early reversal mode.
Potential upside targets:
0.00305 → first resistance
0.00395 – 0.00450 → major supply block
0.00510 → structural retest level
0.00620 → extended target if momentum accelerates
If TURBO breaks and retests the trendline cleanly…
This could turn into a powerful swing reversal.
---
Bearish Scenario (If Support Breaks)
Bearish confirmation: daily close below 0.00135
This would mean:
Demand zone is broken
Market structure returns fully bearish
Next key target: 0.000895
Increased probability of setting new lower lows
This scenario represents a capitulation phase where recoveries become much harder.
---
TURBO is balancing on its final major foundation — a historical demand zone that will decide between a major trend reversal or the continuation of the macro downtrend.
Breakout above the trendline = bullish structure shift + high-reward upside.
Breakdown of 0.00135 = full bearish continuation.
This is one of those setups where:
risk is small, but the decision and direction will be massive.
#TURBO #TURBOUSDT #CryptoTA #MarketStructure #BreakoutSetup #AltcoinAnalysis #SupportAndResistance #TrendlineBreak #DemandZone
Turbousdtanalysis
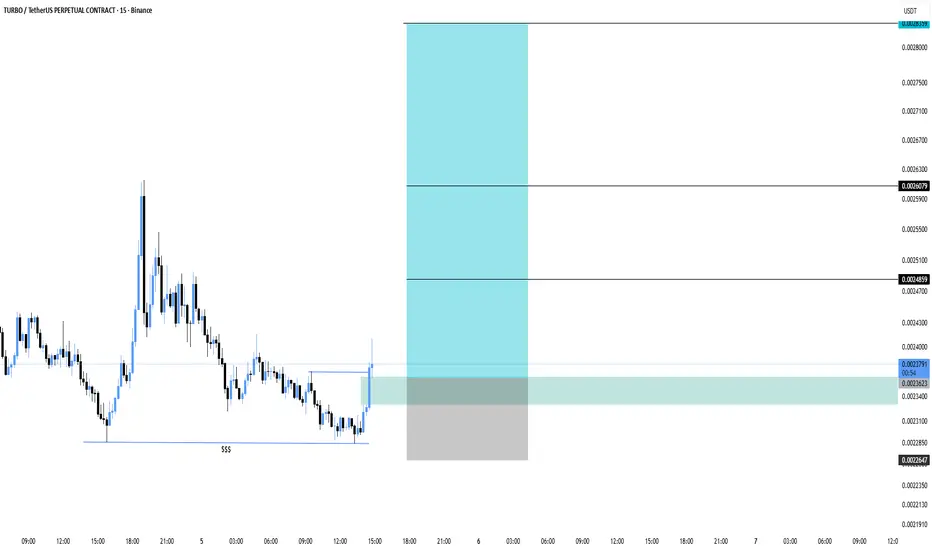
TURBO/USDT – Clean Long Setup After SweepPrice swept the liquidity (SSS) and instantly reacted with a strong bullish push. Structure is shifting short-term, giving a clean long opportunity as price taps the demand zone.
Entry: 0.0023623
Stop Loss: 0.0022647
TP1: 0.0024859
TP2: 0.0026079
Final TP: 0.0028359
#TURBO #TURBOUSDT #TURBOUSDTPERP
TURBO/USDT : SELLHello friends
Given the good pump we had, this currency was unable to stabilize the price above the specified resistance, which means that buyers were unable to decisively break the resistance and when this happens, the price can correct.
This analysis is purely from a technical perspective and is not a buy or sell recommendation.
*Trade safely with us*

TURBO : Points I want to buyHello friends
Given the good growth we had, we have now achieved important price support with Fibonacci in the price pullback and I think the price can move from these areas to the specified targets.
*Trade safely with us*

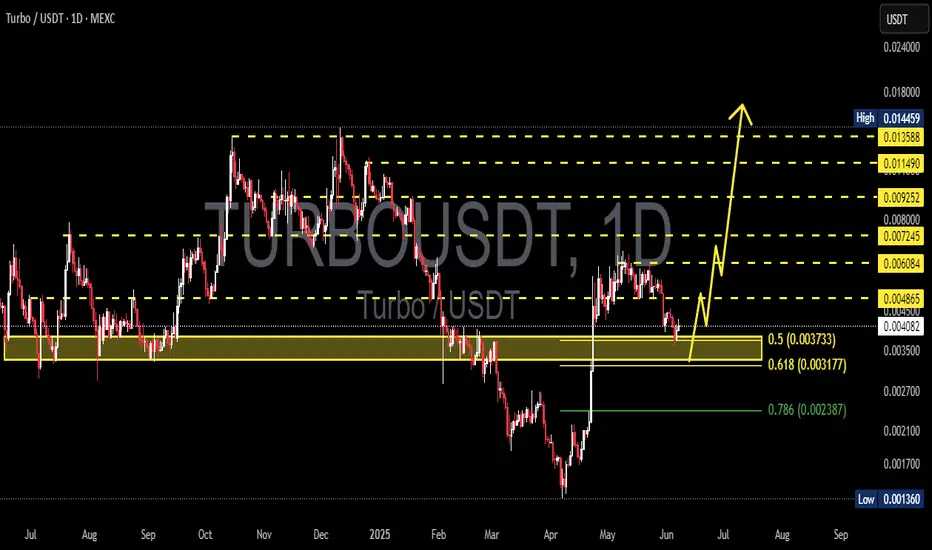
TURBO/USDT – at Key Demand Zone! Falling Wedge Near Breakout?📊 Full Analysis:
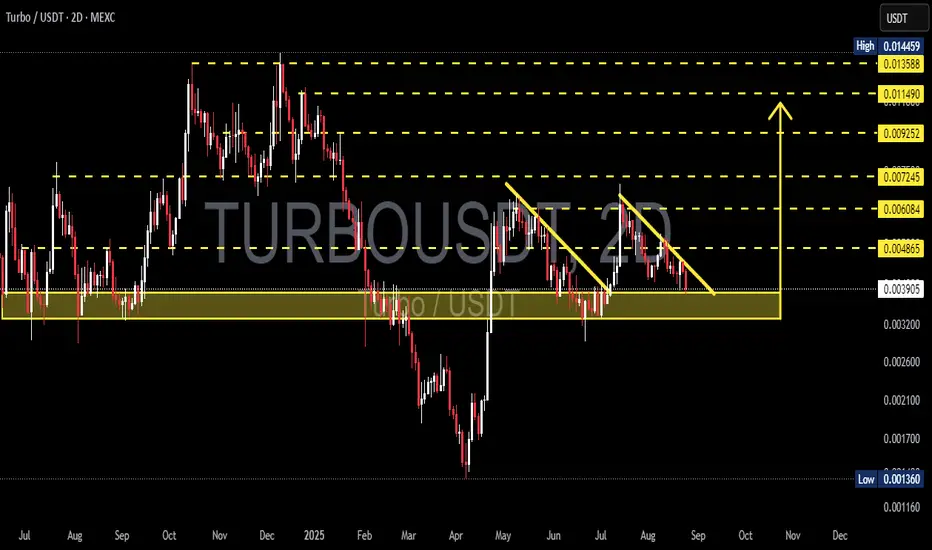
Currently, TURBO/USDT is trading at a very critical level. The chart shows price consistently being pressed down by the descending trendline (yellow), forming a Falling Wedge pattern—a structure that often signals a bullish reversal once broken to the upside.
At the same time, price is holding right above the historical demand zone 0.0033–0.0040 (yellow box), which has acted as strong accumulation and defended multiple downside attempts in the past. In other words, this zone is the last stand for the bulls to maintain the structure.
---
🔹 Pattern & Key Levels
Falling Wedge:
Sellers are losing momentum as volatility compresses. Statistically, this pattern tends to break upward, especially when supported by strong demand zones.
Demand Zone 0.0033–0.0040:
Strong support, repeatedly tested, still holding as the main bullish defense line.
Major Resistances & Targets:
0.004865 → 0.006084 → 0.007245 → 0.009252 → 0.011490 → 0.013588 (close to High 0.014459).
Supports if Broken:
0.0030 → 0.0026 → 0.0021 → 0.0017 → 0.001360 (historical Low).
---
🟢 Bullish Scenario
1. Trigger: Breakout above the descending trendline with a 2D close > 0.0041 confirms wedge breakout.
2. Healthy Retest: Holding 0.0040–0.0041 as new support after breakout strengthens the bullish case.
3. Targets (scale-out strategy):
Minor: 0.004865 → 0.006084
Mid: 0.007245 → 0.009252
Major: 0.011490 → 0.013588
4. Invalidation: If price fails and closes back < 0.0039 after breakout (fakeout risk).
---
🔴 Bearish Scenario
1. Trigger: Breakdown with 2D close < 0.0033 confirms demand zone failure.
2. Downside Targets: 0.0030 → 0.0026 → 0.0021 → 0.0017 → 0.001360 (historical Low).
3. Invalidation: Bearish outlook invalidated if price reclaims and holds > 0.0041.
---
📌 Conclusion & Strategy
The chart highlights a critical battle between bulls and bears at a strong historical demand zone.
Bullish case: More attractive due to the Falling Wedge + solid support, but requires a confirmed breakout to validate.
Bearish case: Activated only if demand breaks down, opening doors for deeper continuation to historical lows.
Risk management is essential: use stops below demand (0.0033) if long, and scale out profits gradually at resistance levels.
#TURBO #TURBOUSDT #CryptoTA #TechnicalAnalysis #PriceAction #SupportResistance #FallingWedge #Breakout #Altcoins #RiskManagement #CryptoTrading
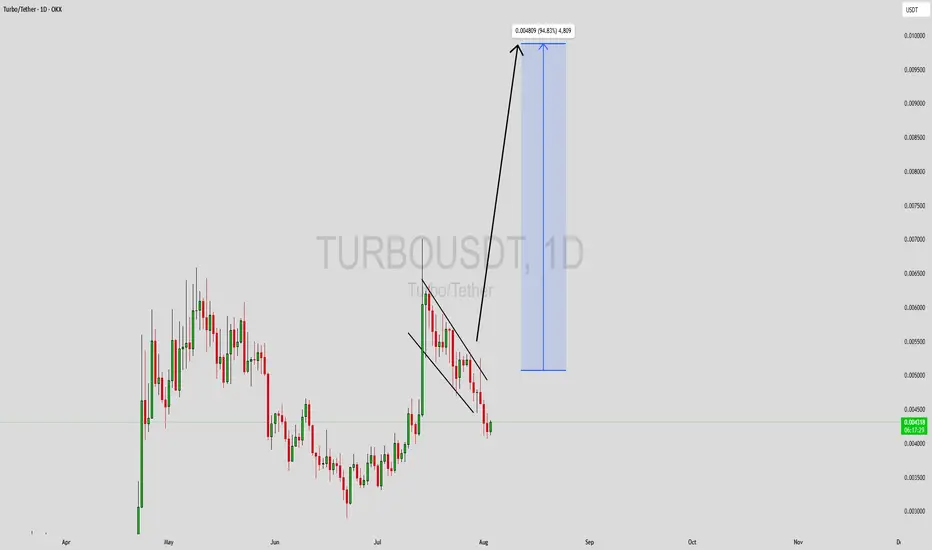
TURBOUSDT Forming Bullish PennantTURBOUSDT is currently exhibiting a bullish pennant pattern on the charts—a continuation setup that often leads to strong upward movement after a period of consolidation. This pattern typically forms after a sharp upward move, followed by a tightening range that resembles a pennant or small symmetrical triangle. The breakout from this structure is generally explosive, especially when backed by strong volume. TURBOUSDT has seen just that—an increase in trading volume that aligns with growing investor confidence.
The technical structure suggests that the recent consolidation phase is nearing its end, and a breakout to the upside could potentially yield a move of 80% to 90% or more. Bullish pennants are powerful indicators of renewed buying interest, and with price coiling near resistance, the odds of a breakout are increasing. Traders are watching this setup closely for confirmation, as a successful breakout could attract further momentum and trigger a new bullish trend leg.
Beyond the technicals, TURBO’s growing presence in the meme and altcoin sectors has captured investor attention. The project has been gaining traction due to its unique branding, active community engagement, and listings on major exchanges. These fundamental strengths further reinforce the bullish outlook from a technical standpoint.
If the breakout confirms with strong volume, this could be one of the top short-term opportunities in the current market. Keep a close eye on the price action in the coming sessions as the pattern nears its apex—TURBOUSDT could soon enter a high-velocity rally phase.
✅ Show your support by hitting the like button and
✅ Leaving a comment below! (What is You opinion about this Coin)
Your feedback and engagement keep me inspired to share more insightful market analysis with you!
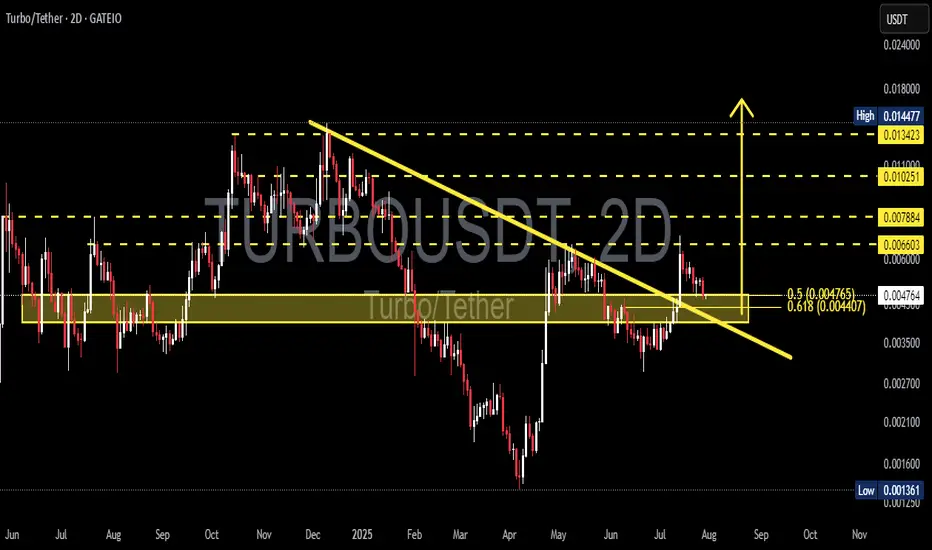
TURBO/USDT: Critical Decision Point – Breakout or Bull Trap?🧩 Overview
TURBO/USDT is currently sitting at a decisive technical juncture. After a prolonged downtrend since its late 2024 peak, the price has recently shown signs of a momentum shift by breaking out from a major descending trendline. The key question now: Is this the beginning of a bullish reversal, or just a temporary fakeout?
---
📉 Pattern Breakdown
Descending Triangle Breakout (Confirmed)
This classical bearish continuation pattern had formed since November 2024 with consistent lower highs. The recent breakout to the upside suggests a shift in market sentiment.
Historical Accumulation Zone (Demand Zone)
The yellow horizontal box (around 0.0042 – 0.0047 USDT) has acted as a strong historical accumulation and reaction area.
Golden Pocket Retest (Fibonacci 0.5 – 0.618)
The price is currently retesting the golden pocket retracement zone, which often acts as a decision zone for institutional buyers and swing traders.
---
📈 Bullish Scenario (Breakout Confirmation)
If the price holds above the golden pocket zone and prints a higher low, we could see:
🎯 Next Bullish Targets:
0.00660 USDT – Minor resistance
0.00788 USDT – Psychological level
0.01025 USDT – Mid-range resistance
0.01342 USDT – Major key level before recent highs
0.01447 USDT – Local high and full breakout target
✅ Bullish Confirmation:
A strong 2D candle close above 0.0066 with rising volume would validate the bullish breakout and signal continuation.
---
📉 Bearish Scenario (Fakeout Risk)
If price fails to hold the 0.0044 – 0.0047 USDT range and breaks back down:
🔻 Bearish Targets:
0.0035 USDT – Previous local support
0.0025 USDT – Old consolidation zone
0.00136 USDT – All-time low (last defense level)
❗️Bearish Confirmation:
A breakdown below 0.0044 USDT with bearish volume would invalidate the breakout and open the door for deeper downside.
---
🧠 Additional Insights
The initial breakout had solid volume, but current price action is testing the breakout validity.
RSI or momentum indicators (not shown here) should be monitored for divergence or confluence with this setup.
---
📌 Conclusion
> TURBO/USDT is at a make-or-break moment. While the breakout from the descending triangle is a strong bullish signal, the retest of the golden pocket zone must hold to confirm the trend reversal. Failure to do so could turn this into a bull trap with deeper downside risk.
⏳ Eyes on this level — market is choosing a direction.
#TURBO #USDT #CryptoAnalysis #BreakoutOrFakeout #TechnicalAnalysis #DescendingTriangle #FibonacciGoldenPocket #BullishScenario #BearishScenario #AltcoinWatch #CryptoTrading
TURBO BEAR FLAG PATTERN - TIME TO SELLSeen here is MYX:TURBO breaking the support trendline and signal a downtrend. You may want to take profit here or pick a short position. For Turbo short,
Entry price: $0.005713
Stop loss: $0.006562
Take profit 1: 0.004845
Take profit 2: 0.003944
Take profit 3: $0.0031
Not a financial advice.
Please support this idea with a LIKE👍 if you find it useful🥳
Happy Trading💰🥳🤗

TURBOUSDT 1D AnalysisTURBO ~ 1D Analysis
#TURBO Buy gradually from here if you still have confidence in this coin with a short term target of at least 15%+ from here. Long term target $0.0145
Buy in fear, sell in greed.Hello dears
Due to the price growth, now in the pullback you can buy in support areas in steps and move with it to the specified targets, of course with capital management.
*Trade safely with us*

#TURBO/USDT Trade Setup, 22% Scalping Signal!TURBO is ready for another round!
Entry:- .004212 to .003955.004744
Targets:
.004434
.004833
.005010
Stop Loss:- .003874
Leverage: 3x to 5x
Just keep your SL intact.
dyor, nfa.
Please hit the like button if you like these charts.
thank you
#PEACE

#TURBO/USDT#TURBO
The price is moving in a descending channel on the 1-hour frame and is adhering to it well and is heading to break it strongly upwards and retest it
We have a bounce from the lower limit of the descending channel, this support is at a price of 0.003600
We have a downtrend on the RSI indicator that is about to be broken and retested, which supports the rise
We have a trend to stabilize above the Moving Average 100
Entry price 0.003623
First target 0.003758
Second target 0.003845
Third target 0.003950

TURBOUSDT 3DTURBO ~ 3D Analysis
#TURBO Two buy zones that you might be able to consider. Buy gradually with a minimum target of 20%++.

TURBOUSDT 1DTURBO ~ 1D
#TURBO So far it still maintains this support block,. Buy gradually on this support block,. Minimum target 15%++

TURBOUSDT 1DTURBO ~ 1D
#TURBO If you still have Conviction on the coin,. Buy gradually on this support block,. or buy after breaking through this resistance line. Target 20%++

TURBOUSDT: Fresh Deman Zone ResearchTURBOUSDT: Fresh Deman Zone Research 🔍
The price has lingered too long in intermediate zones, which I don't prefer. Instead of getting lost in such areas, I choose fresh demand zones for better opportunities. The blue box marks a fresh demand region.
When trading the blue box, I rely on tools such as CDV, liquidity heatmaps, volume profiles, and volume footprints, alongside market structure breaks on lower time frames for confirmation.
📌 Stay focused, and don't let intermediate price action mislead you. Remember, fresh zones often yield cleaner reactions.
Disclaimer: Manage your risk accordingly; markets remain volatile.
If you think this analysis helps you, please don't forget to boost and comment on this. These motivate me to share more insights with you!
I keep my charts clean and simple because I believe clarity leads to better decisions.
My approach is built on years of experience and a solid track record. I don’t claim to know it all, but I’m confident in my ability to spot high-probability setups.
If you would like to learn how to use the heatmap, cumulative volume delta and volume footprint techniques that I use below to determine very accurate demand regions, you can send me a private message. I help anyone who wants it completely free of charge.
My Previous Analysis (the list is long but I think it's kinda good : )
🎯 ZENUSDT.P: Patience & Profitability | %230 Reaction from the Sniper Entry
🐶 DOGEUSDT.P: Next Move
🎨 RENDERUSDT.P: Opportunity of the Month
💎 ETHUSDT.P: Where to Retrace
🟢 BNBUSDT.P: Potential Surge
📊 BTC Dominance: Reaction Zone
🌊 WAVESUSDT.P: Demand Zone Potential
🟣 UNIUSDT.P: Long-Term Trade
🔵 XRPUSDT.P: Entry Zones
🔗 LINKUSDT.P: Follow The River
📈 BTCUSDT.P: Two Key Demand Zones
🟩 POLUSDT: Bullish Momentum
🌟 PENDLEUSDT.P: Where Opportunity Meets Precision
🔥 BTCUSDT.P: Liquidation of Highly Leveraged Longs
🌊 SOLUSDT.P: SOL's Dip - Your Opportunity
🐸 1000PEPEUSDT.P: Prime Bounce Zone Unlocked
🚀 ETHUSDT.P: Set to Explode - Don't Miss This Game Changer
🤖 IQUSDT: Smart Plan
⚡️ PONDUSDT: A Trade Not Taken Is Better Than a Losing One
💼 STMXUSDT: 2 Buying Areas
🐢 TURBOUSDT: Buy Zones and Buyer Presence
🌍 ICPUSDT.P: Massive Upside Potential | Check the Trade Update For Seeing Results
🟠 IDEXUSDT: Spot Buy Area | %26 Profit if You Trade with MSB
📌 USUALUSDT: Buyers Are Active + %70 Profit in Total
🌟 FORTHUSDT: Sniper Entry +%26 Reaction
🐳 QKCUSDT: Sniper Entry +%57 Reaction
📊 BTC.D: Retest of Key Area Highly Likely
I stopped adding to the list because it's kinda tiring to add 5-10 charts in every move but you can check my profile and see that it goes on..

TURBO/USDT Analysis: Buy Zones and Buyer PresenceObjective:
Focus on two key buy zones where price action suggests potential for bullish reversals, supported by confirmed buyer interest.
Key Buy Zones
First Buy Zone: Below the Red Line
Description: An initial buy zone signaling early accumulation or aggressive buyer interest.
Strategy: Look for bullish confirmations such as wicks, strong volume spikes, or reversal candlestick patterns below the red line.
Second Buy Zone: The Orange Box
Description: A broader, stronger accumulation area expected to attract more significant buying activity.
Strategy: Monitor for consolidation or sharp upward movements, signaling buyer dominance.
Market Context
Confirmed Buyers: Buyer activity is evident in TURBO/USDT, increasing confidence in bullish potential within these zones.
Action Plan
Entries:
Initiate long positions gradually in both buy zones, focusing on price behavior near the lower boundaries.
Stop Loss:
Placed at 0.0083
Take Profit:
Target resistance levels or Fibonacci extension zones for a measured exit.
Note: Stay attentive to volume and market conditions for additional confirmation before executing trades.
I keep my charts clean and simple because I believe clarity leads to better decisions.
My approach is built on years of experience and a solid track record. I don’t claim to know it all, but I’m confident in my ability to spot high-probability setups.
My Previous Analysis
🐶 DOGEUSDT.P: Next Move
🎨 RENDERUSDT.P: Opportunity of the Month
💎 ETHUSDT.P: Where to Retrace
🟢 BNBUSDT.P: Potential Surge
📊 BTC Dominance: Reaction Zone
🌊 WAVESUSDT.P: Demand Zone Potential
🟣 UNIUSDT.P: Long-Term Trade
🔵 XRPUSDT.P: Entry Zones
🔗 LINKUSDT.P: Follow The River
📈 BTCUSDT.P: Two Key Demand Zones
🟩 POLUSDT: Bullish Momentum
🌟 PENDLEUSDT: Where Opportunity Meets Precision
🔥 BTCUSDT.P: Liquidation of Highly Leveraged Longs
🌊 SOLUSDT.P: SOL's Dip - Your Opportunity
🐸 1000PEPEUSDT.P: Prime Bounce Zone Unlocked
🚀 ETHUSDT.P: Set to Explode - Don't Miss This Game Changer
🤖 IQUSDT: Smart Plan
⚡️ PONDUSDT: A Trade Not Taken Is Better Than a Losing One
💼 STMXUSDT: 2 Buying Areas

TURBOUSDT 1DTURBO ~ 1D
#TURBO If you still have Conviction on this coin. Buy gradually within this support Block,. With a short term target of at least 15%++

TURBO - Bullish Chart - Breakout & ATHHello Traders
Today I share my opinion about the TURBO coin.
The chart looks very bullish and is preparing to breakout soon. Once this breaks out I think we will get a new all time high shortly after.
Support area: 0.007$ area
Resistance: 0.01$ area & 0.012$ area
If we breakout the triangle and flip the 0.01$ resistance I believe this will pump a lot. Another important thing is that this coin is still not listed on coinbase so this would be a potential reason for a massive price increase.

#TURBO Primed for a 200%+ Rally! RR 1:18MYX:TURBO looks primed for action! It's bouncing off the support level, and with a stop loss at $0.6223, this trade has strong potential.
Remember, When TURBO moves, it moves fast, probably triple-digit gains in just a few daily candles are not uncommon.
Don’t miss out if this fits your strategy. I am holding!
dyor, nfa.
Do hit that like button if you want me to post more.
Thank you
#PEACE

#TURBO/USDT#TURBO
The price is moving in a descending channel on the 1-hour frame and sticking to it well
We have a bounce from the lower limit of the descending channel, this support is at 0.007070
We have an upward trend, the RSI indicator is about to break, which supports the rise
We have a trend to stabilize above the moving average 100
Entry price 0.007540
First target 0.008144
Second target 0.008680
Third target 0.009430

TURBO is Set to Run Hard Soon!TURBO is Set to Run Hard Soon! 🚀
The bi-weekly chart is screaming a buy, and it’s currently sitting above the most recent order block. This one has massive upside potential, currently at a $400M market cap. We could see a solid 5x from current prices, which is very promising! There’s even a 45x target, but that feels a bit out of reach—though it’s definitely ambitious!
The meme cycle is firing up strongly, and we can’t let this opportunity slip by. We need to capitalize now, as the narrative and momentum are validating our entries.
Let’s get ready! 💪

TURBOUSDT: Ready for a Breakout After Healthy Retracement!!TURBOUSDT has retraced to a previous support level following a failed pennant pattern breakout. However, the recent price action shows a strong attempt to break out again, supported by increasing volume. If TURBO successfully breaks above the pennant, we can expect a significant upward movement. Keep an eye on key levels for entry and potential targets as momentum builds. This could be the opportunity traders have been waiting for!
TURBOUSDT Currently trading at $0.0055
Buy level: Above $0.0055
Stop loss: Below $0.0044
TP1: $0.0071
TP2: $0.0085
TP3: $0.01
TP4: $0.015
TP5: $0.02
Max Leverage 3x
Follow Our Tradingview Account for More Technical Analysis Updates, | Like, Share and Comment Your thoughts
