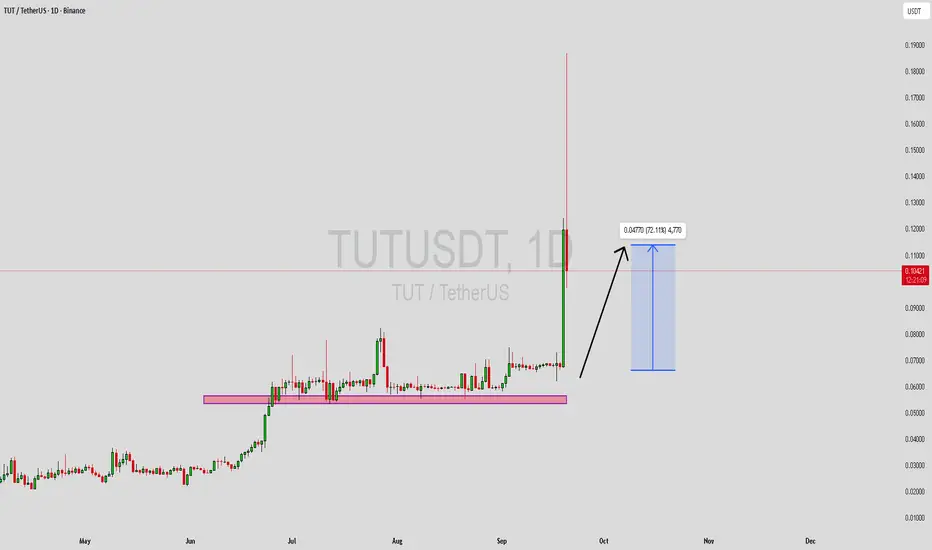
TUTUSDT Forming Bullish MomentumTUTUSDT is showing strong bullish momentum on the charts, supported by consistent volume that indicates growing interest from traders and investors. The current structure reflects a bullish momentum pattern, which often leads to significant upward price continuation. With the market aligning toward positive sentiment, the pair is gaining attention as a potential breakout candidate with room for further growth.
If this bullish setup plays out, TUTUSDT could be on track to deliver gains in the range of 60% to 70%+. Such momentum-driven moves are typically fueled by sustained demand and accumulation, suggesting that investors are positioning themselves early ahead of a possible rally. The volume profile also supports this narrative, showing that the market activity behind the price movement is healthy and reliable.
Market watchers are keeping a close eye on this setup as momentum-driven breakouts tend to accelerate quickly once resistance levels are broken. With investors showing confidence and taking interest in this project, the probability of a strong upside continuation looks favorable. Short to mid-term traders may find this a compelling opportunity as the technical indicators continue to align.
In summary, TUTUSDT is building momentum within a bullish structure that could soon propel it toward higher price levels. The combination of healthy volume, strong investor sentiment, and technical confirmation points toward the potential for a powerful upward move.
✅ Show your support by hitting the like button and
✅ Leaving a comment below! (What is You opinion about this Coin)
Your feedback and engagement keep me inspired to share more insightful market analysis with you!
TUT
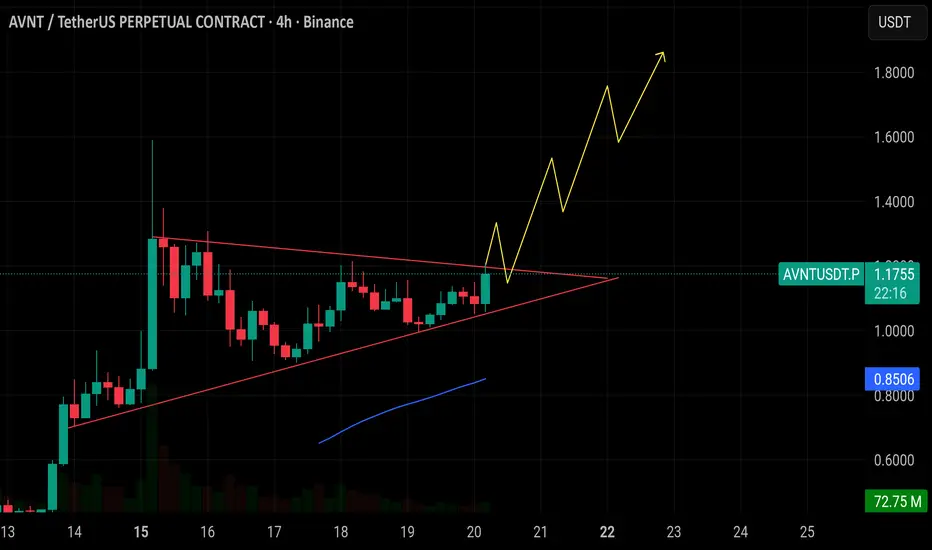
$AVNT is breaking out of a tightening wedge. If momentum holds NYSE:AVNT is breaking out of a tightening wedge. If momentum holds above 1.17, the next leg higher could target 1.40–1.80.
Support remains strong at 0.85, making this a key level to watch.
Bullish continuation in play. 🚀
TUTUSDT Forming Bullish MomentumTUTUSDT is showing strong bullish momentum on the charts, supported by consistent volume that indicates growing interest from traders and investors. The current structure reflects a bullish momentum pattern, which often leads to significant upward price continuation. With the market aligning toward positive sentiment, the pair is gaining attention as a potential breakout candidate with room for further growth.
If this bullish setup plays out, TUTUSDT could be on track to deliver gains in the range of 60% to 70%+. Such momentum-driven moves are typically fueled by sustained demand and accumulation, suggesting that investors are positioning themselves early ahead of a possible rally. The volume profile also supports this narrative, showing that the market activity behind the price movement is healthy and reliable.
Market watchers are keeping a close eye on this setup as momentum-driven breakouts tend to accelerate quickly once resistance levels are broken. With investors showing confidence and taking interest in this project, the probability of a strong upside continuation looks favorable. Short to mid-term traders may find this a compelling opportunity as the technical indicators continue to align.
In summary, TUTUSDT is building momentum within a bullish structure that could soon propel it toward higher price levels. The combination of healthy volume, strong investor sentiment, and technical confirmation points toward the potential for a powerful upward move.
✅ Show your support by hitting the like button and
✅ Leaving a comment below! (What is You opinion about this Coin)
Your feedback and engagement keep me inspired to share more insightful market analysis with you!

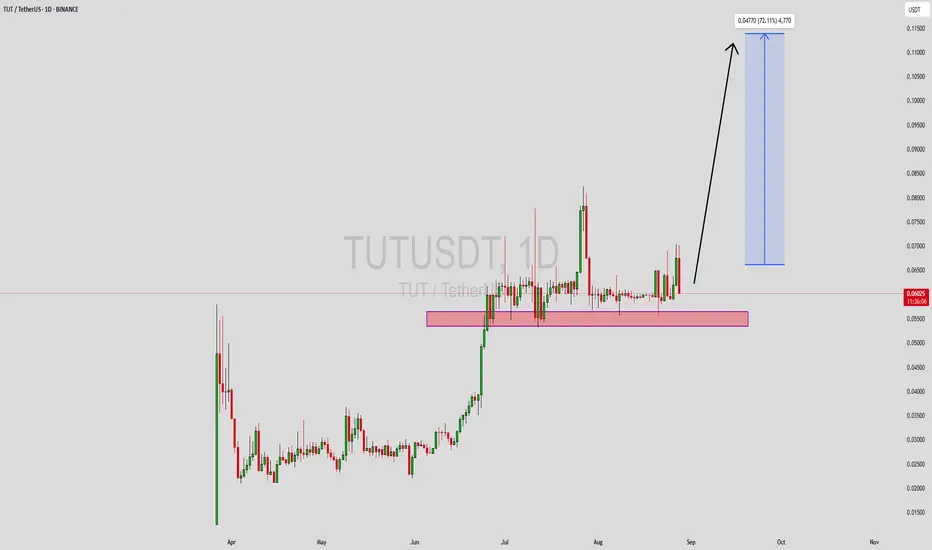
TUTUSDT Forming Bullish ContinuationTUTUSDT is currently showing a strong bullish Continuation pattern, signaling the potential for a major upward continuation in price action. The recent structure highlights consistent higher lows and stronger pushes to the upside, reflecting solid demand from buyers. The market has been supported by good trading volume, which adds strength to the current bullish outlook. This setup is often a precursor to explosive moves, especially when investor sentiment is aligned with technical signals.
If the momentum continues, TUTUSDT could potentially deliver gains in the range of 60% to 70%+. This type of pattern typically attracts breakout traders and mid-term investors who are looking for significant returns. As the price consolidates with bullish bias, any decisive breakout could act as a catalyst for rapid price acceleration.
Investors are already showing interest in this project, which further supports the case for continued upside. With both technical momentum and investor confidence building up, TUTUSDT could be positioned for strong growth in the coming sessions. Traders should keep a close watch on volume spikes and key resistance levels as potential signals for entry and continuation.
✅ Show your support by hitting the like button and
✅ Leaving a comment below! (What is You opinion about this Coin)
Your feedback and engagement keep me inspired to share more insightful market analysis with you!
Altcoins Market Bullish Continuation, Supporting SignalsTUTUSDT (Tutorial) has been leading the altcoins market. This pair tends to move ahead of the rest of the altcoins.
Here I am seeing a breakout from a sideways trading range, something similar to May.
Let's say TUTUSDT starts to move forward and this is day one. Why now? Because the market is ready. It starts to move forward and prints a bullish wave similar to June, we know the rest of the market will follow.
The fact that this chart shows perfect sideways action followed by bullish breakouts means that the people behind it are in the know. They know about the 2025 bull market, they know about the altcoins and they aren't about to sell when everything is set to grow.
So there you have it. This signal supports an altcoins market bullish continuation, what I've been saying in the past few days. It is still early, but the retrace already reached its end.
We are going up.
Namaste.
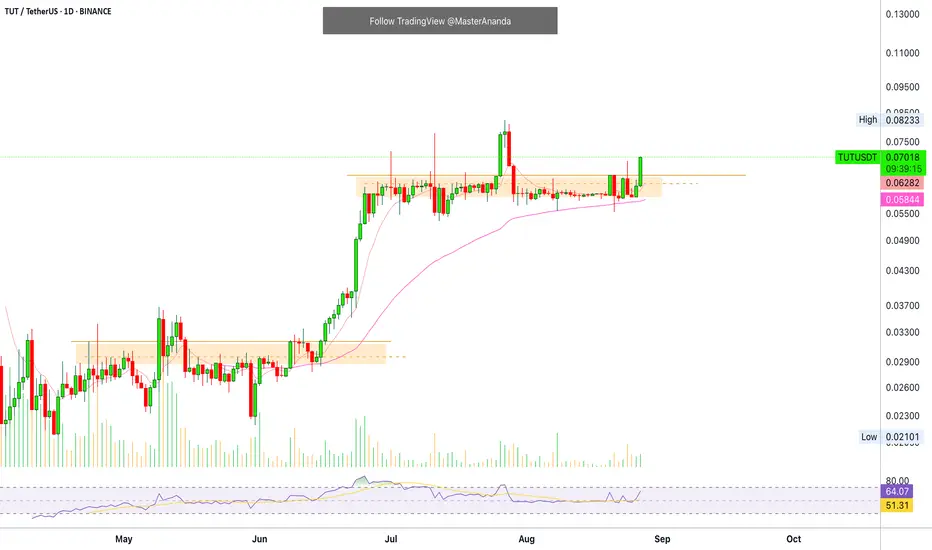
Tutorial Bullish Zone & Map (84% Easy Target Short-Term)Today TUTUSDT (Tutorial) has a combination of bullish signals.
It is moving above three strong support levels that were formally resistance. The red zone has been flipped, resistance turned support. The green and blue zones are yet a work in process. The action is happening above but the confirmation only comes ones the daily candle (session) closes above. That is, if today closes above 0.04387, this final resistance level has been flipped support.
Above 0.5 Fib. extension or 0.03951 is the bullish zone. TUTUSDT is now strongly bullish.
Today we have a full green candle and this is great, with rising volume. The highest volume since 1-June with room of course for it to go higher. We can easily see higher prices in the coming weeks and months.
Notice that this is a young chart, but if we couple marketwide action with short-term action, we can predict the next move. This is using the assumption that the market is one; what one does, the rest follows.
It is tricky but with practice you can predict how the market will move as well.
Thanks a lot for your continued support.
The next target stands at 0.08086. That's the main target short-term. An easy target I should say. Potential sits around 84% right now.
Namaste.

TUT Analysis (2H)From the point marked as "start" on the chart, the TUT correction has begun.
It appears to be an ABC correction, and we are currently in wave B of this ABC.
Wave B seems to be a complex correction, possibly a triangle or a diametric, and we are currently in wave c of B.
Wave c of B itself appears to be forming a symmetrical pattern.
It is expected to move toward the red box while maintaining the green zone.
The targets are indicated on the chart.
A daily candle closing below the invalidation level would invalidate this analysis.
For risk management, please don't forget stop loss and capital management
Comment if you have any questions
Thank You

LIMIT ORDER - TUT/USDTLIMIT ORDER - $TUT/USDT
Direction: #Long 🟢
Entry Price: 0.02494
Stop Loss: 0.020896
Target 1: 0.028031
Target 2: 0.031122
Target 3: 0.034213
Target 4: 0.037304
Target 5: 0.040395

TUT ANALYSIS (1H)It seems that wave A has completed, and this token has entered wave B, which is bearish. The wave B structure appears to be symmetrical.
In the green zone, the price may sweep the liquidity pool and bounce upward.
Targets are marked on the chart. A 4-hour candle closing below the invalidation level will invalidate this analysis.
invalidation level: 0.015680$
For risk management, please don't forget stop loss and capital management
When we reach the first target, save some profit and then change the stop to entry
Comment if you have any questions
Thank You

$TUT Token Set for 100% Leap Amidst Symmetrical Triangle PatternTutorial Token ($TUT) an AI-powered educational tool designed to help people learn about blockchain, cryptocurrency, and specifically the BNB chain ecosystem is set for a 100% surge amidst a bullish symmetrical triangle pattern depicted on the chart.
The first product "Tutorial Agent" is a smart tutor that uses artificial intelligence to break down complex topics—like setting up a crypto wallet, trading on decentralized exchanges (DEXs), or even writing smart contracts—into bite-sized, easy-to-understand lessons. The $Tut token is used to reward users, unlock features, and govern the platform.
With the Token's RSI at 51 this gives $TUT more room to capitalize on the lack of buying pressure to pick momentum up and spark a bullish renaissance. A breakout above the ceiling of the symmetrical triangle will be the catalyst $TUT need for a turnaround.
Tutorial Price Live Data
The live Tutorial price today is $0.023490 USD with a 24-hour trading volume of $40,688,559 USD. Tutorial is down 19.19% in the last 24 hours, with a live market cap of $22,315,621 USD. It has a circulating supply of 949,999,986 TUT coins and a max. supply of 1,000,000,000 TUT coins.

When should you not buy into support?(only 5% of traders know)1-lower highs into support
-sellers are in control
2-higher timeframe in a down trend
3-unfavorable risk to reward ratio
4-support tested multiple times
if you are interested any crypto that you want analyze with me and any questions please do not hesitate and comment below the chart!
if u like it press like-comment and folow me.thx

Why Most Traders Lose Money #Scalping The Market in #crypto1-caught by news
2-don’t have what it takes
3-cant read price action
4-wrong expectations
5-get killed by commissions
if you are interested any crypto that you want analyze with me and any questions please do not hesitate and comment below the chart!
if u like it press like-comment and folow me.thx
