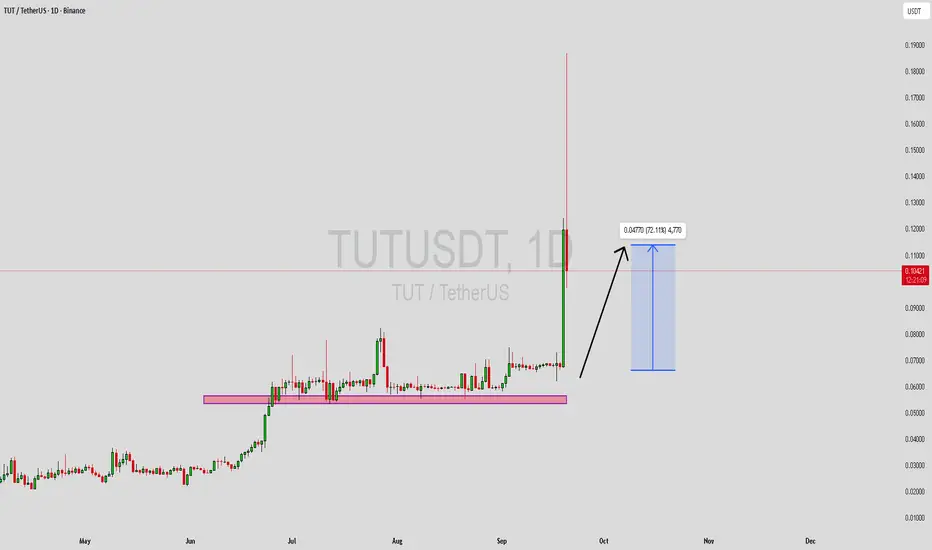
TUTUSDT Forming Bullish MomentumTUTUSDT is showing strong bullish momentum on the charts, supported by consistent volume that indicates growing interest from traders and investors. The current structure reflects a bullish momentum pattern, which often leads to significant upward price continuation. With the market aligning toward positive sentiment, the pair is gaining attention as a potential breakout candidate with room for further growth.
If this bullish setup plays out, TUTUSDT could be on track to deliver gains in the range of 60% to 70%+. Such momentum-driven moves are typically fueled by sustained demand and accumulation, suggesting that investors are positioning themselves early ahead of a possible rally. The volume profile also supports this narrative, showing that the market activity behind the price movement is healthy and reliable.
Market watchers are keeping a close eye on this setup as momentum-driven breakouts tend to accelerate quickly once resistance levels are broken. With investors showing confidence and taking interest in this project, the probability of a strong upside continuation looks favorable. Short to mid-term traders may find this a compelling opportunity as the technical indicators continue to align.
In summary, TUTUSDT is building momentum within a bullish structure that could soon propel it toward higher price levels. The combination of healthy volume, strong investor sentiment, and technical confirmation points toward the potential for a powerful upward move.
✅ Show your support by hitting the like button and
✅ Leaving a comment below! (What is You opinion about this Coin)
Your feedback and engagement keep me inspired to share more insightful market analysis with you!
Tutbtc
TUTUSDT Forming Bullish MomentumTUTUSDT is showing strong bullish momentum on the charts, supported by consistent volume that indicates growing interest from traders and investors. The current structure reflects a bullish momentum pattern, which often leads to significant upward price continuation. With the market aligning toward positive sentiment, the pair is gaining attention as a potential breakout candidate with room for further growth.
If this bullish setup plays out, TUTUSDT could be on track to deliver gains in the range of 60% to 70%+. Such momentum-driven moves are typically fueled by sustained demand and accumulation, suggesting that investors are positioning themselves early ahead of a possible rally. The volume profile also supports this narrative, showing that the market activity behind the price movement is healthy and reliable.
Market watchers are keeping a close eye on this setup as momentum-driven breakouts tend to accelerate quickly once resistance levels are broken. With investors showing confidence and taking interest in this project, the probability of a strong upside continuation looks favorable. Short to mid-term traders may find this a compelling opportunity as the technical indicators continue to align.
In summary, TUTUSDT is building momentum within a bullish structure that could soon propel it toward higher price levels. The combination of healthy volume, strong investor sentiment, and technical confirmation points toward the potential for a powerful upward move.
✅ Show your support by hitting the like button and
✅ Leaving a comment below! (What is You opinion about this Coin)
Your feedback and engagement keep me inspired to share more insightful market analysis with you!

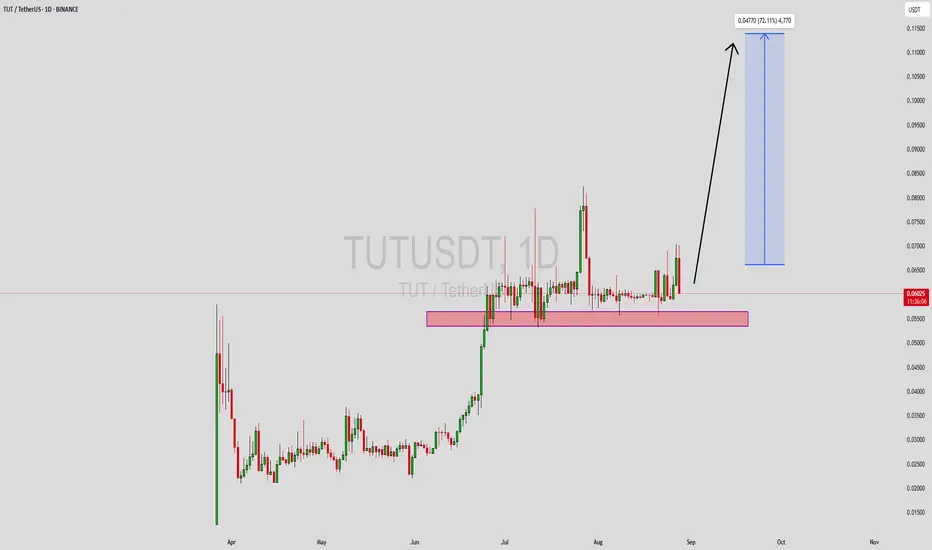
TUTUSDT Forming Bullish ContinuationTUTUSDT is currently showing a strong bullish Continuation pattern, signaling the potential for a major upward continuation in price action. The recent structure highlights consistent higher lows and stronger pushes to the upside, reflecting solid demand from buyers. The market has been supported by good trading volume, which adds strength to the current bullish outlook. This setup is often a precursor to explosive moves, especially when investor sentiment is aligned with technical signals.
If the momentum continues, TUTUSDT could potentially deliver gains in the range of 60% to 70%+. This type of pattern typically attracts breakout traders and mid-term investors who are looking for significant returns. As the price consolidates with bullish bias, any decisive breakout could act as a catalyst for rapid price acceleration.
Investors are already showing interest in this project, which further supports the case for continued upside. With both technical momentum and investor confidence building up, TUTUSDT could be positioned for strong growth in the coming sessions. Traders should keep a close watch on volume spikes and key resistance levels as potential signals for entry and continuation.
✅ Show your support by hitting the like button and
✅ Leaving a comment below! (What is You opinion about this Coin)
Your feedback and engagement keep me inspired to share more insightful market analysis with you!
TUTUSDT Forming Bullish BreakoutTUTUSDT is currently showing a bullish breakout from a falling wedge pattern on the daily chart—a highly reliable reversal setup often signaling the end of a downtrend and the beginning of an upward move. This breakout is accompanied by a healthy increase in volume, adding further confirmation to the move. Falling wedges are generally considered powerful patterns, especially when followed by strong bullish candles as seen here. This setup is attracting both technical traders and market watchers who are closely monitoring the next leg up.
The potential for a 40% to 50% gain is clearly visible on the chart, with projection targets well-defined and aligned with recent price action. The momentum is building, and TUTUSDT seems to be gearing up for a strong continuation rally. A sustained move above the wedge resistance and current local highs could pave the way for a retest of key resistance zones from previous price spikes.
This breakout comes at a time when broader market sentiment is slowly shifting toward optimism. As the altcoin space regains traction, tokens with solid technical setups like TUTUSDT become prime candidates for short- to mid-term investment. Additionally, the relatively low market cap and increasing investor interest in this project add further fuel to its upside potential.
For traders seeking early-stage breakouts with strong technical structure and positive sentiment, TUTUSDT offers an attractive opportunity. Keep an eye on volume continuity and market-wide conditions as confirmation for a full rally toward the upper targets mentioned in this setup.
✅ Show your support by hitting the like button and
✅ Leaving a comment below! (What is You opinion about this Coin)
Your feedback and engagement keep me inspired to share more insightful market analysis with you!

TUT Analysis (2H)From the point marked as "start" on the chart, the TUT correction has begun.
It appears to be an ABC correction, and we are currently in wave B of this ABC.
Wave B seems to be a complex correction, possibly a triangle or a diametric, and we are currently in wave c of B.
Wave c of B itself appears to be forming a symmetrical pattern.
It is expected to move toward the red box while maintaining the green zone.
The targets are indicated on the chart.
A daily candle closing below the invalidation level would invalidate this analysis.
For risk management, please don't forget stop loss and capital management
Comment if you have any questions
Thank You

TUT ANALYSIS (1H)It seems that wave A has completed, and this token has entered wave B, which is bearish. The wave B structure appears to be symmetrical.
In the green zone, the price may sweep the liquidity pool and bounce upward.
Targets are marked on the chart. A 4-hour candle closing below the invalidation level will invalidate this analysis.
invalidation level: 0.015680$
For risk management, please don't forget stop loss and capital management
When we reach the first target, save some profit and then change the stop to entry
Comment if you have any questions
Thank You
