#TWT/USDT Ready to go higher#TWT
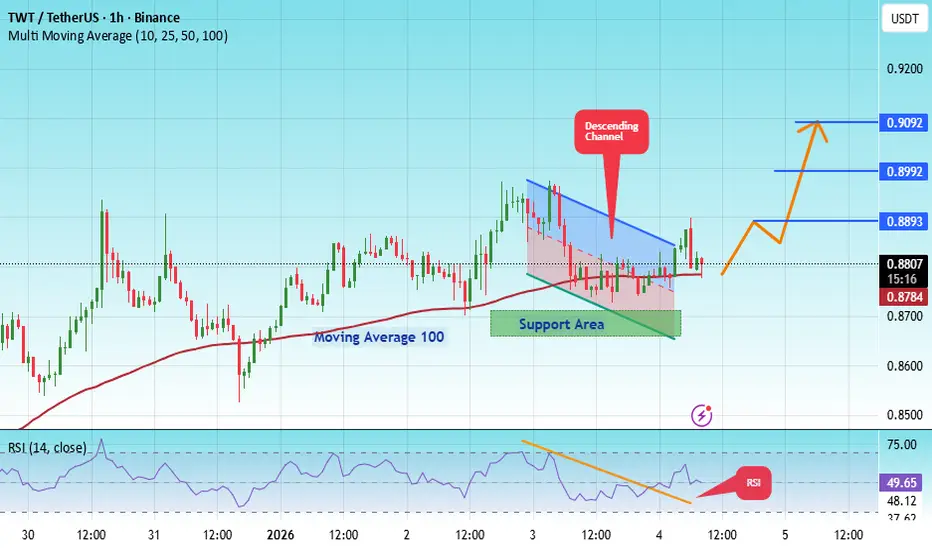
The price is moving in a descending channel on the 1-hour timeframe. It has reached the lower boundary and is heading towards breaking above it, with a retest of the upper boundary expected.
We have a downtrend on the RSI indicator, which has reached near the lower boundary, and an upward rebound is expected.
There is a key support zone in green at 0.8680. The price has bounced from this level multiple times and is expected to bounce again.
We have a trend towards consolidation above the 100-period moving average, as we are moving close to it, which supports the upward movement.
Entry price: 0.8807
First target: 0.8893
Second target: 0.8992
Third target: 0.9092
Stop loss: Below the support zone in green.
Don't forget a simple thing: capital management.
For inquiries, please leave a comment.
Thank you.
TWTUSD
TWT Analysis (4H)The price has made deep drops, and it appears that market makers have collected sufficient liquidity to change the trend.
After the drops, the price ranged at the bottom for a period, which seems to have been sufficient as an accumulation phase for an upward move on the hourly timeframe. Market makers also appear to have filled their orders.
The mid-term bearish trendline has been broken. The bearish C wave appears to be a diametric and has already ended. A proper pullback to the broken trendline has not yet occurred. A pullback is expected soon, after which the price is expected to enter the C wave.
We have marked two entry points on the chart where positions should be entered using a DCA approach. Targets have been specified on the chart.
A daily candle close below the invalidation level will invalidate this analysis.
Trading is not hard or complicated if you have a professional coach.
If you have a coin or altcoin you want analyzed, first hit the like button and then comment its name so I can review it for you.
This is not a trade setup, as it has no precise stop-loss, stop, or target. I do not publish my trade setups here.

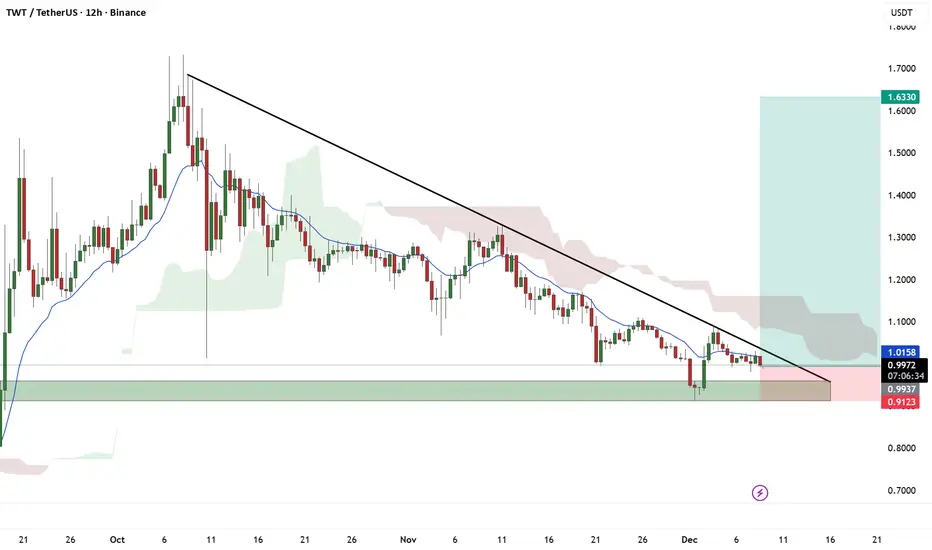
$TWT/USDT ANALYSISTWT/USDT on the 12-hour chart is still moving in a clear downtrend because price is trading below the descending trendline and also below the EMA, showing sellers are still controlling the market. Price is sitting inside a strong support demand zone around 0.95–1.00, and this zone has reacted before which means buyers are trying to defend it, but until the price breaks and closes above the trendline and 1.02–1.03 area with strength, upside continuation is not confirmed. If price keeps failing at the trendline it can stay weak and continue sideways or even push down toward the lower support area around 0.91, but if buyers manage to break out cleanly above resistance, then recovery toward higher levels becomes possible. Right now the structure is bearish but sitting on support where reaction can happen, so the next move depends on whether price breaks up from the trendline or gets rejected again.
TWTUSD - TrustWallet enters bull seasonHi.
TrustWallet is one of the biggest and most used crypto app out there.
Acquired by Binance few years ago got everything it needs to succeed.
This is not a trading advice.
Thanks
Gex

#TWT/USDT — Descending Triangle at Demand Zone!#TWT
The price is moving within a descending channel on the 1-hour frame, adhering well to it, and is heading for a strong breakout and retest.
We have a bearish trend on the RSI indicator that is about to be broken and retested, which supports the upward breakout.
There is a major support area in green at 1.21, representing a strong support point.
We are heading for consolidation above the 100 moving average.
Entry price: 1.25.
First target: 1.27.
Second target: 1.30.
Third target: 1.34.
Don't forget a simple matter: capital management.
When you reach the first target, save some money and then change your stop-loss order to an entry order.
For inquiries, please leave a comment.
Thank you.
Support and Resistance Area: 0.9563-1.0036
Hello, traders!
Follow us to get the latest information quickly.
Have a great day!
-------------------------------------
(TWTUSDT 1W Chart)
The key support and resistance area is 1.65-1.8839.
To break above this important support and resistance zone, we need to see if the price can maintain support near 1.0036 and rise above 1.4026.
-
(1D chart)
Since the HA-High indicator on the 1D chart was generated at 0.9563, it's crucial to see if the price can maintain above 0.9563-1.0036.
To achieve this, the key is whether the price can rise after finding support near 1.2224.
Therefore, if the price falls below 1.2224, support around 0.9563-1.0036 will be crucial.
------------------------------------
The basic trading strategy is to buy in the DOM(-60) ~ HA-Low range and sell in the HA-High ~ DOM(60) range.
However, if the price rises from the HA-High to DOM(60) range, it is likely to exhibit a step-like upward trend, while if it falls from the DOM(-60) to HA-Low range, it is likely to exhibit a step-like downward trend.
Therefore, the basic trading strategy should be a segmented trading strategy.
Buying when the HA-High to DOM(60) range shows support requires a short and quick response.
As mentioned earlier, the HA-High to DOM(60) range is considered a sell zone, or resistance zone.
Therefore, if possible, it's best to find a buying opportunity when the price declines and then rises.
1. The K indicator of the StochRSI indicator should be rising. If possible, it should not enter the overbought zone.
2. The On-By-Sign-Operative (OBV) indicator should be rising. If possible, it should remain above the High Line.
3. The TC (Trend Check) indicator should be rising. If possible, it should be above the 0 point.
When the three indicators listed above are met, the price is likely to continue its upward trend.
-
Thank you for reading to the end.
We wish you successful trading.
--------------------------------------------------

TWT/USDT — Long-Term Accumulation or Imminent Breakdown?📌 Overview
Trust Wallet Token (TWT) has been forming a major pattern on the weekly timeframe for over 3 years. The current price hovers around 0.81 USDT, sitting right inside the multi-year demand zone that has repeatedly acted as a key accumulation area since 2021.
This zone is more than just sideways price action — it’s a critical inflection point that could determine the medium-to-long-term trend.
---
📊 Market Structure & Key Pattern
Multi-Year Demand Zone (0.67 – 0.90 USDT): A golden area that has historically prevented further downside multiple times since 2021.
Series of Lower Highs (since 2022): Every rally has failed to break higher, showing sellers still dominate the mid-term structure.
Sideways Battle Zone: Buyers are defending hard, sellers are capping every move. This is a textbook accumulation vs. distribution phase.
---
🔑 Key Levels
Main Support: 0.67 – 0.90 USDT (demand zone).
Layered Resistances:
1.08 USDT → first critical resistance.
1.26 USDT → mid-level target.
1.60 USDT → strong structural resistance.
2.66 – 2.74 USDT → major supply zone / high target.
Downside supports if breakdown occurs: 0.55 → 0.30–0.40 USDT.
---
🚀 Bullish Scenario
1. Rebound from Demand: Strong weekly rejection (pin bar / bullish engulfing) inside the zone could trigger a rally toward 1.08 → 1.26 USDT.
2. Confirmed Breakout: A weekly close above 1.08 USDT with strong volume would be the first real reversal signal.
Step targets: 1.26 → 1.60 USDT.
Sustained breakout may unlock upside toward 2.66–2.74 USDT.
3. Market Narrative: Long-term buyers see this area as a “multi-year discount” accumulation zone. If BTC turns bullish, TWT could become one of the altcoins that follow explosively.
---
🩸 Bearish Scenario
1. Weekly Breakdown below 0.67: A decisive close would confirm the failure of demand.
Downside targets: 0.55 → 0.30–0.40 USDT.
2. False Pump: A rejection from 1.08–1.26 could trigger another sell-off back into support, increasing breakdown risk.
3. Market Narrative: If the global crypto market turns bearish, this demand zone may no longer hold.
---
📖 Pattern Interpretation (Deeper Look)
Accumulation or Distribution?
This yellow zone can only mean one of two things:
If buyers hold → it’s a multi-year accumulation base before the next bull leg.
If buyers fail → it’s a long-term distribution zone leading to deeper lows.
Key: Only a confirmed weekly close can separate a real move from a fake-out.
---
🎯 Potential Strategies
Conservative (Swing Traders): Enter after a confirmed breakout above 1.08. Targets 1.26–1.60.
Aggressive (Accumulation Play): Buy within 0.70–0.80 demand zone with tight stop below 0.65. First target 1.08–1.26.
Bearish Setup: Short after weekly close below 0.67. Targets 0.45–0.30.
⚠️ Risk management is essential: limit position risk to 1–2% of capital per trade.
---
📝 Conclusion
TWT is standing at the most decisive support zone since 2021. The market will soon reveal whether this is:
Bullish: a multi-year accumulation before the next expansion.
Bearish: a long-term distribution phase before deeper losses.
📌 Main Key: Wait for a confirmed weekly close with volume. Until then, the yellow box remains the battlefield of accumulation vs. distribution.
---
#TWT #TrustWalletToken #TWTUSDT #CryptoAnalysis #TechnicalAnalysis #PriceAction #Altcoin #SupportResistance #Accumulation #BreakoutOrBreakdown

$TWT/USDT Breakout Confirmed.SEED_DONKEYDAN_MARKET_CAP:TWT just broke a major downtrend and retested the breakout zone around $0.7555–$0.7898, holding above the 100 SMA.
If this support holds, we could see a 25% move toward $0.9528. Bullish structure, momentum building.
DYOR, NFA

TWTUSDT 1D AnalysisTWT ~ 1D Analysis
#TWT Successfully broke through this resistance line. Buy at this support block with a short term target of at least 10%+ from here.

TWTUSD - Bullish Phase TWT - Backed by Binance
TrustWallet App known and used.
400 Market Cap - 1B Fully Diluted
Good tokenomics.
Good Listings.
Thank you,
St.Gex

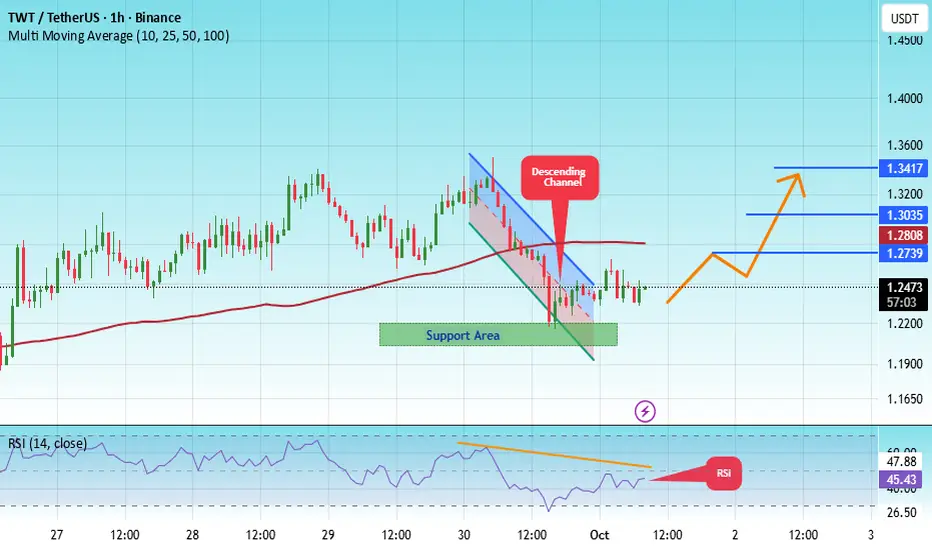
#TWT/USDT Ready to go higher#TWT
The price is moving in a descending channel on the 1-hour frame and sticking to it well
We have a bounce from the lower limit of the descending channel, this support is at 1.23
We have a downtrend on the RSI indicator that is about to break, which supports the rise
We have a trend to stabilize above the 100 moving average
Entry price 1.24
First target 1.268
Second target 1.288
Third target 1.31

TWTUSDT Analysis: Waiting for the Right EntryBuyers are active in TWTUSDT, but waiting for the blue boxes to form is the more logical approach for a solid entry.
Key Insights:
Active Buyers: The market shows buying pressure, but the blue box offers a more reliable demand zone for a better risk-reward.
Patience is Key: Waiting for the blue box aligns with a more controlled entry, especially in the current market conditions.
Confirmation Checklist:
When trading the blue box, I will confirm using:
Cumulative Delta Volume (CDV)
Liquidity Heatmap
Volume Profile
Volume Footprint
Upward Market Structure Breaks on Lower Time Frames
Learn Advanced Trading Techniques:
Want to dive deeper into CDV, liquidity heatmaps, or volume profiles? DM me for personalized guidance.
Final Words:
Stay patient, wait for the blue box, and trade with confidence!
If you think this analysis helps you, please don't forget to boost and comment on this. These motivate me to share more insights with you!
I keep my charts clean and simple because I believe clarity leads to better decisions.
My approach is built on years of experience and a solid track record. I don’t claim to know it all, but I’m confident in my ability to spot high-probability setups.
If you would like to learn how to use the heatmap, cumulative volume delta and volume footprint techniques that I use below to determine very accurate demand regions, you can send me a private message. I help anyone who wants it completely free of charge.
My Previous Analysis (the list is long but I think it's kinda good : )
🎯 ZENUSDT.P: Patience & Profitability | %230 Reaction from the Sniper Entry
🐶 DOGEUSDT.P: Next Move
🎨 RENDERUSDT.P: Opportunity of the Month
💎 ETHUSDT.P: Where to Retrace
🟢 BNBUSDT.P: Potential Surge
📊 BTC Dominance: Reaction Zone
🌊 WAVESUSDT.P: Demand Zone Potential
🟣 UNIUSDT.P: Long-Term Trade
🔵 XRPUSDT.P: Entry Zones
🔗 LINKUSDT.P: Follow The River
📈 BTCUSDT.P: Two Key Demand Zones
🟩 POLUSDT: Bullish Momentum
🌟 PENDLEUSDT.P: Where Opportunity Meets Precision
🔥 BTCUSDT.P: Liquidation of Highly Leveraged Longs
🌊 SOLUSDT.P: SOL's Dip - Your Opportunity
🐸 1000PEPEUSDT.P: Prime Bounce Zone Unlocked
🚀 ETHUSDT.P: Set to Explode - Don't Miss This Game Changer
🤖 IQUSDT: Smart Plan
⚡️ PONDUSDT: A Trade Not Taken Is Better Than a Losing One
💼 STMXUSDT: 2 Buying Areas
🐢 TURBOUSDT: Buy Zones and Buyer Presence
🌍 ICPUSDT.P: Massive Upside Potential | Check the Trade Update For Seeing Results
🟠 IDEXUSDT: Spot Buy Area | %26 Profit if You Trade with MSB
📌 USUALUSDT: Buyers Are Active + %70 Profit in Total
🌟 FORTHUSDT: Sniper Entry +%26 Reaction
🐳 QKCUSDT: Sniper Entry +%57 Reaction
📊 BTC.D: Retest of Key Area Highly Likely
I stopped adding to the list because it's kinda tiring to add 5-10 charts in every move but you can check my profile and see that it goes on..

TWTUSDT 1WTWT Update ~ 1W
#TWT Successfully retested this Support,. and for now it still maintains its bullish structure. If you still have Conviction on this coin,. Buy in stages from here. with a minimum target of 20%++

TWT will be next 10-100x bull run Breaking above red box no new low 🔅 stright forward 4-6x
Below always chance to complete $0.5 below 📍
Return to $5-8 it's 10x
Based on move we can decide will it beat 100x or settle with in 10x
U need to know project things 😉 it's always different direction in Crypto 🔮
Last bear run it completed bull run top 🔝
$50-200 possible i don't know if target reach fast 😹 i will update here 🙂

TWT (Trust Wallet Token): Falling Wedge BreakoutTrade setup : Price is in a Downtrend, however, it had a bullish breakout from Falling Wedge pattern, which could signal at least a temporary bullish trend reversal with upside potential to $1.00 to $1.10 resistance. Stop Loss at $0.80. This is a riskier trade setup because it’s a trend reversal not a trend continuation setup. It’s against the overall downtrend. Learn to trade breakouts in Lesson 7 and Risk Management in Lesson 9.
Patterns : Falling Wedge Usually results in a bullish breakout. When price breaks the upper trend line the price is expected to trend higher. Emerging patterns (before a breakout occurs) can be traded by swing traders between the convergence lines; however, most traders should wait for a completed pattern with a breakout and then place a BUY order. Learn to trade chart patterns in Lesson 8.
Trend : Short-term trend is Neutral, Medium-term trend is Strong Down and Long-term trend is Strong Down.
Momentum : Price is neither overbought nor oversold currently, based on RSI-14 levels (RSI > 30 and RSI < 70).
Support and Resistance : Nearest Support Zone is $0.70. Nearest Resistance Zone is $1.00, then $1.10.

TWT is very bearishBefore anything, pay attention to the time frame.
It seems to have completed a large diametric.
It now appears to be at the end of a bullish wave G.
We have two important targets on the chart. The first target is also a strong and supportive area.
Closing a daily candle above the invalidation level will violate the analysis.
For risk management, please don't forget stop loss and capital management
When we reach the first target, save some profit and then change the stop to entry
Comment if you have any questions
Thank You

TWT (Trust Wallet Token): Approaching SupportTrade setup : Price is in a downtrend. It got rejected at $1.40 and pulled back below 200-day moving average, which is a sign of downtrend. Swing Traders: pullback to $1.00 support could be as swing trade entry with +20% upside potential back to $1.20. This is a riskier trade setup because it’s against the overall downtrend. Trend Traders: wait for price to break back above 200-day moving average and $1.20 key level, which would signal resumption of Uptrend, with +15% upside potential back to $1.40.
Pattern : Price is Approaching Support , which is a level where it could pause or reverse its recent decline, at least temporarily. Support is often a level where price has bounced up in the past, or potentially prior Resistance level that was broken. (concept known as polarity). Once price breaks below support, it can move lower to the next support level. Learn to trade key levels in Lesson 7.
Trend : Short-term trend is Strong Down, Medium-term trend is Down and Long-term trend is Strong Down.
Momentum is Bullish but inflecting. MACD Line is still above MACD Signal Line but momentum may have peaked since MACD Histogram bars are declining, which suggests that momentum could be nearing a downswing. Price is neither overbought nor oversold currently, based on RSI-14 levels (RSI > 30 and RSI < 70).
Support and Resistance : Nearest Support Zone is $1.00, then $0.80. Nearest Resistance Zone is $1.20, then $1.40.

TWT/USDT GOING FOR HIGHER LEVELDepending on the last time frame volume TWT showing new interest in volume which could let TWT increase soon to higher levels
Between $1.08 and $1.15 is an interesting target level.
We will follow up and see if this coin can confirm the above targets.

TWTUSD 1WTWT ~ Updated
#TWT Make purchases gradually when the retest of this support line is successful.
Short term target of at least 20%+

TWTUSD 1WTWT ~ 1W
#TWT Make a purchase every time this support line is retested, Aim for at least 15%+

Potential GrowthIn the TWT chart, a triangular pattern has formed, with the upper resistance line being particularly significant. According to the current analysis, there is a high likelihood of breaking through this resistance. If this breakout occurs, it is anticipated that the price could potentially increase by around 15% from this range. It is recommended to closely monitor this movement to take advantage of emerging opportunities.

TWT We're at a local bottom!! +100% easyThis is one of the strongest and most promising projects out there, poised for significant growth in the very near future! We're at a local bottom, backed by a solid support zone. It's a buy zone, folks! Don't sell, buy more! 🚀💪

Flying Saucer and +300% Profit 🛸#TWT/USDT #Analysis
Description
---------------------------------------------------------------
+ TWT has developed a promising saucer pattern, signaling a potential breakout from the resistance level. This breakout will pump the price of TWT
+ I plan to enter a LONG trade following the breakout, with my entry point set just above the resistance level at around 1.4.
---------------------------------------------------------------
VectorAlgo Trade Details
------------------------------
Entry Price: Above 1.400
Stop Loss: 1.2352
------------------------------
Target 1: 1.4486
Target 2: 1.5273
Target 3: 1.6385
Target 4: 1.7298
Target 5: 1.8287
------------------------------
Timeframe: 1D
Capital: 1-2% of trading capital
Leverage: 5-10x
---------------------------------------------------------------
Enhance, Trade, Grow
---------------------------------------------------------------
Feel free to share your thoughts and insights.
Don't forget to like and follow us for more trading ideas and discussions.
Best Regards,
VectorAlgo
