#TWT/USDT Ready to go higher#TWT
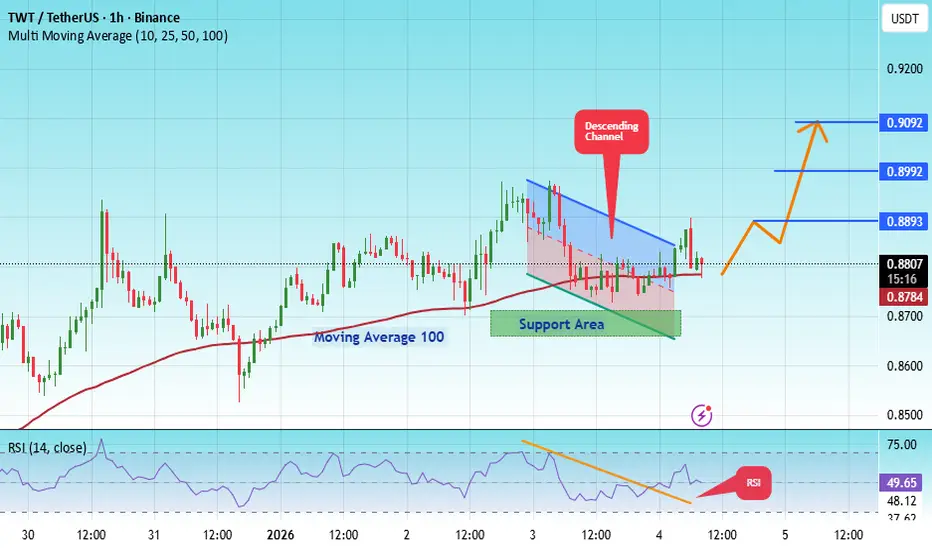
The price is moving in a descending channel on the 1-hour timeframe. It has reached the lower boundary and is heading towards breaking above it, with a retest of the upper boundary expected.
We have a downtrend on the RSI indicator, which has reached near the lower boundary, and an upward rebound is expected.
There is a key support zone in green at 0.8680. The price has bounced from this level multiple times and is expected to bounce again.
We have a trend towards consolidation above the 100-period moving average, as we are moving close to it, which supports the upward movement.
Entry price: 0.8807
First target: 0.8893
Second target: 0.8992
Third target: 0.9092
Stop loss: Below the support zone in green.
Don't forget a simple thing: capital management.
For inquiries, please leave a comment.
Thank you.
Twtusdtlong
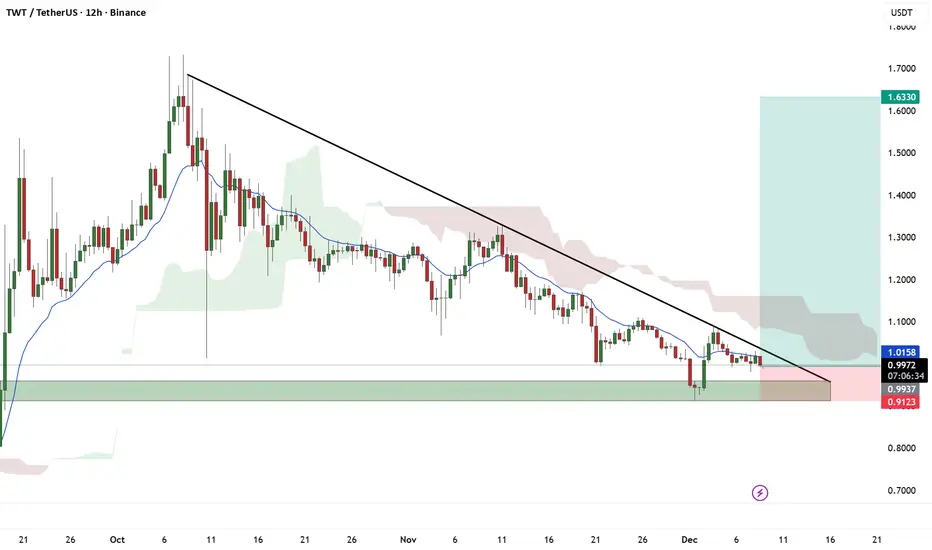
$TWT/USDT ANALYSISTWT/USDT on the 12-hour chart is still moving in a clear downtrend because price is trading below the descending trendline and also below the EMA, showing sellers are still controlling the market. Price is sitting inside a strong support demand zone around 0.95–1.00, and this zone has reacted before which means buyers are trying to defend it, but until the price breaks and closes above the trendline and 1.02–1.03 area with strength, upside continuation is not confirmed. If price keeps failing at the trendline it can stay weak and continue sideways or even push down toward the lower support area around 0.91, but if buyers manage to break out cleanly above resistance, then recovery toward higher levels becomes possible. Right now the structure is bearish but sitting on support where reaction can happen, so the next move depends on whether price breaks up from the trendline or gets rejected again.
#TWT/USDT — Descending Triangle at Demand Zone!#TWT
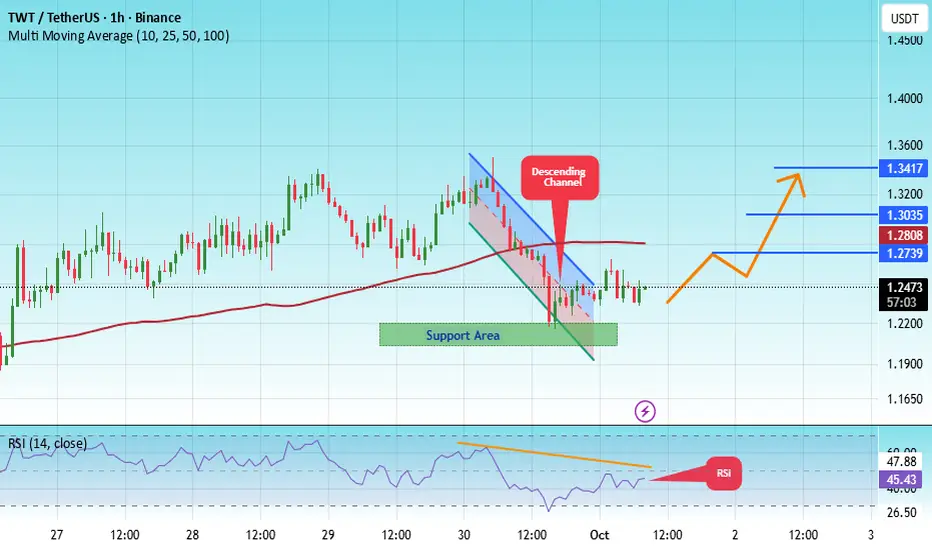
The price is moving within a descending channel on the 1-hour frame, adhering well to it, and is heading for a strong breakout and retest.
We have a bearish trend on the RSI indicator that is about to be broken and retested, which supports the upward breakout.
There is a major support area in green at 1.21, representing a strong support point.
We are heading for consolidation above the 100 moving average.
Entry price: 1.25.
First target: 1.27.
Second target: 1.30.
Third target: 1.34.
Don't forget a simple matter: capital management.
When you reach the first target, save some money and then change your stop-loss order to an entry order.
For inquiries, please leave a comment.
Thank you.
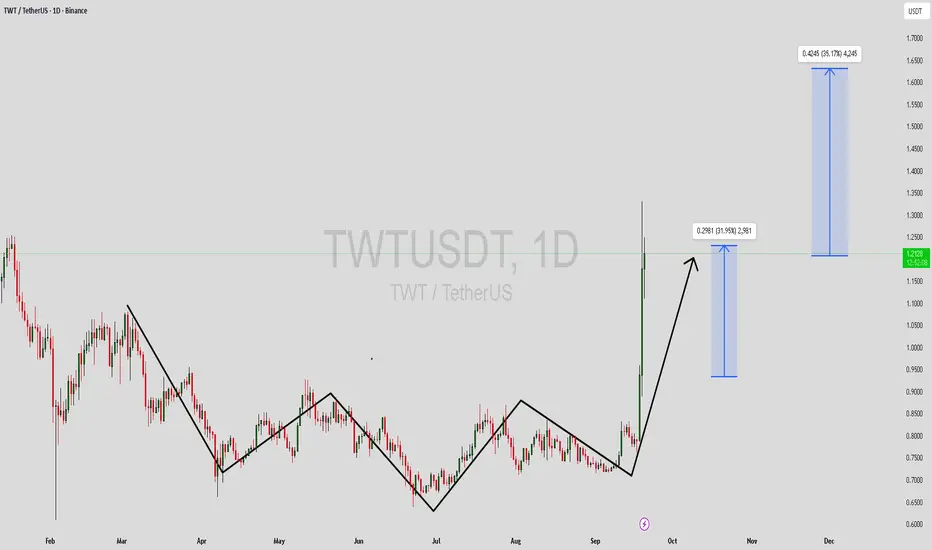
TWTUSDT Forming Powerful BreakoutTWTUSDT has recently shown a powerful breakout, backed by strong volume and investor confidence. The pair has been consolidating for a while, forming a clear accumulation zone before this sudden upward momentum. This breakout suggests the beginning of a new bullish phase, with potential for impressive gains if the momentum sustains.
Currently, the chart indicates a possible continuation pattern with projected targets pointing toward a 20% to 30%+ gain. Such wide potential reflects both the strength of the bullish move and the volatility that comes with high investor interest. If buyers continue to step in and market sentiment remains positive, TWT could easily test higher resistance zones and push toward new highs.
Investor activity is clearly rising, which often fuels liquidity and strengthens the sustainability of a trend. With technicals favoring upside momentum, this setup presents a strong opportunity for traders watching for breakout continuation patterns.
✅ Show your support by hitting the like button and
✅ Leaving a comment below! (What is You opinion about this Coin)
Your feedback and engagement keep me inspired to share more insightful market analysis with you!
TWT/USDT — Long-Term Accumulation or Imminent Breakdown?📌 Overview
Trust Wallet Token (TWT) has been forming a major pattern on the weekly timeframe for over 3 years. The current price hovers around 0.81 USDT, sitting right inside the multi-year demand zone that has repeatedly acted as a key accumulation area since 2021.
This zone is more than just sideways price action — it’s a critical inflection point that could determine the medium-to-long-term trend.
---
📊 Market Structure & Key Pattern
Multi-Year Demand Zone (0.67 – 0.90 USDT): A golden area that has historically prevented further downside multiple times since 2021.
Series of Lower Highs (since 2022): Every rally has failed to break higher, showing sellers still dominate the mid-term structure.
Sideways Battle Zone: Buyers are defending hard, sellers are capping every move. This is a textbook accumulation vs. distribution phase.
---
🔑 Key Levels
Main Support: 0.67 – 0.90 USDT (demand zone).
Layered Resistances:
1.08 USDT → first critical resistance.
1.26 USDT → mid-level target.
1.60 USDT → strong structural resistance.
2.66 – 2.74 USDT → major supply zone / high target.
Downside supports if breakdown occurs: 0.55 → 0.30–0.40 USDT.
---
🚀 Bullish Scenario
1. Rebound from Demand: Strong weekly rejection (pin bar / bullish engulfing) inside the zone could trigger a rally toward 1.08 → 1.26 USDT.
2. Confirmed Breakout: A weekly close above 1.08 USDT with strong volume would be the first real reversal signal.
Step targets: 1.26 → 1.60 USDT.
Sustained breakout may unlock upside toward 2.66–2.74 USDT.
3. Market Narrative: Long-term buyers see this area as a “multi-year discount” accumulation zone. If BTC turns bullish, TWT could become one of the altcoins that follow explosively.
---
🩸 Bearish Scenario
1. Weekly Breakdown below 0.67: A decisive close would confirm the failure of demand.
Downside targets: 0.55 → 0.30–0.40 USDT.
2. False Pump: A rejection from 1.08–1.26 could trigger another sell-off back into support, increasing breakdown risk.
3. Market Narrative: If the global crypto market turns bearish, this demand zone may no longer hold.
---
📖 Pattern Interpretation (Deeper Look)
Accumulation or Distribution?
This yellow zone can only mean one of two things:
If buyers hold → it’s a multi-year accumulation base before the next bull leg.
If buyers fail → it’s a long-term distribution zone leading to deeper lows.
Key: Only a confirmed weekly close can separate a real move from a fake-out.
---
🎯 Potential Strategies
Conservative (Swing Traders): Enter after a confirmed breakout above 1.08. Targets 1.26–1.60.
Aggressive (Accumulation Play): Buy within 0.70–0.80 demand zone with tight stop below 0.65. First target 1.08–1.26.
Bearish Setup: Short after weekly close below 0.67. Targets 0.45–0.30.
⚠️ Risk management is essential: limit position risk to 1–2% of capital per trade.
---
📝 Conclusion
TWT is standing at the most decisive support zone since 2021. The market will soon reveal whether this is:
Bullish: a multi-year accumulation before the next expansion.
Bearish: a long-term distribution phase before deeper losses.
📌 Main Key: Wait for a confirmed weekly close with volume. Until then, the yellow box remains the battlefield of accumulation vs. distribution.
---
#TWT #TrustWalletToken #TWTUSDT #CryptoAnalysis #TechnicalAnalysis #PriceAction #Altcoin #SupportResistance #Accumulation #BreakoutOrBreakdown

TWTUSDT 1D AnalysisTWT ~ 1D Analysis
#TWT Successfully broke through this resistance line. Buy at this support block with a short term target of at least 10%+ from here.

#TWT/USDT Ready to go higher#TWT
The price is moving in a descending channel on the 1-hour frame and sticking to it well
We have a bounce from the lower limit of the descending channel, this support is at 1.23
We have a downtrend on the RSI indicator that is about to break, which supports the rise
We have a trend to stabilize above the 100 moving average
Entry price 1.24
First target 1.268
Second target 1.288
Third target 1.31

TWTUSDT Analysis: Waiting for the Right EntryBuyers are active in TWTUSDT, but waiting for the blue boxes to form is the more logical approach for a solid entry.
Key Insights:
Active Buyers: The market shows buying pressure, but the blue box offers a more reliable demand zone for a better risk-reward.
Patience is Key: Waiting for the blue box aligns with a more controlled entry, especially in the current market conditions.
Confirmation Checklist:
When trading the blue box, I will confirm using:
Cumulative Delta Volume (CDV)
Liquidity Heatmap
Volume Profile
Volume Footprint
Upward Market Structure Breaks on Lower Time Frames
Learn Advanced Trading Techniques:
Want to dive deeper into CDV, liquidity heatmaps, or volume profiles? DM me for personalized guidance.
Final Words:
Stay patient, wait for the blue box, and trade with confidence!
If you think this analysis helps you, please don't forget to boost and comment on this. These motivate me to share more insights with you!
I keep my charts clean and simple because I believe clarity leads to better decisions.
My approach is built on years of experience and a solid track record. I don’t claim to know it all, but I’m confident in my ability to spot high-probability setups.
If you would like to learn how to use the heatmap, cumulative volume delta and volume footprint techniques that I use below to determine very accurate demand regions, you can send me a private message. I help anyone who wants it completely free of charge.
My Previous Analysis (the list is long but I think it's kinda good : )
🎯 ZENUSDT.P: Patience & Profitability | %230 Reaction from the Sniper Entry
🐶 DOGEUSDT.P: Next Move
🎨 RENDERUSDT.P: Opportunity of the Month
💎 ETHUSDT.P: Where to Retrace
🟢 BNBUSDT.P: Potential Surge
📊 BTC Dominance: Reaction Zone
🌊 WAVESUSDT.P: Demand Zone Potential
🟣 UNIUSDT.P: Long-Term Trade
🔵 XRPUSDT.P: Entry Zones
🔗 LINKUSDT.P: Follow The River
📈 BTCUSDT.P: Two Key Demand Zones
🟩 POLUSDT: Bullish Momentum
🌟 PENDLEUSDT.P: Where Opportunity Meets Precision
🔥 BTCUSDT.P: Liquidation of Highly Leveraged Longs
🌊 SOLUSDT.P: SOL's Dip - Your Opportunity
🐸 1000PEPEUSDT.P: Prime Bounce Zone Unlocked
🚀 ETHUSDT.P: Set to Explode - Don't Miss This Game Changer
🤖 IQUSDT: Smart Plan
⚡️ PONDUSDT: A Trade Not Taken Is Better Than a Losing One
💼 STMXUSDT: 2 Buying Areas
🐢 TURBOUSDT: Buy Zones and Buyer Presence
🌍 ICPUSDT.P: Massive Upside Potential | Check the Trade Update For Seeing Results
🟠 IDEXUSDT: Spot Buy Area | %26 Profit if You Trade with MSB
📌 USUALUSDT: Buyers Are Active + %70 Profit in Total
🌟 FORTHUSDT: Sniper Entry +%26 Reaction
🐳 QKCUSDT: Sniper Entry +%57 Reaction
📊 BTC.D: Retest of Key Area Highly Likely
I stopped adding to the list because it's kinda tiring to add 5-10 charts in every move but you can check my profile and see that it goes on..

TWTUSDT 1WTWT Update ~ 1W
#TWT Successfully retested this Support,. and for now it still maintains its bullish structure. If you still have Conviction on this coin,. Buy in stages from here. with a minimum target of 20%++

Is #TWTUSDT About to Explode or Collapse? Brace for a Major MoveYello, Paradisers! Are we on the verge of a massive breakout for #TWTUSDT? It's time to dive into the latest analysis and uncover what’s brewing for Trust Wallet Token.
💎We’ve been keeping a close eye on #TWTUSDT, and the signs suggest an explosive move could be on the horizon from the key support level at $1.0276. The price has followed a descending resistance pattern in the past, and when it broke through, it consistently formed higher highs and higher lows. Now, it's regaining momentum at support, hinting at a potential bullish run.
💎If #TWT holds steady at the $1.0276 support level, a powerful rally up to the $1.3576 resistance zone could be next, echoing previous upward trends. However, caution is warranted; if momentum fails, there’s a risk of a drop to the lower demand zone near $0.9455, where a bullish rebound may occur.
💎This is a critical moment,Paradisers. Stay vigilant and closely monitor price action around the demand area. A daily close below $0.9455 could invalidate the bullish outlook and signal further declines.
Stay patient, stick to your strategy, and avoid emotional decisions. That’s how we make it in the long run!
MyCryptoParadise
iFeel the success🌴

TWTUSDT 1WTWT ~ 1W
#TWT If you still have Conviction on this coin,. Buy gradually on this block,. With a minimum target of 20%+. It looks like this resistance line will soon be broken and bulls will dominate.

TWTUSDT - LONG [Daily Signal] [UPDATE]With TWT everything is too obvious, there is no need for technical analysis, to be completely frank. Market Maker has been holding the price for years.


TWTUSD 1WTWT ~ Updated
#TWT Make purchases gradually when the retest of this support line is successful.
Short term target of at least 20%+

TWTUSD 1WTWT ~ 1W
#TWT Make a purchase every time this support line is retested, Aim for at least 15%+

TWT We're at a local bottom!! +100% easyThis is one of the strongest and most promising projects out there, poised for significant growth in the very near future! We're at a local bottom, backed by a solid support zone. It's a buy zone, folks! Don't sell, buy more! 🚀💪

🚨#TWT/USDT Long
#TWT
The price is moving in a descending triangle for 1 D
We now have a successful penetration of this triangle upward
The broken trend was retested
We have oversold conditions on the MACD indicator
Entry price is 1.1455
First target 1.1734
Second target 1.2210
Third goal 1.2629
Fourth goal: 1.3105

TWT/USDT - Trust Wallet Token: Triangle & Wedge◳◱ On the $TWT/ CRYPTOCAP:USDT chart, the Triangle & Wedge pattern suggests a consolidation phase that could precede a trend continuation or reversal. Traders might observe resistance around 1.1607 | 1.2045 | 1.3036 and support near 1.0616 | 1.0063 | 0.9072. Entering trades at 1.1882 could be strategic, aiming for the next resistance level.
◰◲ General info :
▣ Name: Trust Wallet Token
▣ Rank: 129
▣ Exchanges: Binance, Kucoin, Bybit, Gateio, Mexc, Hitbtc
▣ Category/Sector: Financial - Payment Platforms
▣ Overview: The Trust Wallet mobile app is a multi-currency crypto wallet that gives users access to a wide range of digital assets, and has a built-in DEX (for android users). Trust Wallet joined the Binance ecosystem in 2018 and is now the official crypto wallet of Binance Smart Chain (BSC).
Trust Wallet Token (TWT) is a utility and governance token, native to the Trust Wallet and available on both the BEP-2 (Binance Chain) and BEP-20 (Binance Smart Chain) standards.
Trust Wallet’s core modules are open-source and available for any developer to build on. The digital wallet mobile app has fiat on-boarding, allowing users to purchase crypto with credit cards. Trust Wallet has integrated with other DEXs such as Pancake Swap, Uniswap or Binance DEX so that users can buy, hold, and exchange their crypto-assets using a single interface. Trust Wallet supports buying, exchanging, and staking 160,000 crypto assets on 40 blockchains.
The project’s overarching goal is to become the interface to all crypto by making it easier for users to access crypto services like dapps.
◰◲ Technical Metrics :
▣ Mrkt Price: 1.1882 ₮
▣ 24HVol: 3,428,375.626 ₮
▣ 24H Chng: 4.402%
▣ 7-Days Chng: 5.31%
▣ 1-Month Chng: 1.97%
▣ 3-Months Chng: -12.13%
◲◰ Pivot Points - Levels :
◥ Resistance: 1.1607 | 1.2045 | 1.3036
◢ Support: 1.0616 | 1.0063 | 0.9072
◱◳ Indicators recommendation :
▣ Oscillators: SELL
▣ Moving Averages: STRONG_BUY
◰◲ Technical Indicators Summary : BUY
◲◰ Sharpe Ratios :
▣ Last 30D: -0.10
▣ Last 90D: -0.77
▣ Last 1-Y: 0.01
▣ Last 3-Y: 0.72
◲◰ Volatility :
▣ Last 30D: 0.44
▣ Last 90D: 0.65
▣ Last 1-Y: 0.71
▣ Last 3-Y: 1.17
◳◰ Market Sentiment Index :
▣ News sentiment score is N/A
▣ Twitter sentiment score is 0.62 - Bullish
▣ Reddit sentiment score is 0.77 - V. Bullish
▣ In-depth TWTUSDT technical analysis on Tradingview TA page
▣ What do you think of this analysis? Share your insights and let's discuss in the comments below. Your like, follow and support would be greatly appreciated!
◲ Disclaimer
Please note that the information and publications provided are for informational purposes only and should not be construed as financial, investment, trading, or any other type of advice or recommendation. We encourage you to conduct your own research and consult with a qualified professional before making any financial decisions. The use of the information provided is solely at your own risk.
▣ Welcome to the home of charting big: TradingView
Benefit from a ton of financial analysis features, instruments and data. Have a look around, and if you do choose to go with an upgraded plan, you'll get up to $30.
Discover it here - affiliate link -

TWT → A Massive Long Opportunity! Let's Max Your Profits.Trust Wallet Token is currently attempting to break its bear channel resistance after a nice Head and Shoulders reversal pattern! My last analysis only got us a 1:1 Risk Reward on a short before the right shoulder began to show itself. Now we should be looking for long entries.
How do we trade this?
We have a descending bear channel arcing to the upside after a strong bull run, a head and shoulders reversal pattern, bear capitulation candle (end of trend signal), RSI above the Moving average, what more can a bull want!?
Specifically, another small pullback and for the RSI to come down a bit. The price is currently at resistance and has printed two 4HR doji (trading range, "indecision") candles prior to this one, not a sign of bull strength. I would wait for a small pullback to the EMAs and look for a strong bull signal and confirmation bar to long. Preferably, wait for a break of resistance and a test to confirm support, then place a protective stop below the 30EMA and 200EMA. Your profit target could be many, I would personally take half profits at 1:1 Risk/Reward ($1.36), move your stop loss up to your entry, and then swing the rest until you get a reversal signal.
The crypto market has been burning hot for the bulls, but always be on the lookout for a reversal signal!
Trade Idea
Long Entry : $1.25
Stop Loss: $1.14
Take Profit: $1.69
Risk/Reward Ratio: 1:4
Key Takeaways
1. Head and Shoulders Reversal Pattern, Bias to Long.
2. Capitulation Bear Candle, End of Trend Signal.
3. At Channel Resistance, wait for pullback to EMA Ribbons.
4. Look for Strong Bull Signal and Confirmation Candle to Long.
5. RSI at 67.00, Supports Waiting for a Pullback.
You are solely responsible for your trades, trade at your own risk!
If you found this analysis helpful, click the Boost button and let us know what you think in the comment section below!

Awaiting TWT's recoveryHello everyone! After the announcement of the Web3 wallet from Binance, TWT started dumping and the token lost more than 30% from its peak price.
Currently, I am observing price stabilization, and we can consider a small upward movement for a correction after the drop.
The target of $1.61 aligns with the golden ratio at Fibonacci 0.618. Entry can be made after the breakout of 0.236 on the Fibonacci retracement, with a modest gain of only 15%. However, this could potentially lead to quick profits.
Alternatively, a position can be opened from the current levels, resulting in a profit of 20%.
These recommendations are for spot trading. If you want to try it on futures, I can advise entering strictly from 0.236 on the Fibonacci (at $1.40) and placing a stop loss at $1.33, which gives us a risk-to-reward ratio of 3:1 - a very good setup. Leverage should not exceed x5.
Please note that this is not financial advice, and all trading activities are done at your own risk.

Trust Wallet Token (TWT) formed bullish Gartley upto 13% pumpHi dear friends, hope you are well and welcome to the new trade setup of Trust Wallet Token (TWT) wit BTC pair.
Previously we caught more almost 30% pump of TWT as below:
On a daily time frame, TWT has formed a bullish Gartley move for the next price reversal.
Note: Above idea is for educational purpose only. It is advised to diversify and strictly follow the stop loss, and don't get stuck with trade.
TLong

TWTUSDTThis is a 1D frame analysis for TWTUSDT As you can see, the price has not been able to stay on our support area which is currently playing a resistance role and is being pressured by strong selling pressure towards the next support line. The price is currently on our support area and we can say that it does not have enough power to rise and the price is falling. However, if this area is lost, we can consider an attractive price for buying this coin at point S2.

Cryptocurrency Market Analysis: TWT Coin📈 The TWT coin has reached a buying point, and it's becoming evident to us observers that accumulation or position building is taking place near the support level. I have already partially entered a position and will be awaiting a potential impulse.
📊 TWT is a token associated with the Trust Wallet platform, which provides secure storage for cryptocurrencies and facilitates easy blockchain navigation. The coin reflects the popularity and support of this platform, while also offering opportunities to participate in the Trust Wallet ecosystem.
⚙️ Technical analysis shows that TWT is near a support level, which may indicate potential price strengthening. Now is the time when investors are considering the possibility of entering positions.
❗️ Please be aware that this is only a general analysis and not financial advice. When making investment decisions, it's important to conduct your own research and consult with experts.
💡 Nonetheless, the TWT coin has caught my interest, and I have decided to enter a position, anticipating future growth. I will be closely monitoring price movements and sharing any new discoveries with you.
🔔 If you are interested in receiving more analytical information and updates about the cryptocurrency market, subscribe to our channel.
