$UBER isn't cheap!- NYSE:UBER shouldn't trade more than $65 until they start improving EPS
- Fundamentally,
Year | 2026 | 2027 | 2028
EPS | 3.49 | 4.46 | 5.32
EPS% | -34.92% | 27.77% | 19.35%
2026 : we are getting big reduction in EPS yoy and next year it's increasing by 27% and then moderating to high teens.
Price target ( base case 20x multiple) should be:
Year | 2026 | 2027 | 2028
Price | $68 | $88.9 | $106
Conservative Case ( 15x multiple )
Year | 2026 | 2027 | 2028
Price | $52 | $66 | $79
Bear Case ( 10x multiple )
Year | 2026 | 2027 | 2028
Price | $34 | $44.6 | $53.3
Uber

BIDUBreakthrough the triangle and form a bullish flag, hold at 115 support, if breakthrough (125 to 140) that bullish to 160 then could retest 140 for higher area.

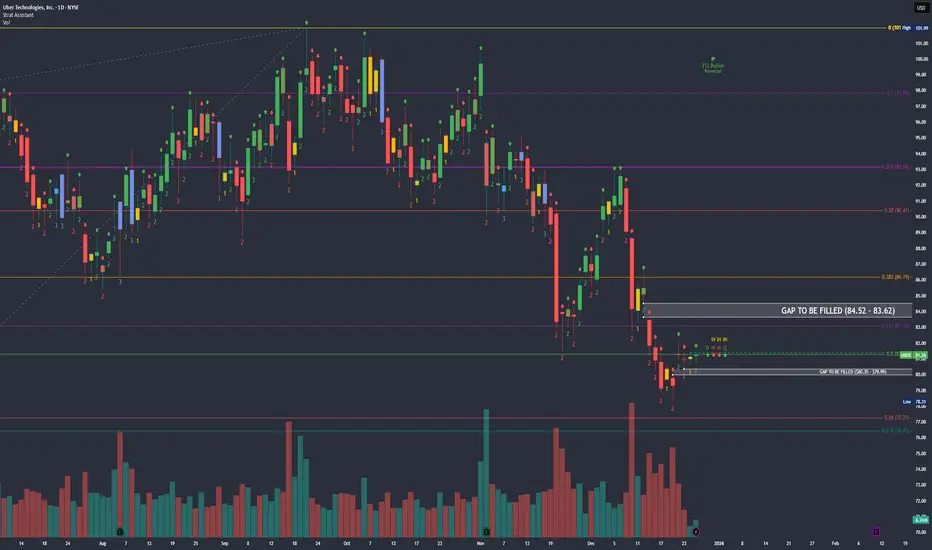
$UBER Daily: 2u Continuation Above $81.50 Resistance Break📊 POSITION: $85c 03/20/26 @ $4.28 | Current Stock Price: $81.26
🎯 PT: $8.56 (+100%) | SL: Below $80.68
━━━━━━━━━━━━━━━━━━━━━━━━━━━━━━━━━━━━
📈 MULTI-TIMEFRAME STRUCTURE
WEEKLY: 3-2d-1 Inside Week (Consolidation)
- Bullish trigger: Break above $82.25
- Bearish invalidation: Close below $80.35 → Target $78.30
- Status: Coiling for directional move
2-DAY: 3-1-2u Pattern
- 2u continuation setup above $81.50
- Watching for confirmation candle
DAILY: 2d-1-2u Structure (CHART SHOWN)
- Key resistance: $81.50 (Previous Day High) - breakout = continuation
- Critical support: $81.09 (previous day midpoint)
- Below $81.09 on multiple timeframes → Bearish to $80.68 (Previous Day Low)
- Further downside: $80.50 → $80.00
- Upside gap-fill target: $83.62-$84.52
━━━━━━━━━━━━━━━━━━━━━━━━━━━━━━━━━━━━
🎯 FIBONACCI ANALYSIS
Long-Term Fib (ATL → ATH):
- Swing: $13.71 (03/18/20) → $101.99 (09/22/25)
- Current zone: 0.214-0.28 retracement ($77.27-$83.10)
- Holding bullish all-time Fibonacci support
Recent Swing Fib:
- Swing: $60.63 (04/07/25) → $101.99 (ATH)
- Current: 0.5-0.618 golden pocket ($76.43-$81.31)
- Price finding support at key retracement zone
━━━━━━━━━━━━━━━━━━━━━━━━━━━━━━━━━━━━
📍 KEY LEVELS
Resistance:
$81.50 (PDH - breakout trigger)
$82.25 (weekly bullish confirmation)
$83.62-$84.52 (gap fill zone)
Support:
$81.09 (daily midpoint)
$80.68 (PDL - stop-loss level)
$80.00 (psychological support)
━━━━━━━━━━━━━━━━━━━━━━━━━━━━━━━━━━━━
💡 TRADE THESIS
Price consolidating at confluence of multiple Fibonacci support zones while forming a 1-2u-2u continuation pattern. Clean risk/reward with defined invalidation below $80.68. Break above $81.50 triggers 2u continuation toward gap fill at $83-84.
Entry rationale:
✓ Multi-timeframe alignment (Weekly inside bar, 2D/Daily 2u setup)
✓ Golden pocket Fibonacci support (0.5-0.618)
✓ Long-term Fibonacci support holding
✓ Clear upside gap to fill
✓ Defined risk below $80.68
━━━━━━━━━━━━━━━━━━━━━━━━━━━━━━━━━━━━
⚠️ RISK MANAGEMENT
- Contract: 81 DTE (03/20/26 expiry)
- Stop-loss: Price close below $80.68
- Profit targets: Breakeven at +25% of contract price, trailing half at +50%, exit at +100%
- Position size: Appropriate for 81 DTE timeframe
*Not financial advice.
*Trade at your own risk.
GRAB...whilst the going's good?GRAB - The 'UBER' (and some) of Cambodia, Indonesia, Malaysia, Myanmar, the Philippines, Singapore, Thailand and Vietnam...After 2 consecutive PB quarters, GRAB could be shaping up for a successful couple years ahead.
Our systems have identified a point of potential interest & volatility in $NASDAQ:GRAB.
If price can hold above $4.27 ... Significant Bullish potential may be unlocked.
If however price falls below $4.27 ... Significant Bearish risk may come into play.
As things sit now, it seems momentum may be to the upside for GRAB, but will it hold? Let's find out...
We're inspired to bring you the latest developments across worldwide markets, helping you look in the right place, at the right time.
Thank you for reading! Stay tuned for further updates, and we look forward to being of service along your trading & investing journey...
Disclaimer: Please note all information contained within this post and all other Bullfinder-official Tradingview content is strictly for informational purposes only and is not intended to be investment advice. Please DYOR & Consult your licensed financial advisors before acting on any information contained within this post, or any other Bullfinder-official TV content.

UBER Pressured by FTC Lawsuit as Uptrend Faces Key TestUber Technologies (NYSE: UBER) is facing renewed regulatory pressure after the Federal Trade Commission, joined by 21 U.S. states and the District of Columbia, filed an amended lawsuit accusing the company of deceptive billing and cancellation practices tied to its Uber One subscription service. The complaint alleges that some users were charged without proper consent, failed to receive promised savings, and encountered difficulties canceling their subscriptions.
While the lawsuit adds headline risk, it does not fundamentally alter Uber’s long-term growth narrative. Uber One has been a key pillar in driving user retention, higher trip frequency, and improved unit economics across mobility and delivery. However, increased regulatory scrutiny could lead to fines, operational changes, or tighter oversight around subscription disclosures — all of which may weigh on near-term sentiment.
From a broader fundamental perspective, Uber continues to benefit from strong demand across ride-hailing, delivery, and advertising. The company has also been positioning itself for the future of mobility through partnerships in autonomous vehicles, even as regulatory developments create intermittent volatility. Historically, similar legal challenges have produced short-term pressure rather than lasting damage to Uber’s business model.
Technically, UBER remains in a well-defined long-term uptrend despite the recent pullback. Price has retraced from the $100–$102 resistance zone and is currently consolidating above the rising trendline that has guided price higher since 2023. This area, near the low-to-mid $80s, represents a key technical support region.
A successful defense of this trendline could set the stage for a rebound and another attempt toward the $100 psychological level. Conversely, a decisive break below trend support would expose deeper downside toward the $65–$70 demand zone, which previously acted as a major accumulation area.
Overall, Uber’s fundamentals remain intact, but regulatory headlines are likely to continue driving short-term volatility as the stock tests critical technical levels.

$UBER running out of gas! - NYSE:UBER is valuation doesn't provide meaningful upside.
- NYSE:UBER is buying back shares which is providing floor to the stock price. These amount should have been better utilized in finding growth opportunity.
- EPS is declining in 2026.
- NYSE:UBER is hard pass at 90s as it doesn't offer meaningful upside and base case suggests it will be around $95-100 in 2028
- Therefore, avoiding NYSE:UBER is the best decision.

Uber (NYSE: UBER) Eyes AV Expansion as Trendline Holds StrongUber Technologies (NYSE: UBER) appears increasingly well positioned in the autonomous vehicle (AV) landscape, following insights shared by RBC Capital Markets. After hosting investor meetings with Uber executives, RBC noted stronger confidence in Uber’s competitive moat despite heightened industry rivalry from players such as Alphabet’s Waymo and Tesla’s expanding robotaxi ambitions. Although headlines from these competitors may introduce periodic volatility, RBC expects Uber to remain structurally advantaged given its global network, ride-hailing dominance, and scaling capability.
A key highlight from the discussions was Uber’s ambitious plan to launch AV services in 10 additional markets by the end of 2026, signaling a major expansion effort. Added to this is Uber’s strategic vehicle acquisition program—what RBC analysts called “most compelling.” By purchasing vehicles directly, Uber aims to gather extensive utilization data that could help lenders and institutions better understand the yield profile of AV fleets. This strategy could accelerate the transformation of AVs into a recognized institutional asset class and support more scalable deployments in coming years.
From a technical standpoint, UBER remains structurally bullish. Price continues to respect a multi-year ascending trendline, with recent pullbacks bouncing near the $85–$88 zone. This area aligns with dynamic support and suggests buyer interest is still intact. A continuation toward the $100–$102 resistance zone remains probable, with a potential breakout toward RBC’s $110 target if broader market sentiment cooperates.
Momentum indicators, including MACD and RSI, show cooling but not breakdown, indicating consolidation rather than reversal. Volume behavior also reflects healthy rotation. As long as the trendline holds, Uber remains poised for another leg upward—supported by both strong fundamentals and solid technical structure.
Overall, Uber’s positioning in the AV race, strategic scaling plan, and resilient chart structure align to support a constructive medium-term outlook.

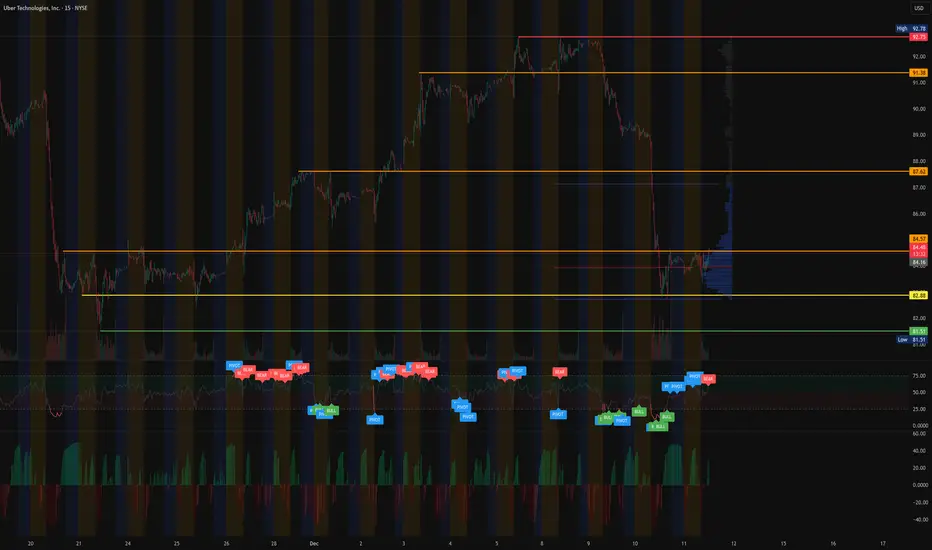
$UBER - Pullback To Key Support After Multi Week RallyUBER has pulled back into a major support zone at 82.88 after a strong run toward the recent highs near 92.75. Price is now consolidating at the lower end of this micro-range, holding above value-area support and attempting to stabilize after heavy selling pressure.
The chart shows a clear liquidity sweep below support followed by buyers stepping back in, which can be a constructive sign if momentum continues to shift upward.
We prefer the long setup closer to 82.88, where both structure and volume support align.
Technical Overview
Support Levels:
82.88 (primary support, ideal buy zone)
82.40 (local low)
81.51 (momentum failure level)
Resistance Levels:
84.57 (current ceiling and VWAP zone)
87.62 (value-area boundary)
91.38 (major supply zone)
92.75 (recent high)
Structure:
Strong prior uptrend followed by retracement
Consolidation forming above 82.88
Sideways corrective range with declining volume
Price trading inside high-volume node on VPVR
Momentum:
MACD histogram shifting toward neutral
RSI stabilizing after the flush
Buyers defending support consistently
Trend Bias:
Bullish as long as price holds above 82.88
Strongly bullish above 84.57
As long as UBER holds above 82.88, bulls maintain control over this retracement setup.
A reclaim and hold above 84.57 opens the door to 87.62, 91.38, and a potential retest of 92.75.
A breakdown below 81.51 signals failed momentum for this setup.
My Plan
Entry Zone: 82.88 to 83.25
Targets: 84.57, 87.62, 91.38
Stretch Target: 92.75
Invalidation: Close below 81.51
UBER remains in a bullish macro structure, and this pullback may offer one of the cleaner continuation entries if support holds.
Share your thoughts, and I will post an update if we confirm a breakout over 84.57.
#UBER #Stocks #MyMIWallet #TradeAlerts NASDAQ:LYFT NASDAQ:AMZN NASDAQ:GOOG
UBER Investment ThesisUBER is shifting from a ride hailing and food delivery platform into something that looks more like core logistics infrastructure and that evolution is becoming a bigger part of my bull thesis.
The stock is trading around $91, up solidly over the past year, and the chart shows a clear uptrend. Right now price is consolidating just below the prior 52-week highs, which feels more like a healthy pause than a top, especially when you look at the revenue acceleration and margin expansion underneath.
The big fundamental piece to keep an eye on is Uber Direct. This is Uber's white-label last-mile network for retailers, where the company essentially rents out its driver and courier infrastructure to e-commerce and retail players who then use it under their own brand. Think of it like Amazon's AWS moment. Uber captures full logistics revenue without the usual customer acquisition costs or marketplace risk because the retailer is already bringing the demand. This infrastructure-style revenue sits on top of the existing Mobility and Delivery volumes, so as the network scales, incremental margins should expand. That margin expansion feeds through to earnings and, over time, should support a higher multiple.
From a trading perspective, this setup argues for buying dips within the trend as long as price holds above key support levels like recent swing lows and major moving averages, and as long as earnings revisions stay positive. If execution stays on track, upside over the next 12 to 24 months could come from continued double-digit revenue growth, rising EBITDA margins, and optionality around autonomous vehicles and new logistics partnerships. In that scenario, the stock could move toward the $120 to $125 area.
On the risk side, watch for any break for supports around $80, especially if it coincides with negative news on regulation, autonomous vehicle partnerships or a slowdown in logistics growth. If that happens, it makes sense to tighten stops or step aside until the fundamental story and the price action line back up.

Top winners in the stock marketRecently, the shares of Marvell Technology Inc (#Marvel), Dell Technologies Inc (#Dell), Uber Technologies Inc (#Uber), Coinbase Global Inc (#Coinbase) , and Palantir Technologies Inc (#Palantir) have risen amid increasing demand for products essential to artificial intelligence — chips, servers, and software.
Key triggers:
1. Strong industry news: companies producing chips and servers reported results above expectations and signaled further growth.
2. Uber’s launch of robotaxi services.
3. A surge in crypto activity at the end of November.
Five Growth Drivers :
#Marvel (+21.2%) — a surge following earnings and the acquisition of Celestial AI (developer of optical solutions for AI) for ~$3.25 billion, paired with an optimistic outlook for next year.
#Dell (+12.9%) — raised its guidance thanks to soaring demand for AI servers and a record number of confirmed orders.
#Uber (+8.5%) — shares gained after the launch of robotaxi services in Dallas in partnership with Avride, signaling a new stage of autonomous ride scaling.
#Coinbase (+7.1%) — a rebound in late November driven by increased crypto volatility and trading volumes (Coinbase profits from trading activity).
#Palantir (+7.2%) — supported by a strong Q4 outlook and continued demand for its AI platform; enthusiasm in the AI sector fueled additional momentum.
Strong fundamental drivers for #Marvel / #Dell (AI infrastructure) and #Palantir (contracts + commercial AI) create solid ground for the trend to continue. #Uber gains fresh momentum from robotaxi expansion, and #Coinbase stands to benefit further if elevated crypto activity and higher trading volumes persist.
FreshForex analysts see continued growth potential for #Marvel, #Dell, #Uber, #Coinbase, and #Palantir , supported by rising demand for AI solutions and digital infrastructure.
As long as no concrete industry issues arise (such as delays or cancellations of major AI-hardware orders, or chip supply disruptions), these stocks retain strong upward prospects.

$70 coming soon?This looks bullish and came back into that channel, a classic reversal. I think its going to hit 75 in next 6-9 months. If it looses 35, then its bearish and can go down from there.
All the best !!

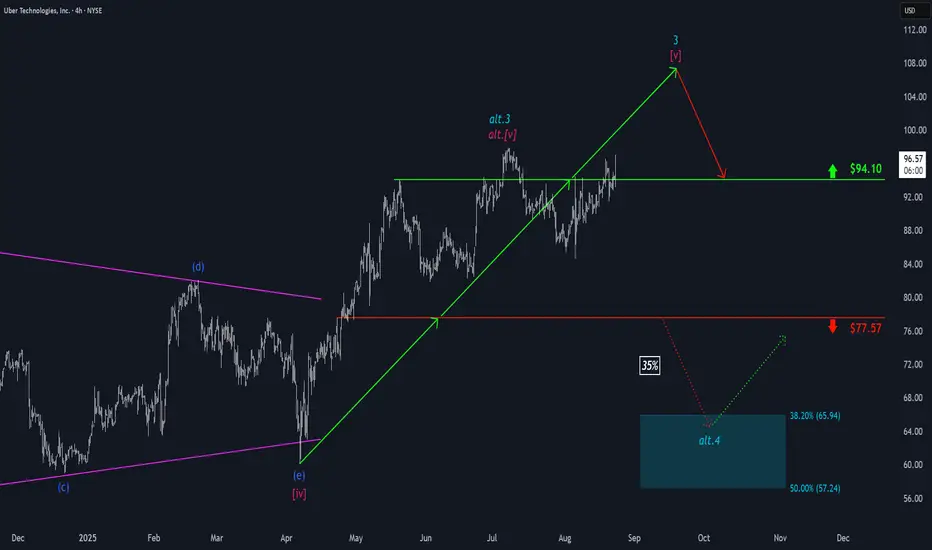
Uber: Pulling BackUber has recently pushed higher toward resistance at $101.99 before pulling back noticeably from that level. This move aligns perfectly with our primary scenario, as we continue to expect a broader sell-off into the turquoise Target Zone between $68.29 and $59.15 as part of turquoise wave 4. Within this zone, we anticipate price will reverse and resume its broader upward trend, eventually breaking through the $101.99 resistance. However, if Uber reverses course soon and breaks above the $101.99 mark without setting new lows, we would then expect a new high for turquoise wave alt.3 . We currently assign a 35% probability to such a delay in the ongoing upward impulse.

$UBER Holds Key Support as Q3 Profit Smashes ExpectationsUber Technologies, Inc. (NYSE: NYSE:UBER ) posted a strong third-quarter earnings report last week, but investor reaction was muted as shares slipped 4.5% to $92.12. Despite the short-term dip, the company’s fundamentals remain robust, and the technical chart suggests a potential rebound ahead.
For the quarter, Uber reported revenues of $13 billion, in line with analyst estimates. However, the standout metric was profitability. The ride-hailing and delivery giant surprised markets with statutory earnings of $3.11 per share, blowing past consensus forecasts by more than 350%. This marks a major milestone in Uber’s transformation from a cash-burning startup into a consistently profitable platform business.
Analysts view the latest results as a sign of improved efficiency and stronger margins across both the Mobility and Delivery segments. Revenue per trip rose modestly, while cost discipline and higher utilization helped drive record profits. Looking ahead, Wall Street forecasts continued earnings momentum through 2026, supported by demand growth and operational leverage.
Technically, the stock remains above its multi-year ascending trendline, with strong support near the $85–$88 range. The price action shows a healthy consolidation following a breakout above the $80 resistance zone, with buyers likely to defend the trendline if tested. A rebound from current levels could push NYSE:UBER back toward the $100–$102 resistance area, which aligns with the prior high.
Momentum indicators like RSI also suggest the stock is entering a potential accumulation zone, signaling room for upside continuation once sentiment stabilizes. Overall, Uber’s fundamentals appear solid, and the long-term trend remains bullish despite short-term volatility.

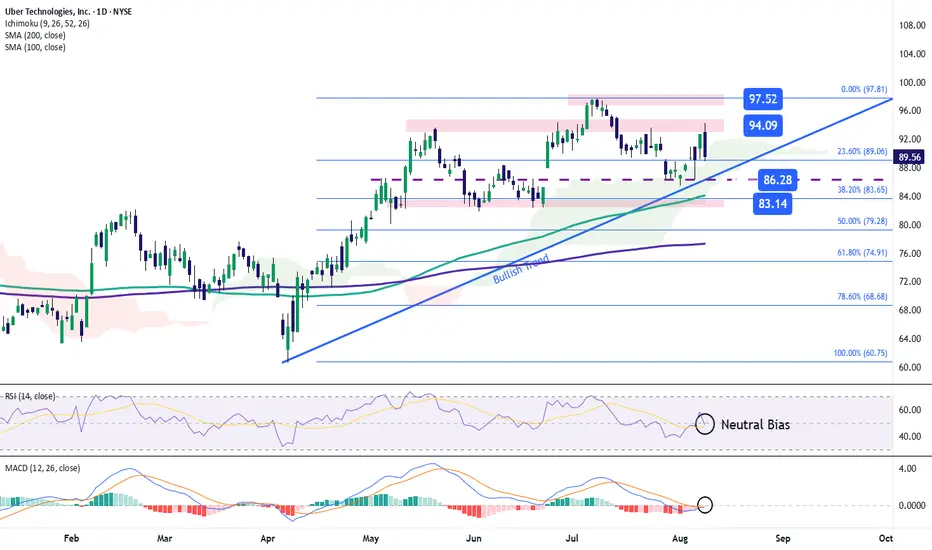
Uber Stock Faces Indecision After Earnings ReportDuring the last trading session, Uber’s stock fell more than 5.5%, as volatility increased following the release of the company’s quarterly earnings report.
Although revenue came in at $13.47 billion, slightly above expectations of $13.28 billion, and earnings per share (EPS) reached $3.11, the stock experienced strong selling pressure. This decline was mainly driven by the company’s announcement that rising costs and shrinking profit margins remain a concern — a trend that could persist in future reports. This outlook has fueled investor uncertainty, leaving the stock in a state of indecision.
Sideways Movement Gains Relevance
In recent weeks, Uber’s share price has formed a consistent sideways range, following the break of an upward trendline that had been in place for several months. The upper boundary of the channel remains near $100, while the lower boundary sits around $91.
Although recent selling activity has been dominant, it has not been strong enough to break the range, making this lateral structure the most relevant technical formation to monitor. As long as the price remains within this channel, market indecision is likely to persist over the coming sessions.
RSI
The RSI line hovers around the 50 level, reflecting neutral momentum between bullish and bearish forces, with no clear directional bias over the past 14 sessions. If the RSI continues to fluctuate near this zone, indecision may continue to reinforce the sideways pattern in the coming weeks.
MACD
The MACD histogram remains close to the zero line, indicating a lack of directional strength in short-term moving averages. This behavior aligns with the dominance of the current sideways channel, suggesting that the market could continue trading without a clear trend in the near term.
Key Levels to Watch:
$100 – Main Resistance:
Marks the top of the sideways range and serves as the most important psychological level. A sustained move above this zone could reactivate the previous bullish trend, which has been inactive for several weeks.
$95 – Intermediate Barrier:
Aligns with the 50-period simple moving average (SMA). If the price consolidates near this level, it could extend the sideways range in the coming sessions.
$91 – Main Support:
Represents the bottom of the lateral channel and aligns with the 23.6% Fibonacci retracement level. A break below this zone could trigger a new bearish trend in the short to medium term.
Written by Julian Pineda, CFA – Market Analyst

Uber Market Outlook – Swing Trade Opportunity on the Horizon🚖 UBER TECHNOLOGIES, INC — Market Wealth Strategy Map (Swing/Day Trade)
👋 Dear Ladies & Gentlemen (Thief OG’s), welcome to today’s Wealth Strategy Map on $UBER!
🔑 Game Plan (Thief Style)
Trend Bias → Bullish plan confirmed via Hull Moving Average pullback 📈
Entry (Layered Buy Strategy) → Using the Thief’s layering style (multiple buy-limit orders):
$96.00
$97.00
$98.00
$99.00
(You can add more layers if you want — it’s flexible by design) 🧩
Stop-Loss (SL) → $92.00 (📉 “Thief SL Zone”)
⚠️ Note: I’m not recommending you stick only to my SL — adjust based on your risk appetite.
Target (TP) → $108.00 (🚔 Police barricade zone = resistance + overbought trap!)
⚠️ Again, profit-taking is your choice — manage your exits wisely.
📊 Key Notes & Style
Hull MA pullback = Trend confirmation 🔒
Layering Strategy (Thief Style) = Scaling in with multiple limit orders instead of one big bite 🍕
Resistance @108.00 = Our “Escape Point” 🚁
Risk Management = Personal responsibility — don’t blindly copy!
🔗 Related Assets / Correlations
NASDAQ:LYFT (ridesharing peer) 🚗
NASDAQ:TSLA (EV demand + mobility trends) ⚡
NASDAQ:QQQ (tech-heavy index correlation) 📊
AMEX:SPY (broad market driver) 🌍
Watching these helps confirm broader tech + mobility sector sentiment.
✨ “If you find value in my analysis, a 👍 and 🚀 boost is much appreciated — it helps me share more setups with the community!”
⚠️ Disclaimer: This is a Thief Style Strategy shared for fun & educational purposes. Not financial advice. Trade at your own risk.
#UBER #StockMarket #SwingTrade #DayTrade #HullMovingAverage #ThiefStrategy #LayeringEntries #StockAnalysis #TradingCommunity
My view on UBERFrom the current structure, if the price broke below the trendline that has been supporting the recent move, I think Uber will likely head down to retest the highlighted support zone.
That move would also align with a potential test of the 200-day SMMA, creating a strong confluence level.
🎯 Conclusion: My bias turns bearish if the price breaks the trendline — in that case, I expect Uber to move into support while testing the 200 SMMA. Still, markets are unpredictable, and this remains only my view.
👉 For more structured market insights and professional analysis, follow along.

$UB/USDT pumped over 26% today, breaking out strong with buyers $UB/USDT pumped over 26% today, breaking out strong with buyers in full control. 🚀💥

$UB/USDT is consolidating at channel support. Price is holding $UB/USDT is consolidating at channel support.
Price is holding steady above the trendline.
If buyers step in, momentum can build quickly.
A breakout toward 0.06–0.07 is possible.
Watching closely for confirmation of strength.

UBER HIGH PROBABILITY SETUP SOON!!!🚨 UBER HIGH PROBABILITY SELL SETUP 🚨
* Here We Can See Clearly The Next Potential Move For UBER Coming Hours/Days.
* Keep Your Eyes Close On Your Trading Positions.
* Happy PIP Hunting Traders.
FXKILLA.
Uber: Another Run at $94.10 ResistanceUber has made another attempt to break through resistance at $94.10 – a move that was briefly successful – but persistent downward pressure prevented a sustained breakout. We still expect the stock to move decisively above the $94.10 level to establish the high of turquoise wave 3; only afterward do we anticipate a more significant pullback. However, there remains a 35% probability that Uber has already completed turquoise wave alt.3 with its highest peak above $94.10 so far, and could next decline into our turquoise alternative Target Zone between $65.94 and $57.24 during wave alt.4 .
Uber Stock Fails to Hold Above $90Shortly after releasing earnings, Uber’s stock has continued to decline, posting a new drop of over 4% in the latest session, as selling pressure remains dominant in the short term. Although results were in line with expectations —with earnings per share at $0.63 and total revenue reaching $12.65 billion, compared to the expected $12.46 billion— investor sentiment has turned cautious. Doubts have emerged regarding the company's ability to sustain its growth pace, and concerns are rising over potential overspending on autonomous driving projects. These factors have weakened confidence in the stock, and as long as uncertainty persists, selling pressure may continue to build.
Uptrend Remains Intact… for Now
Since April 7, Uber’s stock has maintained a steady uptrend, which remains the dominant structure on the chart in the short term. While the recent downside correction has been notable, it has not yet been strong enough to clearly break the trend, so the long-term bias remains bullish for now. However, if bearish momentum strengthens, the integrity of this structure could begin to be challenged.
Indicators Show Neutral Momentum
Both the RSI line and the MACD histogram currently sit within a neutral zone, reflecting a lack of clear direction in the short term. If this setup persists, the recent sell-off may evolve into a more extended consolidation phase, with the price moving sideways until a new directional catalyst emerges.
Key Levels to Watch:
$94 – Key Resistance:
This level aligns with a neutral zone observed in recent weeks. If the price climbs back above this area, it could reactivate the current uptrend.
$86 – Short-Term Support:
This level forms the base of the uptrend line. If selling pressure continues, it could act as a key support. A break below it may reflect growing uncertainty and trigger a stronger bearish bias.
$83 – Critical Support:
This zone coincides with the 38.2% Fibonacci retracement level and the 100-period simple moving average. A sustained move below this point could terminate the prevailing bullish structure on the chart.
Written by Julian Pineda, CFA – Market Analyst
UBER longBroken long term resistance, retested, and once again pushed 20 day Donchian Channel.
Turtles are coming out of their shells taking UBER to the new ATHs.
Long term hold.

Uber’s Path to $95+Uber Technologies (UBER) is positioning itself for long-term growth by expanding beyond its core ride-hailing and delivery businesses into advertising, travel, service partnerships, and autonomous vehicle (AV) technology. These strategic moves aim to diversify revenue streams and enhance operational efficiency.
Key Growth Drivers:
- Strong Core Business Performance – Uber continues to benefit from robust demand in both ride-hailing and delivery, generating significant economic profit.
- Artificial Intelligence Integration – AI plays a crucial role in optimizing pricing, reducing wait times, personalizing user experiences, and preventing fraud.
- Autonomous Vehicle Expansion – Uber is increasingly leveraging AV technology to reduce driver-related costs and scale its services.
- Strategic Investments – The company is using its strong cash flow to fund innovation, product development, acquisitions, and minority investments, driving long-term value.
- Capital-Efficient Growth – Uber’s ability to expand its service platform with minimal capital investment is expected to accelerate revenue growth and shareholder value creation.
Price Target & Options Flow:
Tigress Financial has raised Uber’s price target from $103 to $110, maintaining a Buy rating. Additionally, option flow on Uber is showing strong bullish activity, suggesting institutional interest. Given this momentum, Uber could potentially surpass $95 before August, especially if AV advancements and AI-driven efficiencies continue to strengthen its financial outlook
