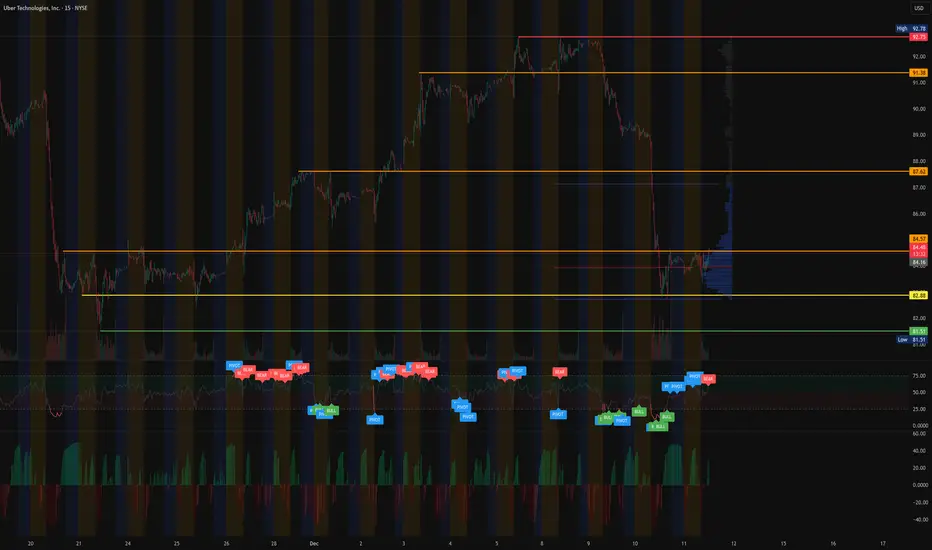
$UBER - Pullback To Key Support After Multi Week RallyUBER has pulled back into a major support zone at 82.88 after a strong run toward the recent highs near 92.75. Price is now consolidating at the lower end of this micro-range, holding above value-area support and attempting to stabilize after heavy selling pressure.
The chart shows a clear liquidity sweep below support followed by buyers stepping back in, which can be a constructive sign if momentum continues to shift upward.
We prefer the long setup closer to 82.88, where both structure and volume support align.
Technical Overview
Support Levels:
82.88 (primary support, ideal buy zone)
82.40 (local low)
81.51 (momentum failure level)
Resistance Levels:
84.57 (current ceiling and VWAP zone)
87.62 (value-area boundary)
91.38 (major supply zone)
92.75 (recent high)
Structure:
Strong prior uptrend followed by retracement
Consolidation forming above 82.88
Sideways corrective range with declining volume
Price trading inside high-volume node on VPVR
Momentum:
MACD histogram shifting toward neutral
RSI stabilizing after the flush
Buyers defending support consistently
Trend Bias:
Bullish as long as price holds above 82.88
Strongly bullish above 84.57
As long as UBER holds above 82.88, bulls maintain control over this retracement setup.
A reclaim and hold above 84.57 opens the door to 87.62, 91.38, and a potential retest of 92.75.
A breakdown below 81.51 signals failed momentum for this setup.
My Plan
Entry Zone: 82.88 to 83.25
Targets: 84.57, 87.62, 91.38
Stretch Target: 92.75
Invalidation: Close below 81.51
UBER remains in a bullish macro structure, and this pullback may offer one of the cleaner continuation entries if support holds.
Share your thoughts, and I will post an update if we confirm a breakout over 84.57.
#UBER #Stocks #MyMIWallet #TradeAlerts NASDAQ:LYFT NASDAQ:AMZN NASDAQ:GOOG
Uberforecast
UBER Investment ThesisUBER is shifting from a ride hailing and food delivery platform into something that looks more like core logistics infrastructure and that evolution is becoming a bigger part of my bull thesis.
The stock is trading around $91, up solidly over the past year, and the chart shows a clear uptrend. Right now price is consolidating just below the prior 52-week highs, which feels more like a healthy pause than a top, especially when you look at the revenue acceleration and margin expansion underneath.
The big fundamental piece to keep an eye on is Uber Direct. This is Uber's white-label last-mile network for retailers, where the company essentially rents out its driver and courier infrastructure to e-commerce and retail players who then use it under their own brand. Think of it like Amazon's AWS moment. Uber captures full logistics revenue without the usual customer acquisition costs or marketplace risk because the retailer is already bringing the demand. This infrastructure-style revenue sits on top of the existing Mobility and Delivery volumes, so as the network scales, incremental margins should expand. That margin expansion feeds through to earnings and, over time, should support a higher multiple.
From a trading perspective, this setup argues for buying dips within the trend as long as price holds above key support levels like recent swing lows and major moving averages, and as long as earnings revisions stay positive. If execution stays on track, upside over the next 12 to 24 months could come from continued double-digit revenue growth, rising EBITDA margins, and optionality around autonomous vehicles and new logistics partnerships. In that scenario, the stock could move toward the $120 to $125 area.
On the risk side, watch for any break for supports around $80, especially if it coincides with negative news on regulation, autonomous vehicle partnerships or a slowdown in logistics growth. If that happens, it makes sense to tighten stops or step aside until the fundamental story and the price action line back up.

Uber: Pulling BackUber has recently pushed higher toward resistance at $101.99 before pulling back noticeably from that level. This move aligns perfectly with our primary scenario, as we continue to expect a broader sell-off into the turquoise Target Zone between $68.29 and $59.15 as part of turquoise wave 4. Within this zone, we anticipate price will reverse and resume its broader upward trend, eventually breaking through the $101.99 resistance. However, if Uber reverses course soon and breaks above the $101.99 mark without setting new lows, we would then expect a new high for turquoise wave alt.3 . We currently assign a 35% probability to such a delay in the ongoing upward impulse.

Uber Stock Faces Indecision After Earnings ReportDuring the last trading session, Uber’s stock fell more than 5.5%, as volatility increased following the release of the company’s quarterly earnings report.
Although revenue came in at $13.47 billion, slightly above expectations of $13.28 billion, and earnings per share (EPS) reached $3.11, the stock experienced strong selling pressure. This decline was mainly driven by the company’s announcement that rising costs and shrinking profit margins remain a concern — a trend that could persist in future reports. This outlook has fueled investor uncertainty, leaving the stock in a state of indecision.
Sideways Movement Gains Relevance
In recent weeks, Uber’s share price has formed a consistent sideways range, following the break of an upward trendline that had been in place for several months. The upper boundary of the channel remains near $100, while the lower boundary sits around $91.
Although recent selling activity has been dominant, it has not been strong enough to break the range, making this lateral structure the most relevant technical formation to monitor. As long as the price remains within this channel, market indecision is likely to persist over the coming sessions.
RSI
The RSI line hovers around the 50 level, reflecting neutral momentum between bullish and bearish forces, with no clear directional bias over the past 14 sessions. If the RSI continues to fluctuate near this zone, indecision may continue to reinforce the sideways pattern in the coming weeks.
MACD
The MACD histogram remains close to the zero line, indicating a lack of directional strength in short-term moving averages. This behavior aligns with the dominance of the current sideways channel, suggesting that the market could continue trading without a clear trend in the near term.
Key Levels to Watch:
$100 – Main Resistance:
Marks the top of the sideways range and serves as the most important psychological level. A sustained move above this zone could reactivate the previous bullish trend, which has been inactive for several weeks.
$95 – Intermediate Barrier:
Aligns with the 50-period simple moving average (SMA). If the price consolidates near this level, it could extend the sideways range in the coming sessions.
$91 – Main Support:
Represents the bottom of the lateral channel and aligns with the 23.6% Fibonacci retracement level. A break below this zone could trigger a new bearish trend in the short to medium term.
Written by Julian Pineda, CFA – Market Analyst

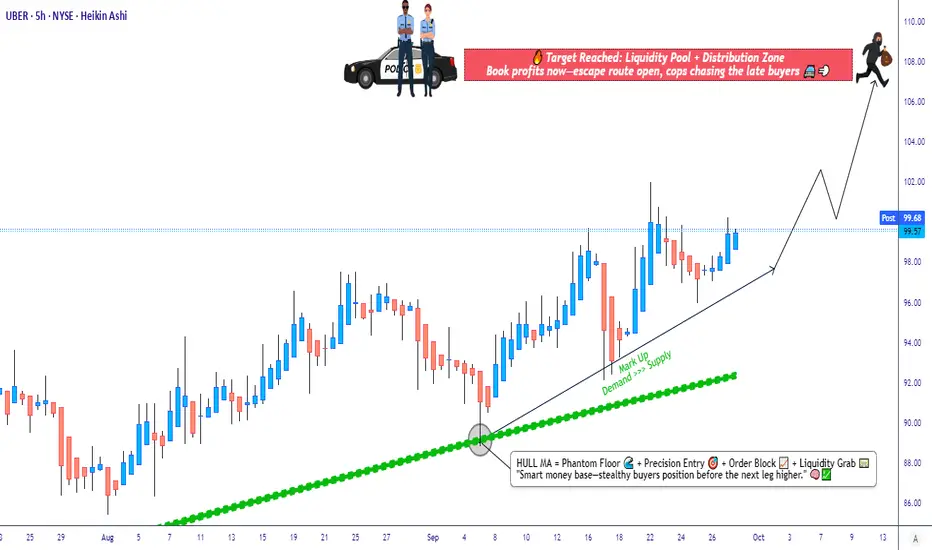
Uber Market Outlook – Swing Trade Opportunity on the Horizon🚖 UBER TECHNOLOGIES, INC — Market Wealth Strategy Map (Swing/Day Trade)
👋 Dear Ladies & Gentlemen (Thief OG’s), welcome to today’s Wealth Strategy Map on $UBER!
🔑 Game Plan (Thief Style)
Trend Bias → Bullish plan confirmed via Hull Moving Average pullback 📈
Entry (Layered Buy Strategy) → Using the Thief’s layering style (multiple buy-limit orders):
$96.00
$97.00
$98.00
$99.00
(You can add more layers if you want — it’s flexible by design) 🧩
Stop-Loss (SL) → $92.00 (📉 “Thief SL Zone”)
⚠️ Note: I’m not recommending you stick only to my SL — adjust based on your risk appetite.
Target (TP) → $108.00 (🚔 Police barricade zone = resistance + overbought trap!)
⚠️ Again, profit-taking is your choice — manage your exits wisely.
📊 Key Notes & Style
Hull MA pullback = Trend confirmation 🔒
Layering Strategy (Thief Style) = Scaling in with multiple limit orders instead of one big bite 🍕
Resistance @108.00 = Our “Escape Point” 🚁
Risk Management = Personal responsibility — don’t blindly copy!
🔗 Related Assets / Correlations
NASDAQ:LYFT (ridesharing peer) 🚗
NASDAQ:TSLA (EV demand + mobility trends) ⚡
NASDAQ:QQQ (tech-heavy index correlation) 📊
AMEX:SPY (broad market driver) 🌍
Watching these helps confirm broader tech + mobility sector sentiment.
✨ “If you find value in my analysis, a 👍 and 🚀 boost is much appreciated — it helps me share more setups with the community!”
⚠️ Disclaimer: This is a Thief Style Strategy shared for fun & educational purposes. Not financial advice. Trade at your own risk.
#UBER #StockMarket #SwingTrade #DayTrade #HullMovingAverage #ThiefStrategy #LayeringEntries #StockAnalysis #TradingCommunity
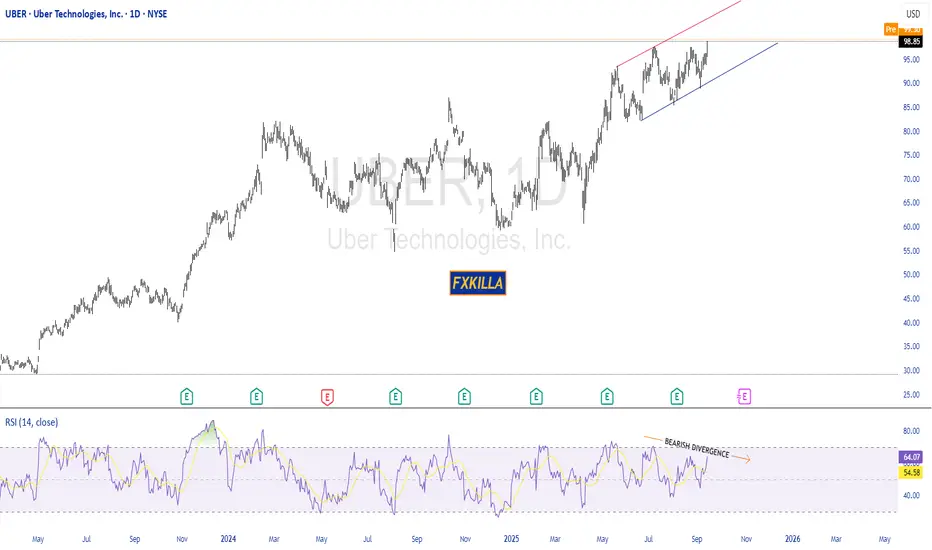
UBER HIGH PROBABILITY SETUP SOON!!!🚨 UBER HIGH PROBABILITY SELL SETUP 🚨
* Here We Can See Clearly The Next Potential Move For UBER Coming Hours/Days.
* Keep Your Eyes Close On Your Trading Positions.
* Happy PIP Hunting Traders.
FXKILLA.
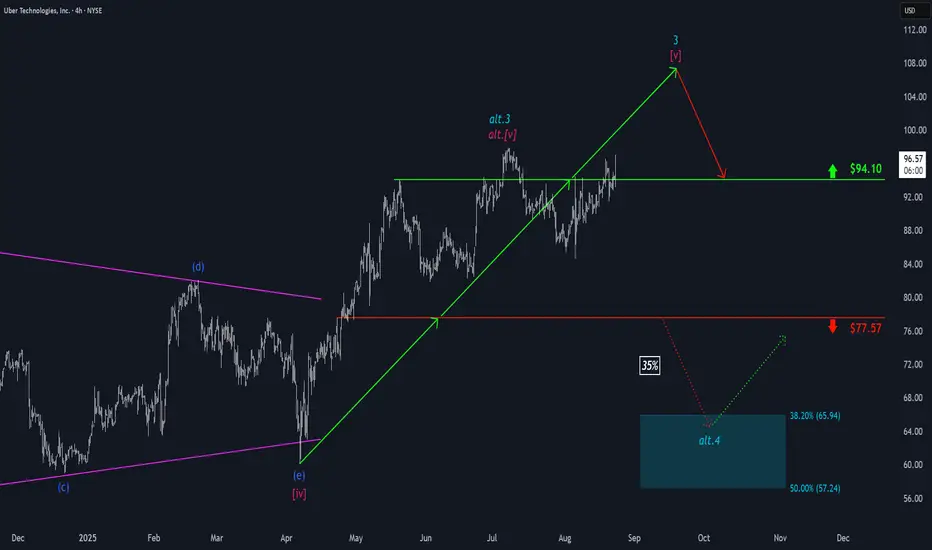
Uber: Another Run at $94.10 ResistanceUber has made another attempt to break through resistance at $94.10 – a move that was briefly successful – but persistent downward pressure prevented a sustained breakout. We still expect the stock to move decisively above the $94.10 level to establish the high of turquoise wave 3; only afterward do we anticipate a more significant pullback. However, there remains a 35% probability that Uber has already completed turquoise wave alt.3 with its highest peak above $94.10 so far, and could next decline into our turquoise alternative Target Zone between $65.94 and $57.24 during wave alt.4 .
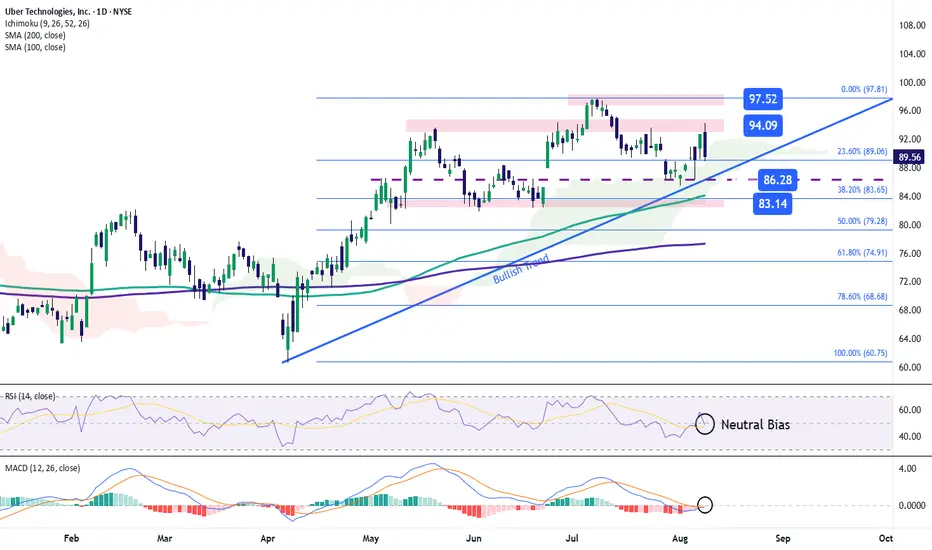
Uber Stock Fails to Hold Above $90Shortly after releasing earnings, Uber’s stock has continued to decline, posting a new drop of over 4% in the latest session, as selling pressure remains dominant in the short term. Although results were in line with expectations —with earnings per share at $0.63 and total revenue reaching $12.65 billion, compared to the expected $12.46 billion— investor sentiment has turned cautious. Doubts have emerged regarding the company's ability to sustain its growth pace, and concerns are rising over potential overspending on autonomous driving projects. These factors have weakened confidence in the stock, and as long as uncertainty persists, selling pressure may continue to build.
Uptrend Remains Intact… for Now
Since April 7, Uber’s stock has maintained a steady uptrend, which remains the dominant structure on the chart in the short term. While the recent downside correction has been notable, it has not yet been strong enough to clearly break the trend, so the long-term bias remains bullish for now. However, if bearish momentum strengthens, the integrity of this structure could begin to be challenged.
Indicators Show Neutral Momentum
Both the RSI line and the MACD histogram currently sit within a neutral zone, reflecting a lack of clear direction in the short term. If this setup persists, the recent sell-off may evolve into a more extended consolidation phase, with the price moving sideways until a new directional catalyst emerges.
Key Levels to Watch:
$94 – Key Resistance:
This level aligns with a neutral zone observed in recent weeks. If the price climbs back above this area, it could reactivate the current uptrend.
$86 – Short-Term Support:
This level forms the base of the uptrend line. If selling pressure continues, it could act as a key support. A break below it may reflect growing uncertainty and trigger a stronger bearish bias.
$83 – Critical Support:
This zone coincides with the 38.2% Fibonacci retracement level and the 100-period simple moving average. A sustained move below this point could terminate the prevailing bullish structure on the chart.
Written by Julian Pineda, CFA – Market Analyst
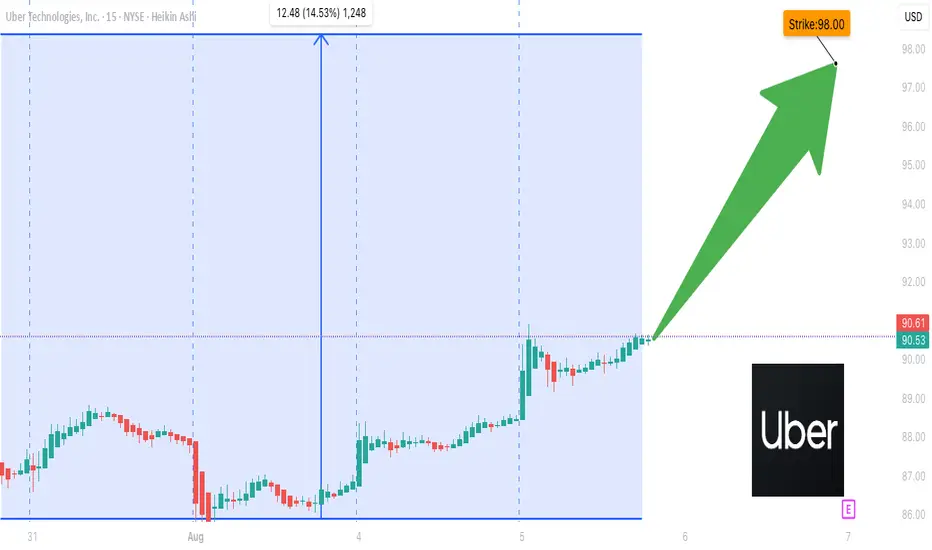
UBER Call Volume Explodes — $98C in Play Before Friday! **UBER \$98C 🚀 Call Volume Surges 3.2x – Weekly Bullish Breakout Brewing (3 DTE) 🔥**
---
### 📊 **Post Body (Optimized for TradingView):**
**UBER Weekly Call Play — Aug 8 Expiry (3 DTE)**
📈 **Sentiment Snapshot:**
* **Call/Put Ratio:** 3.22 — 🟢 Heavy bullish bias
* **Weekly RSI:** 57.6 and rising ✅
* **Volume:** 1.1x vs prior week — institutional demand confirmed
* **Daily RSI:** 42.8 — ⚠️ not yet bullish, but momentum maturing
* **Volatility (VIX):** <22 — favorable macro setup
* **Gamma Risk:** Moderate ⚠️
---
🧠 **Model Consensus Summary:**
* **All Models:** Bullish bias 🟢
* **Strike Preference:** \$98C favored by majority for best risk/reward
* **Confidence:** Avg. \~70%
* **Some Disagreement:** A few models prefer \$96C for safety 🎯
---
### 💡 **Trade Setup:**
* 🟢 **Option Type:** Buy CALL
* 🎯 **Strike:** \$98
* 💵 **Entry Price:** \$0.63
* 📅 **Expiry:** Aug 8 (3 DTE)
* 🎯 **Profit Target:** \$1.25 (\~98% return)
* 🛑 **Stop Loss:** \$0.30 (50% premium risk)
* ⏰ **Entry Timing:** Market Open
* 📈 **Confidence Level:** 70%
---
📍 **Key Risk Flags:**
* 🔻 Daily RSI <55 = potential short-term weakness
* 🕒 Only 3 days to expiry = high decay risk
* ⚠️ Watch \$92.35 resistance — reversal zone
* Monitor IV and gamma spikes
---
### 🧾 **Auto-Logger JSON (for tracking):**
```json
{
"instrument": "UBER",
"direction": "call",
"strike": 98.00,
"expiry": "2025-08-08",
"confidence": 0.70,
"profit_target": 1.25,
"stop_loss": 0.30,
"size": 1,
"entry_price": 0.63,
"entry_timing": "open",
"signal_publish_time": "2025-08-05 09:50:36 UTC-04:00"
}
```
---
### 🏷️ **Suggested Hashtags (TradingView Style):**
`#UBER #OptionsTrading #CallOptions #BullishSetup #TechStocks #WeeklyOptions #MomentumPlay #GammaSqueeze #StockAlerts #TradeSetup #UberOptions #InstitutionalFlow #ShortTermPlay`
Uber’s Path to $95+Uber Technologies (UBER) is positioning itself for long-term growth by expanding beyond its core ride-hailing and delivery businesses into advertising, travel, service partnerships, and autonomous vehicle (AV) technology. These strategic moves aim to diversify revenue streams and enhance operational efficiency.
Key Growth Drivers:
- Strong Core Business Performance – Uber continues to benefit from robust demand in both ride-hailing and delivery, generating significant economic profit.
- Artificial Intelligence Integration – AI plays a crucial role in optimizing pricing, reducing wait times, personalizing user experiences, and preventing fraud.
- Autonomous Vehicle Expansion – Uber is increasingly leveraging AV technology to reduce driver-related costs and scale its services.
- Strategic Investments – The company is using its strong cash flow to fund innovation, product development, acquisitions, and minority investments, driving long-term value.
- Capital-Efficient Growth – Uber’s ability to expand its service platform with minimal capital investment is expected to accelerate revenue growth and shareholder value creation.
Price Target & Options Flow:
Tigress Financial has raised Uber’s price target from $103 to $110, maintaining a Buy rating. Additionally, option flow on Uber is showing strong bullish activity, suggesting institutional interest. Given this momentum, Uber could potentially surpass $95 before August, especially if AV advancements and AI-driven efficiencies continue to strengthen its financial outlook

Uber: Upward Momentum ExpectedUber attempted to counter recent sell-offs with an upward move; however, downward pressure quickly resumed. We must still consider a 35% chance that the turquoise wave alt.3 has already concluded, which would imply direct declines below support at $77.57 during wave alt.4 . In this scenario, long entry opportunities could emerge within our alternative turquoise Target Zone between $65.94 and $57.24. Primarily, the regular wave 3 should reach its peak well above the $94.10 mark, and wave 4 would start later.
📈 Over 190 precise analyses, clear entry points, and defined Target Zones - that's what we do.

Uber: Topped out Already?Uber sold off sharply after topping out at $94.10 – thus, our short-term alternative scenario needs to be considered. In this view (35% probability), turquoise wave alt.3 has already concluded, and the stock is headed toward a pullback in wave alt.4 . That retracement would likely bottom in the turquoise Target Zone between $65.94 and $57.24 — a potential setup for long entries. The primary scenario remains more bullish: we expect a renewed push above $94.10 to complete the regular turquoise wave 3.
📈 Over 190 precise analyses, clear entry points, and defined Target Zones - that's what we do.

$UBER is HOTT! H5 Swing Trade with 10% Upside!NYSE:UBER is looking nice. Currently in it as a swing.
Undervalued and has been a holding up really well in this correction.
Markets get going next few weeks this name will get to $100 QUICK!
PTs: $82 / $85
WCB forming
Bullish H5_S indicator is bullish Cross
Volume Shelf Launch
Bull flag breakout!
Not financial advice.

UBER: Doesn't look DEAD to me...NYSE:UBER : Doesn't look DEAD to me...👀
Is Uber setting up for a parabolic move?! 🚀
Earnings Thursday:
EPS: .50c
Rev.: 11.76B
Rounded bottom measured move: $108 🎯
Not financial advice

Uber: ConsolidationThe rally that began at the turn of the year has recently transitioned into a phase of consolidation, leaving our primary outlook unchanged for now. During the magenta wave , we anticipate another pullback toward the support at $53.26, where the subsequent wave should begin. This wave should eventually propel the price beyond the resistance at $87, where we also expect the high of the broader turquoise wave 3. A premature breakout is also conceivable, given the extent of the current pullback. However, for this 30% likely alternative scenario to be confirmed, the stock would need to decisively breach the $87 mark.

Uber looking bullish July 11 2024Uber is looking bullish and can do 80+ as there is nothing to stop price at the top.

UBER up and downthis one is kinda iffy so trying to play it both ways for sure. upside first but once it rejects and we break down its gonna drop like a rock

UBER looking for retracementLooking for a small pop then drop down into 72ish. its fighting in this range but its just not gonna make it. Inverting the chart makes it easier to play the down side. just dont forget to undo the inversion like i did lol. retest of the imbalance then onto the box below.

Uber has engaged in a long short battleUber has engaged in a long short battle
This chart shows the weekly candle chart of Uber Company's stocks from the end of 2020 to the present. The top to bottom golden section of February 2021 is superimposed in the figure. As shown in the figure, the lowest point of Uber's stock in June 2022 hit the top to bottom golden ratio at 3.272. The low point in May this year and the high point in June are also the top to bottom golden ratio at 2.000 and 1.618, respectively! In the past 9 weeks, Uber's stock has engaged in a long short battle against the top of the chart against the 1.382 position in the golden section, without a clear choice of direction to break through!

UBER BUYHello, according to my analysis of the uber stock, there is a good buying opportunity. The stock has broken the upward channel. We also notice that the arrow is in an ascending direction as shown by the patchwork tool. good luck for everbody

UBER High Probability Bull Flag Here is a Macro break and retest weekly level with a Micro Bull flag below the 4h level showing us tomorrows move will most likely be bullish. Be cautious of bearish move/gap at open due to the high sell volume at close and be be patient for clear entry. Nothing is 100% in the markets.

UBER bull flag / triangleSimple bull flag on UBER. Day trade and/or small Swing trade. Use a % stop loss or last 10m candle before breakout @ green line . Trim majority at high and let runners run afterwards. Should go 100%+ if contracts are within a week of expiration.

UBER Uber Technologies Options Ahead of EarningsLooking at the UBER Uber Technologies options chain, i would buy the $31 strike price Calls with
2022-11-18 expiration date for about
$0.63 premium.
If the options turn out to be profitable Before the earnings release, i would sell at least 50%.
Looking forward to read your opinion about it.
