UBER STRONG: WHERE DOES IT STOP?UBER ABOVE IPO PRICE.
PRICE DISCOVERY NOW.
ECONOMIES RE-OPENING: BULLISH
Uberlong

UBER - Rising WedgeThis usually occurs when a security’s price has been rising over time
The trend lines drawn above and below the price chart pattern can converge to help a trader or analyst anticipate a breakout reversal. While price can be out of either trend line, wedge patterns have a tendency to break in the opposite direction from the trend lines.
Therefore, rising wedge patterns indicate the more likely potential of falling prices after a breakout of the lower trend line. Traders can make bearish trades after the breakout by selling the security short or using derivatives such as futures or options, depending on the security being charted. These trades would seek to profit on the potential that prices will fall.
You will learn the best place where we can trade this instrument at low risk.
Write in the comments all your questions and instruments analysis of which you want to see.
Friends, push the like button, write a comment, and share with your mates - that would be the best THANK YOU.
P.S. I personally will open entry if the price will show it according to my strategy.
Always make your analysis before a trade

Uber: Coffee! Watch out for continuation.It's been exactly 1 year -to the day- since I published the last analysis, so here is to the anniversary .
UBER saw a huge breakout after Weekly Lower Highs :
After the breakout, on the smaller timeframe now, we're building a nice C&H pattern with potential for bull continuation.
Fundamentals: Think about which companies got disproportionately punished by Covid, which under normal circumstances is a standard on your home screen?
=> As Chamath Palihapitiya put it nicely just recently: If you're not ready to invest in the companies on your home screen, then what else?

Uber (UBER): BUY at $40 - Elliot WaveUber (UBER) seems like is currently correcting at the 4th wave of its 5 wave structure, it's likely to correct to the 0.382 retracement level of its 3rd wave to $40 ish before UBER shoot up to its 5th wave target, also, we do have the previous pivot high at $40 as the support which was all the way from June. Thus, look for a correction to $40 ish and add for $55 ish target price, thanks.

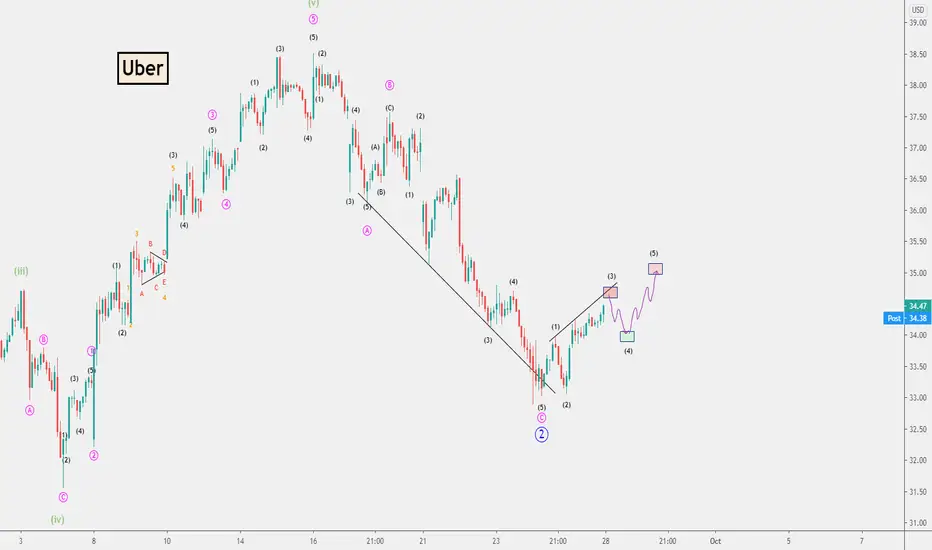
UBER Trade Update (3rd part scale in )Our UBER Leaps has gone ITM we are updating the current breakout pattern. To the minor time frame, a minor corrective wave (ii) into 41-43 level before UBER sets up for another run completing an impulsive 5 waves higher into 2021. Will be looking to establish more longs if UBER drops into 41 with some Leaps.
$UBER longs need to not fail in this res zone, hold the fib!Looking at $UBER we have made a significant long breakout of angular res but we really need to not fail in the same spot as last time. Hold the fib zone and keep the momentum hot and we should be approaching ATHs again.

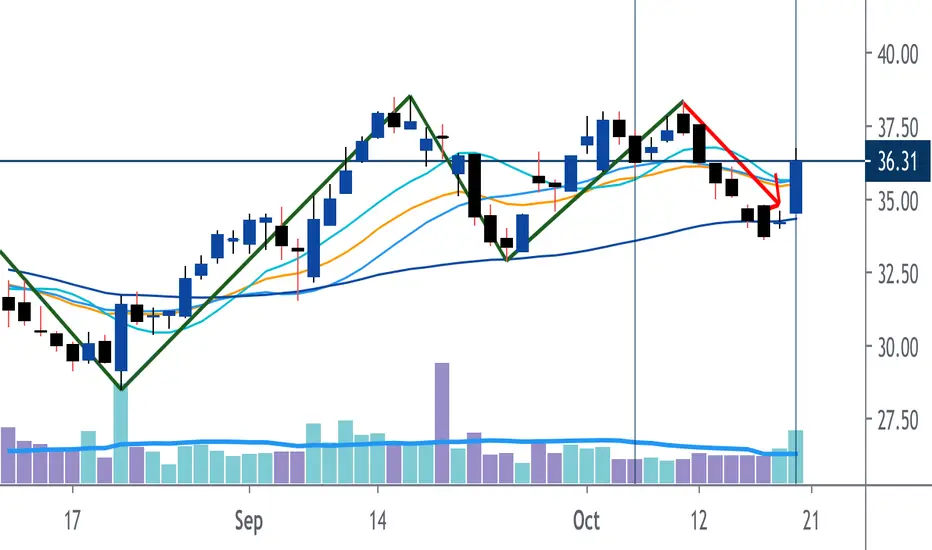
Uber: Bullish Pocket PivotBullish signal based on today’s closing price and volume.
Closing price was trending lower until today
Price closed higher than yesterday
Volume higher than previous 10 days
Price broke above 10 dma (cyan)
Price broke above 20 dma (blue)
Price bounced at about 50 dma (dark blue)
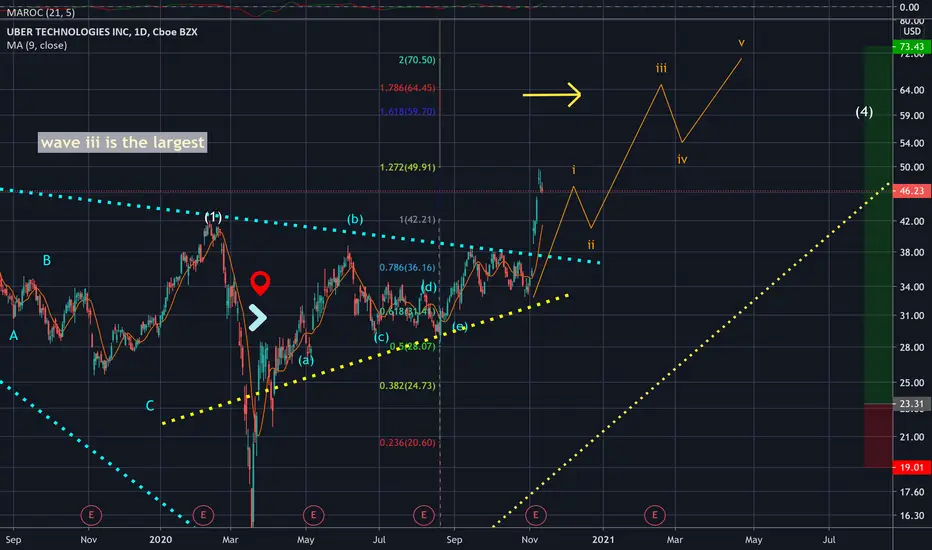
Uber Among UsMight be difficult for Uber fans to find this chart because I had to overlay Uber on a cryptocurrency chart to have the time scale include all days of the week.
Target price ranges between $63 and $90, but $66 is highly probably based on wedge, EW, and Fib as shown in chart.
Displayed in the chart is as follows:
Wyckoff accumulation contained by a wedge having a pink top trend line and blue bottom trend line. Each of three touches to both trend lines is indicated by a pink or blue vertical line as appropriate. The green vertical line indicates when price high confirmed breakout above the wedge. Note: price close and low has yet to confirm breakout. Therefore, one could argue that Uber remains in accumulation.
Elliott Wave leading diagonal wave 1 - bound by the orange channel, wave 2 - bound by the purple triangle, and part of a wave 3 that will likely be extended. So far, a lesser degree wave 1 and 2 have ended as well as a further lesser degree wave 1 and 2, indicated by the gold vertical line.
Fibonacci levels based on price at beginning and end of wave 1 (13.71 and 38.78)
Feel free to follow, like, and even donate TV cash!

Uber: View chart linked in descriptionView chart linked below. I don’t know how to force all days of the week on time scale so I charted Uber on a cryptocurrency chart.
Target price ranges between $63 and $90, but $66 is highly probable based on Wedge, EW, and Fib.

Uber: Trick or TreatDon’t fall for Uber’s trick, instead play nice and wait for it’s Treat. Yesterday, Uber didn’t gain like most of the market did. Instead, Uber faked a close under 20 DMA but bounced upwards right at close. That bounce coincides with a long term trend line that had been acting as resistance but now appears to act as support.
The pink vertical lines indicate bounces off the trend line by a high, low, open, or close price. If the trend line is valid support, then price could rally, slowly or quickly, to an ideal technical target price of $66. However, a more practical target price is closer to $54.
Like, follow, and let’s see what happens.

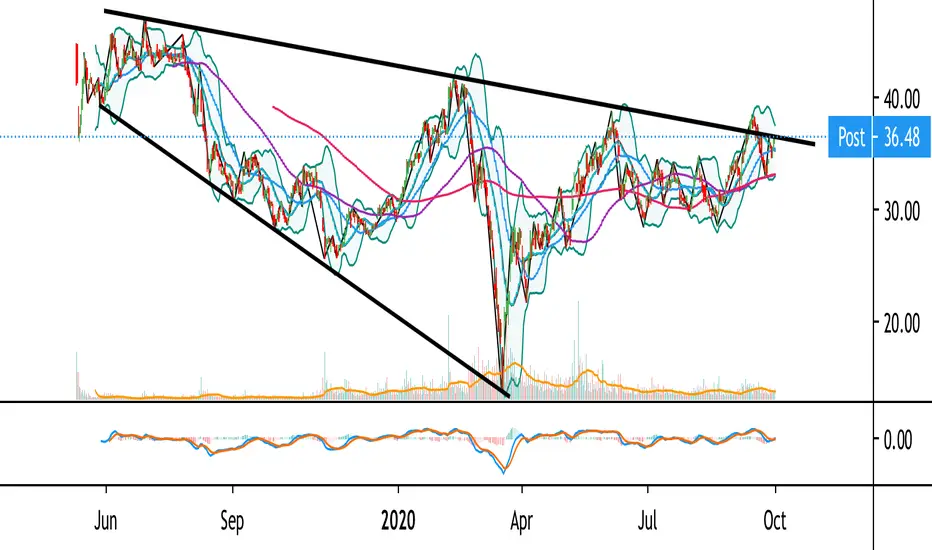
Uber centerfold: Doesn’t get sexier than this
10 20 50 and 100 DMAs
BB
macd
gaps
volume
... all confirming a possible breakout above the long-term wedge pattern.
Please wine and dine her first, gentlemen.

Uber: Be long not wrongAny chart that isn’t tracking this is wrong. Breakout confirmation can be closer to 36.65 but ~$37 is sufficient. Price will target 1.618 fib level if valid.

Uber: Correction is OverNYSE:UBER seems bullish after finishing its correction wave ( wave 2 blue ).
Here is a Buy Setup in Uber $UBERUber forming a nice wedge on the weekly.
I'll look to buy on a breakout to the upside.

UBER possible Positive DivergenceThere is a possible positive divergence on the 15 Mins chart for UBER, we need the confirmation of the resistance line on the RSI indicator. If the stock is able to break this resistance we can go LONG

Uber to Spike past $35 on Earnings Revenue Beat - Bullish $UBERTechnicals on all time frames look good to spike up post earnings. Bears that don't know about $UBER eats are going to get crushed. Profit miss and revenue beat will take this back up to $38 by September.

Uber Positive DivergenceThere is valid Positive Divergence in the 15 mins Chart for Uber.
Stop Loss at 29.72
Take Profit at 34.26
Be cautious because Uber is still on downtrend.


UBER LONG OR BUY , TARGET UP TO $40Uber confirmed pattern as "Flag" price increase, I bought here.
Uber buy : $32.50
Uber Target : $40 +-1
Uber Stop loss : 8%
Wish you good deals!

Uber 4hr outlookPT $34.80. We're making our way up to that trendline. it's a very key region. could also be a nice short if we reject the trendline.


😭 Sorry Guys... Kind Of Late On (UBER)💰 LET'S GET INTO SOME UBER ANALYSIS!💰
1️⃣ First off SMASH that LIKE BUTTON & Give us a FOLLOW for DAILY ANALYSIS! ❤❤❤
(Overall Market Sentiment) 🐻 Bearish
- Man I wish I would of had checked this one on the daily chart about a week ago. Beautiful crossover Crossover ema dots played out. No worries, let's catch the new wave!
- We are getting a red Crossover with an engulfing candle, this would good be a good short but we need to consider how close we are to support. I would rather look for the breakout on the 31.50 support to go short for most likely a 10-13% play to the next low.
- We so have one previous touch at 31.50 and rebounded but not by much! Let's see how it holds up. If it did hold and compressing with a green Crossover we will go long based off of the fact we did have that recent support.
- All 3 ema dots are firing red.
Drop your chart below in the comments section and share with us what you think will happen next! ❤❤❤
Thanks for checking out our analysis! ✌😁✌
🥇MLT | MAJOR LEAGUE TRADER
