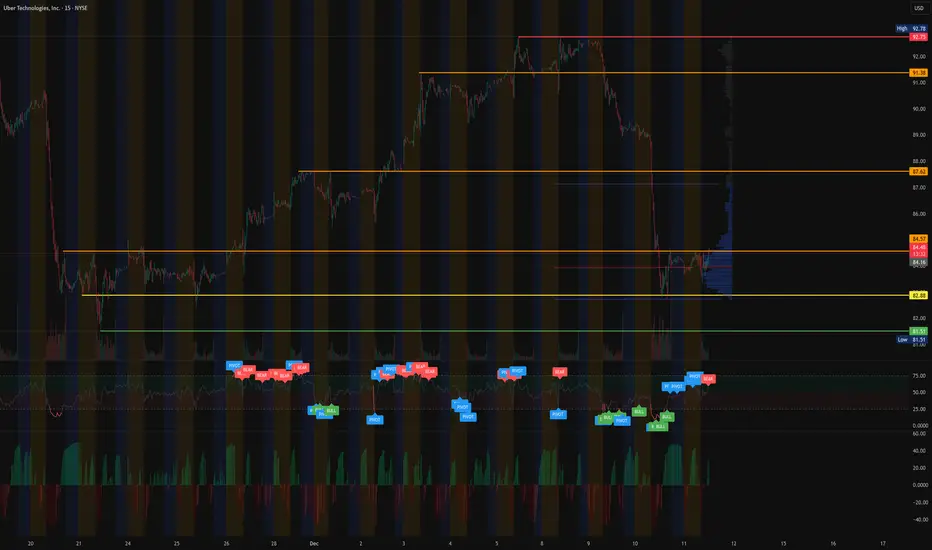
$UBER - Pullback To Key Support After Multi Week RallyUBER has pulled back into a major support zone at 82.88 after a strong run toward the recent highs near 92.75. Price is now consolidating at the lower end of this micro-range, holding above value-area support and attempting to stabilize after heavy selling pressure.
The chart shows a clear liquidity sweep below support followed by buyers stepping back in, which can be a constructive sign if momentum continues to shift upward.
We prefer the long setup closer to 82.88, where both structure and volume support align.
Technical Overview
Support Levels:
82.88 (primary support, ideal buy zone)
82.40 (local low)
81.51 (momentum failure level)
Resistance Levels:
84.57 (current ceiling and VWAP zone)
87.62 (value-area boundary)
91.38 (major supply zone)
92.75 (recent high)
Structure:
Strong prior uptrend followed by retracement
Consolidation forming above 82.88
Sideways corrective range with declining volume
Price trading inside high-volume node on VPVR
Momentum:
MACD histogram shifting toward neutral
RSI stabilizing after the flush
Buyers defending support consistently
Trend Bias:
Bullish as long as price holds above 82.88
Strongly bullish above 84.57
As long as UBER holds above 82.88, bulls maintain control over this retracement setup.
A reclaim and hold above 84.57 opens the door to 87.62, 91.38, and a potential retest of 92.75.
A breakdown below 81.51 signals failed momentum for this setup.
My Plan
Entry Zone: 82.88 to 83.25
Targets: 84.57, 87.62, 91.38
Stretch Target: 92.75
Invalidation: Close below 81.51
UBER remains in a bullish macro structure, and this pullback may offer one of the cleaner continuation entries if support holds.
Share your thoughts, and I will post an update if we confirm a breakout over 84.57.
#UBER #Stocks #MyMIWallet #TradeAlerts NASDAQ:LYFT NASDAQ:AMZN NASDAQ:GOOG
Ubertrend
Uber: Pulling BackUber has recently pushed higher toward resistance at $101.99 before pulling back noticeably from that level. This move aligns perfectly with our primary scenario, as we continue to expect a broader sell-off into the turquoise Target Zone between $68.29 and $59.15 as part of turquoise wave 4. Within this zone, we anticipate price will reverse and resume its broader upward trend, eventually breaking through the $101.99 resistance. However, if Uber reverses course soon and breaks above the $101.99 mark without setting new lows, we would then expect a new high for turquoise wave alt.3 . We currently assign a 35% probability to such a delay in the ongoing upward impulse.

Uber Stock Faces Indecision After Earnings ReportDuring the last trading session, Uber’s stock fell more than 5.5%, as volatility increased following the release of the company’s quarterly earnings report.
Although revenue came in at $13.47 billion, slightly above expectations of $13.28 billion, and earnings per share (EPS) reached $3.11, the stock experienced strong selling pressure. This decline was mainly driven by the company’s announcement that rising costs and shrinking profit margins remain a concern — a trend that could persist in future reports. This outlook has fueled investor uncertainty, leaving the stock in a state of indecision.
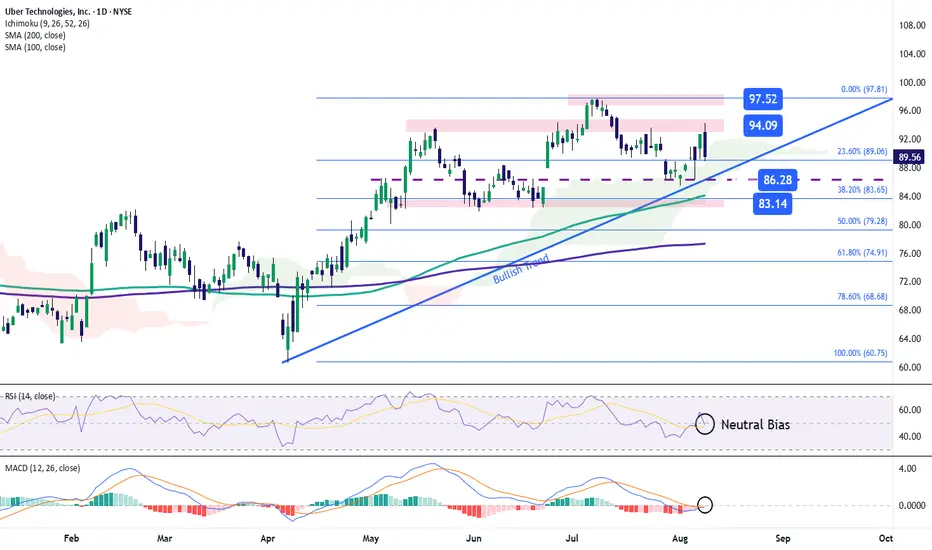
Sideways Movement Gains Relevance
In recent weeks, Uber’s share price has formed a consistent sideways range, following the break of an upward trendline that had been in place for several months. The upper boundary of the channel remains near $100, while the lower boundary sits around $91.
Although recent selling activity has been dominant, it has not been strong enough to break the range, making this lateral structure the most relevant technical formation to monitor. As long as the price remains within this channel, market indecision is likely to persist over the coming sessions.
RSI
The RSI line hovers around the 50 level, reflecting neutral momentum between bullish and bearish forces, with no clear directional bias over the past 14 sessions. If the RSI continues to fluctuate near this zone, indecision may continue to reinforce the sideways pattern in the coming weeks.
MACD
The MACD histogram remains close to the zero line, indicating a lack of directional strength in short-term moving averages. This behavior aligns with the dominance of the current sideways channel, suggesting that the market could continue trading without a clear trend in the near term.
Key Levels to Watch:
$100 – Main Resistance:
Marks the top of the sideways range and serves as the most important psychological level. A sustained move above this zone could reactivate the previous bullish trend, which has been inactive for several weeks.
$95 – Intermediate Barrier:
Aligns with the 50-period simple moving average (SMA). If the price consolidates near this level, it could extend the sideways range in the coming sessions.
$91 – Main Support:
Represents the bottom of the lateral channel and aligns with the 23.6% Fibonacci retracement level. A break below this zone could trigger a new bearish trend in the short to medium term.
Written by Julian Pineda, CFA – Market Analyst

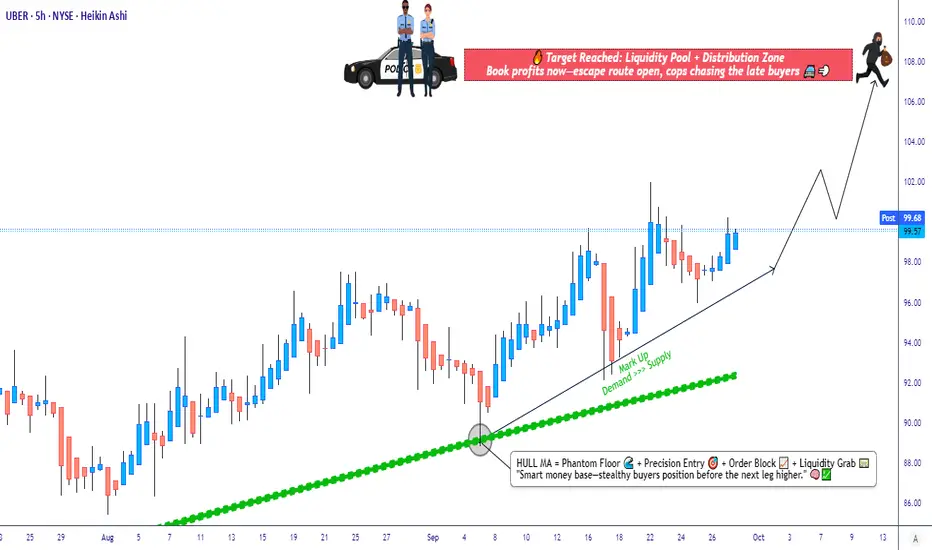
Uber Market Outlook – Swing Trade Opportunity on the Horizon🚖 UBER TECHNOLOGIES, INC — Market Wealth Strategy Map (Swing/Day Trade)
👋 Dear Ladies & Gentlemen (Thief OG’s), welcome to today’s Wealth Strategy Map on $UBER!
🔑 Game Plan (Thief Style)
Trend Bias → Bullish plan confirmed via Hull Moving Average pullback 📈
Entry (Layered Buy Strategy) → Using the Thief’s layering style (multiple buy-limit orders):
$96.00
$97.00
$98.00
$99.00
(You can add more layers if you want — it’s flexible by design) 🧩
Stop-Loss (SL) → $92.00 (📉 “Thief SL Zone”)
⚠️ Note: I’m not recommending you stick only to my SL — adjust based on your risk appetite.
Target (TP) → $108.00 (🚔 Police barricade zone = resistance + overbought trap!)
⚠️ Again, profit-taking is your choice — manage your exits wisely.
📊 Key Notes & Style
Hull MA pullback = Trend confirmation 🔒
Layering Strategy (Thief Style) = Scaling in with multiple limit orders instead of one big bite 🍕
Resistance @108.00 = Our “Escape Point” 🚁
Risk Management = Personal responsibility — don’t blindly copy!
🔗 Related Assets / Correlations
NASDAQ:LYFT (ridesharing peer) 🚗
NASDAQ:TSLA (EV demand + mobility trends) ⚡
NASDAQ:QQQ (tech-heavy index correlation) 📊
AMEX:SPY (broad market driver) 🌍
Watching these helps confirm broader tech + mobility sector sentiment.
✨ “If you find value in my analysis, a 👍 and 🚀 boost is much appreciated — it helps me share more setups with the community!”
⚠️ Disclaimer: This is a Thief Style Strategy shared for fun & educational purposes. Not financial advice. Trade at your own risk.
#UBER #StockMarket #SwingTrade #DayTrade #HullMovingAverage #ThiefStrategy #LayeringEntries #StockAnalysis #TradingCommunity
My view on UBERFrom the current structure, if the price broke below the trendline that has been supporting the recent move, I think Uber will likely head down to retest the highlighted support zone.
That move would also align with a potential test of the 200-day SMMA, creating a strong confluence level.
🎯 Conclusion: My bias turns bearish if the price breaks the trendline — in that case, I expect Uber to move into support while testing the 200 SMMA. Still, markets are unpredictable, and this remains only my view.
👉 For more structured market insights and professional analysis, follow along.

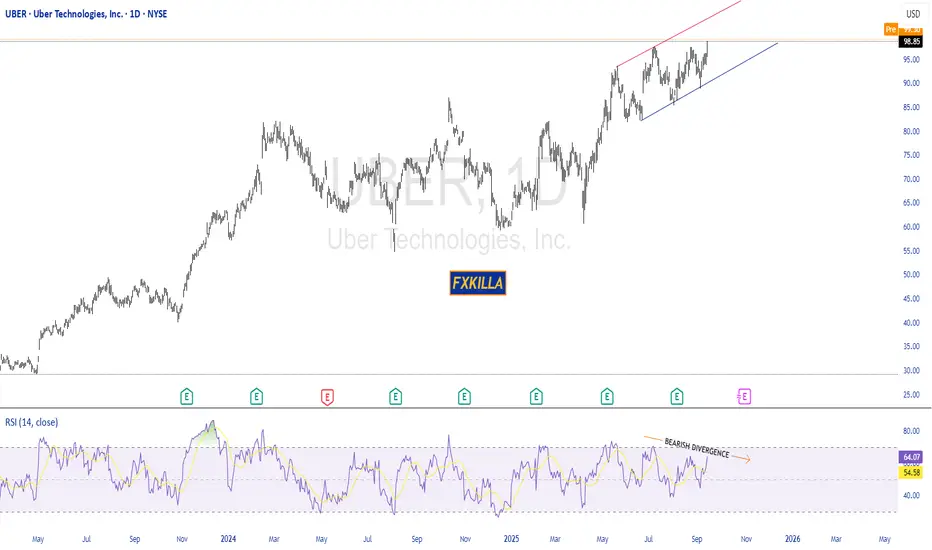
UBER HIGH PROBABILITY SETUP SOON!!!🚨 UBER HIGH PROBABILITY SELL SETUP 🚨
* Here We Can See Clearly The Next Potential Move For UBER Coming Hours/Days.
* Keep Your Eyes Close On Your Trading Positions.
* Happy PIP Hunting Traders.
FXKILLA.
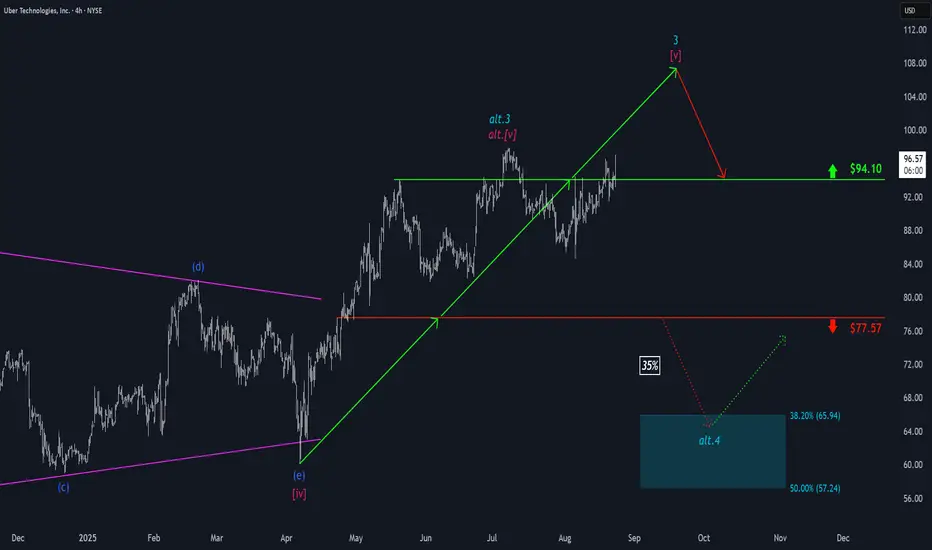
Uber: Another Run at $94.10 ResistanceUber has made another attempt to break through resistance at $94.10 – a move that was briefly successful – but persistent downward pressure prevented a sustained breakout. We still expect the stock to move decisively above the $94.10 level to establish the high of turquoise wave 3; only afterward do we anticipate a more significant pullback. However, there remains a 35% probability that Uber has already completed turquoise wave alt.3 with its highest peak above $94.10 so far, and could next decline into our turquoise alternative Target Zone between $65.94 and $57.24 during wave alt.4 .
Uber Stock Fails to Hold Above $90Shortly after releasing earnings, Uber’s stock has continued to decline, posting a new drop of over 4% in the latest session, as selling pressure remains dominant in the short term. Although results were in line with expectations —with earnings per share at $0.63 and total revenue reaching $12.65 billion, compared to the expected $12.46 billion— investor sentiment has turned cautious. Doubts have emerged regarding the company's ability to sustain its growth pace, and concerns are rising over potential overspending on autonomous driving projects. These factors have weakened confidence in the stock, and as long as uncertainty persists, selling pressure may continue to build.
Uptrend Remains Intact… for Now
Since April 7, Uber’s stock has maintained a steady uptrend, which remains the dominant structure on the chart in the short term. While the recent downside correction has been notable, it has not yet been strong enough to clearly break the trend, so the long-term bias remains bullish for now. However, if bearish momentum strengthens, the integrity of this structure could begin to be challenged.
Indicators Show Neutral Momentum
Both the RSI line and the MACD histogram currently sit within a neutral zone, reflecting a lack of clear direction in the short term. If this setup persists, the recent sell-off may evolve into a more extended consolidation phase, with the price moving sideways until a new directional catalyst emerges.
Key Levels to Watch:
$94 – Key Resistance:
This level aligns with a neutral zone observed in recent weeks. If the price climbs back above this area, it could reactivate the current uptrend.
$86 – Short-Term Support:
This level forms the base of the uptrend line. If selling pressure continues, it could act as a key support. A break below it may reflect growing uncertainty and trigger a stronger bearish bias.
$83 – Critical Support:
This zone coincides with the 38.2% Fibonacci retracement level and the 100-period simple moving average. A sustained move below this point could terminate the prevailing bullish structure on the chart.
Written by Julian Pineda, CFA – Market Analyst
Is This the Perfect Moment to Execute the UBER Heist?💰 UBER Stock Market Heist Blueprint 🚀
🌟 Hi! Hola! Ola! Bonjour! Hallo! Marhaba! 🌟
Dear Money Makers & Robbers, 🤑💰💸✈️
Here’s our grand plan: a 🔥Thief Trading Style heist🔥 targeting the UBER stock! Let’s break in with this cunning strategy — chart-ready and primed for action!
🎯 Entry:
The vault’s open! Grab the bullish loot at any price — the heist is live!
Tip: For precision, use a buy limit order on 15m/30m swing highs or lows — that’s your perfect pullback entry!
🛑 Stop Loss:
Thief SL is stashed at the nearest swing low (or just below the MA on the daily chart ~80.00 for swing trades).
Tailor SL to your trade risk, lot size, and your thieving gang’s order plan.
🏴☠️ Target:
100.00 — or vanish before hitting the target to avoid the traps of the overbought zone!
💎 The Setup:
We’re seeing bullishness fueled by key factors: macro moves, fundamentals, sentiment, intermarket trends… it’s all in play! 📈🔗🌏
Check the macro, COT report, sentiment outlook, and future trend targets to stay ahead of the game!
⚠️ Trading Alert:
News releases can flip the game fast.
Avoid fresh trades during major news.
Use trailing stops to lock in those juicy profits and protect your loot.
❤️🔥 Support the Heist Crew!
💥Hit the Boost Button💥 — fuel our robbery plans and let’s keep cashing in every day!
The Thief Trading Style: slick, powerful, and ready for the next heist.
See you soon with another plan, fellow robbers! 🤑🐱👤🤩

UBER: Doesn't look DEAD to me...NYSE:UBER : Doesn't look DEAD to me...👀
Is Uber setting up for a parabolic move?! 🚀
Earnings Thursday:
EPS: .50c
Rev.: 11.76B
Rounded bottom measured move: $108 🎯
Not financial advice

Uber Expands Waymo Driverless Rides to Austin and AtlantaUber Technologies Inc. (NYSE: NYSE:UBER ) is making waves in the ride-share and autonomous vehicle industries with its latest announcement to expand its partnership with Waymo, the self-driving car unit of Alphabet Inc. ( NASDAQ:GOOGL ). Starting early next year, Uber plans to bring driverless Waymo vehicles to Austin, Texas, and Atlanta, Georgia, as it continues to lead the shift toward autonomous mobility. Here's a closer look at Uber's fundamental developments and technical outlook following this major expansion news.
Expansion into New Markets
Uber’s partnership with Waymo will see the deployment of fully autonomous, all-electric Jaguar I-PACE vehicles in Austin and Atlanta. This follows the initial rollout in Phoenix, Arizona, where Uber has received positive feedback from riders. By managing and dispatching Waymo’s fleet, Uber aims to grow the number of driverless vehicles in these cities to hundreds over time, enhancing the ride-hailing experience and setting the stage for more widespread autonomous vehicle adoption.
Growing Partnerships
This partnership underscores Uber’s strategic pivot to leverage external autonomous technology providers instead of developing its own self-driving units, which it sold off in 2020. In addition to Waymo, Uber is collaborating with General Motors' Cruise, which will add its self-driving cars to the Uber platform next year. These partnerships align with Uber's broader goal of converting its fleet to green energy, enhancing sustainability while tapping into cutting-edge technologies.
Financial Impact and Market Response
Uber shares (NYSE: NYSE:UBER ) spiked 5% to $71.55 following the announcement, signaling investor optimism about the company’s future in autonomous ride-hailing. The expansion into Austin and Atlanta comes at a critical juncture for self-driving firms, which face regulatory scrutiny over safety concerns. However, Uber’s careful integration of Waymo’s proven technology could help mitigate these challenges.
Uber’s stock performance has been strong this year, with shares climbing over 16%. This growth reflects confidence in Uber’s adaptability and future earnings potential, as it continues to diversify its services and expand its market reach.
Technical Outlook
Technically, Uber stock (NYSE: NYSE:UBER ) shows strong momentum, with the price trading above key moving averages—the 50-day, 100-day, and 200-day MAs. This alignment suggests a sustained bullish trend, reinforcing positive sentiment among investors. The Relative Strength Index (RSI) is at 54.35, indicating the stock is neither overbought nor oversold, leaving room for potential upward movement.
Key Support and Resistance Levels
Uber’s current support level lies around the $67 mark, a crucial pivot point that has acted as a foundation for recent gains. A dip below this level could trigger a pullback towards the one-month low of $54, corresponding with the December 2020 pivot. Investors should watch this level closely, as a breach could lead to a deeper correction.
On the upside, resistance is likely to be tested around $75, a key psychological and technical barrier. Breaking above this level could see the stock target new highs as Uber (NYSE: NYSE:UBER ) continues to benefit from its autonomous vehicle strategy and market expansion.
Investor Outlook
Uber’s expanding partnerships in autonomous driving position it well for future growth in the ride-hailing sector, where innovation and technology integration are paramount. The positive technical indicators and supportive fundamental backdrop create a favorable environment for potential gains. However, investors should remain vigilant to key support levels and broader market conditions, which could impact Uber’s stock performance in the near term.
Conclusion
Uber’s commitment to scaling its driverless car offerings through partnerships with Waymo and other autonomous vehicle providers marks a significant step in its evolution. As the company expands into new markets and enhances its technology offerings, Uber is poised to solidify its position at the forefront of the ride-sharing and autonomous mobility revolution. With promising technical signals and robust market strategies, Uber remains a compelling stock to watch in the autonomous vehicle space.

Uber has engaged in a long short battleUber has engaged in a long short battle
This chart shows the weekly candle chart of Uber Company's stocks from the end of 2020 to the present. The top to bottom golden section of February 2021 is superimposed in the figure. As shown in the figure, the lowest point of Uber's stock in June 2022 hit the top to bottom golden ratio at 3.272. The low point in May this year and the high point in June are also the top to bottom golden ratio at 2.000 and 1.618, respectively! In the past 9 weeks, Uber's stock has engaged in a long short battle against the top of the chart against the 1.382 position in the golden section, without a clear choice of direction to break through!

UBER BUYHello, according to my analysis of the uber stock, there is a good buying opportunity. The stock has broken the upward channel. We also notice that the arrow is in an ascending direction as shown by the patchwork tool. good luck for everbody

Uber Long -- Expecting bull expectation for next quarter? Currently, Uber is looking bull and ready to pick direction. Most likely upwards towards $29/31/33.
Observe later this week for more movements to decide direction.
If earning /forecast not good, could go downtrend towards $21.60/70 for support.

UBER Might See More Downsides UBER has provided us with a nice curved trend line (in white) with the last touch going to be aligned with 2.618 which is comparable to a previous drop in 2020
Interesting daily chart

Uber Technologies: downtrend on the wayAlthough it's true investors are buying around these levels, the price keeps falling around the downtrend channel. Good buying opportunities are found on the lower part of the channel. It's a good opportunity for a buy-and-hold strategy, but the incoming FED intervention on interest rates hikes could pose a tremendous risk on the short term in all stocks, so care with volume. In terms of fundamentals, Uber has improved a lot and reduced losses considerably, financial and operational results were positive this last Q, way better than those of 2020. The best strategy is to buy the dip. So analyze the financial results of 2021, compare it to 2019 and 2020 and place your bets! I'm pretty sure this one is gonna perform really well in the coming years, but it's all about timing. If indices fall, we will find a great opportunity on this one!

Missed the UBER IPO? You can buy it for less nowUBER Q4 report:
earnings of 44 cents per share VS expected -33 cents
$5.78 billion VS $5.39 billion expected.
Q4 Gross Bookings outpaced expectations
Delivery and Trips came up a tad short estimates.
Freight $1.08 billion VS $807.8 million expected.
My price target for this quarter is the IPO price, $45.
Looking forward to read your opinion about it.

Uber Analysis 30.01.2022Hello Traders,
welcome to this free and educational analysis.
I am going to explain where I think this asset is going to go over the next few days and weeks and where I would look for trading opportunities.
If you have any questions or suggestions which asset I should analyse tomorrow, please leave a comment below.
I will personally reply to every single comment!
If you enjoyed this analysis, I would definitely appreciate it, if you smash that like button and maybe consider following my channel.
Thank you for watching and I will see you tomorrow!

Uber : Wait for a moment to buyIn daily the trend is still bearish but there are goods signs to change this trend.but for me it is not yet a moment to buy and I suggest to wait for the breaking by the price the SSB (46,26) and the chinkou cross the cloud

UBER Daily TimeframeSNIPER STRATEGY
This magical strategy works like a clock on almost any charts
Although I have to say it can’t predict pullbacks, so I do not suggest this strategy for leverage trading.
It will not give you the whole wave like any other strategy out there but it will give you huge part of the wave.
The best timeframe for this strategy is Daily, Weekly and Monthly however it can work any timeframe above three minutes.
Start believing in this strategy because it will reward believers with huge profit.
There is a lot more about this strategy.
It can predict and also it can give you almost exact buy or sell time on the spot.
I am developing it even more so stay tuned and start to follow me for more signals and forecasts.

UBER Price targetThe head and shoulders pattern is one of the most reliable trend reversal patterns.
After a Head and Shoulder chart pattern, UBER will now most likely test and bounce from the 38.80usd resistance that turned into support.
I`m looking forward to read your opinion about it.

UBERUber (NYSE:UBER) is starting to show some strength with high volume upsides and closed back above its EMA200 on the 4H chart at 51.52. With no resistance between $52.4 and $56.13, a break above the $52.36 level can see the stock trade in the $55 area pretty soon. Have this on your watchlist.

UBER - Buy The Dip Hi, this is my update for UBER. In the last 3 days UBER has fallen more than 20%, we have lost the SMA50 and SMA100, but I think we have now reached the bottom, since we have support level around $45.90, SMA200 (46.74) and RSI is now under 30 so that means that UBER is oversold and it is time for shorts to cover in. So be prepared and don't PANIC ;)
