FTSE100 corrective pullback support at 9917The FTSE remains in a bullish trend, with recent price action showing signs of a breakout within the broader uptrend.
Support Zone: 9917 – a key level from previous consolidation. Price is currently testing or approaching this level.
A bullish rebound from 9917 would confirm ongoing upside momentum, with potential targets at:
10000 – initial resistance
10050 – psychological and structural level
10080 – extended resistance on the longer-term chart
Bearish Scenario:
A confirmed break and daily close below 9917 would weaken the bullish outlook and suggest deeper downside risk toward:
9900 – minor support
9865 – stronger support and potential demand zone
Outlook:
Bullish bias remains intact while the FTSE holds above 9917. A sustained break below this level could shift momentum to the downside in the short term.
This communication is for informational purposes only and should not be viewed as any form of recommendation as to a particular course of action or as investment advice. It is not intended as an offer or solicitation for the purchase or sale of any financial instrument or as an official confirmation of any transaction. Opinions, estimates and assumptions expressed herein are made as of the date of this communication and are subject to change without notice. This communication has been prepared based upon information, including market prices, data and other information, believed to be reliable; however, Trade Nation does not warrant its completeness or accuracy. All market prices and market data contained in or attached to this communication are indicative and subject to change without notice.
UK100 CFD

FTSE100 Bullish breakout supported at 9917The FTSE remains in a bullish trend, with recent price action showing signs of a breakout within the broader uptrend.
Support Zone: 9917 – a key level from previous consolidation. Price is currently testing or approaching this level.
A bullish rebound from 9917 would confirm ongoing upside momentum, with potential targets at:
10000 – initial resistance
10050 – psychological and structural level
10080 – extended resistance on the longer-term chart
Bearish Scenario:
A confirmed break and daily close below 9917 would weaken the bullish outlook and suggest deeper downside risk toward:
9900 – minor support
9865 – stronger support and potential demand zone
Outlook:
Bullish bias remains intact while the FTSE holds above 9917. A sustained break below this level could shift momentum to the downside in the short term.
This communication is for informational purposes only and should not be viewed as any form of recommendation as to a particular course of action or as investment advice. It is not intended as an offer or solicitation for the purchase or sale of any financial instrument or as an official confirmation of any transaction. Opinions, estimates and assumptions expressed herein are made as of the date of this communication and are subject to change without notice. This communication has been prepared based upon information, including market prices, data and other information, believed to be reliable; however, Trade Nation does not warrant its completeness or accuracy. All market prices and market data contained in or attached to this communication are indicative and subject to change without notice.

UK100 H4 | Bullish BreakoutThe price is falling towards our buy entry level at 9,923.57, which is an overlap support.
Our stop loss is set at 9,832.64, which is an overlap support.
Our take profit is set at 10,059.96, which aligns with the 61.8% Fibonacci projection.
High Risk Investment Warning
Stratos Markets Limited (

FTSE Bullish continuation supported at 9865FTSE oversold rally resistance at 8820
The FTSE remains in a bullish trend, with recent price action showing signs of a breakout within the broader uptrend.
Support Zone: 9865 – a key level from previous consolidation. Price is currently testing or approaching this level.
A bullish rebound from 9865 would confirm ongoing upside momentum, with potential targets at:
9976 – initial resistance
1000 – psychological and structural level
1050 – extended resistance on the longer-term chart
Bearish Scenario:
A confirmed break and daily close below 9865 would weaken the bullish outlook and suggest deeper downside risk toward:
9830 – minor support
9792 – stronger support and potential demand zone
Outlook:
Bullish bias remains intact while the FTSE holds above 9865. A sustained break below this level could shift momentum to the downside in the short term.
This communication is for informational purposes only and should not be viewed as any form of recommendation as to a particular course of action or as investment advice. It is not intended as an offer or solicitation for the purchase or sale of any financial instrument or as an official confirmation of any transaction. Opinions, estimates and assumptions expressed herein are made as of the date of this communication and are subject to change without notice. This communication has been prepared based upon information, including market prices, data and other information, believed to be reliable; however, Trade Nation does not warrant its completeness or accuracy. All market prices and market data contained in or attached to this communication are indicative and subject to change without notice.

FTSE sideways consolidation capped by resistance at 9900The FTSE remains in a bullish trend, with recent price action showing signs of a breakout within the broader uptrend.
Support Zone: 9750 – a key level from previous consolidation. Price is currently testing or approaching this level.
A bullish rebound from 9750 would confirm ongoing upside momentum, with potential targets at:
9900 – initial resistance
9930 – psychological and structural level
9960 – extended resistance on the longer-term chart
Bearish Scenario:
A confirmed break and daily close below 9750 would weaken the bullish outlook and suggest deeper downside risk toward:
9713 – minor support
9680 – stronger support and potential demand zone
Outlook:
Bullish bias remains intact while the FTSE holds above 9750. A sustained break below this level could shift momentum to the downside in the short term.
This communication is for informational purposes only and should not be viewed as any form of recommendation as to a particular course of action or as investment advice. It is not intended as an offer or solicitation for the purchase or sale of any financial instrument or as an official confirmation of any transaction. Opinions, estimates and assumptions expressed herein are made as of the date of this communication and are subject to change without notice. This communication has been prepared based upon information, including market prices, data and other information, believed to be reliable; however, Trade Nation does not warrant its completeness or accuracy. All market prices and market data contained in or attached to this communication are indicative and subject to change without notice.

UK100 H4 | Bearish Reversal Off Swing HighMomentum: Bullish
The price is reacting off the sell entry, which has been identified as a swing high resistance.
Sell entry: 9,925.36
Swing high resistance
78.6% Fibonacci retraceent
Stop loss: 10,011.21
61.8% Fibonaccc projection
Take profit: 9,800.41
Pullback support
50% Fibonacci retracement
High Risk Investment Warning
Stratos Markets Limited (tradu.com ), Stratos Europe Ltd (tradu.com ):
CFDs are complex instruments and come with a high risk of losing money rapidly due to leverage. 70% of retail investor accounts lose money when trading CFDs with this provider. You should consider whether you understand how CFDs work and whether you can afford to take the high risk of losing your money.
Stratos Global LLC (tradu.com ): Losses can exceed deposits.
Please be advised that the information presented on TradingView is provided to Tradu (‘Company’, ‘we’) by a third-party provider (‘TFA Global Pte Ltd’). Please be reminded that you are solely responsible for the trading decisions on your account. Any information and/or content is intended entirely for research, educational and informational purposes only and does not constitute investment or consultation advice or investment strategy. The information is not tailored to the investment needs of any specific person and therefore does not involve a consideration of any of the investment objectives, financial situation or needs of any viewer that may receive it. Past performance is not a reliable indicator of future results. Actual results may differ materially from those anticipated in forward-looking or past performance statements. We assume no liability as to the accuracy or completeness of any of the information and/or content provided herein and the Company cannot be held responsible for any omission, mistake nor for any loss or damage including without limitation to any loss of profit which may arise from reliance on any information supplied by TFA Global Pte Ltd.

UK100 H1 | Bullish Continuation Off Key SupportMomentum: Bullish
Price is currently above the ichimoku cloud.
Buy entry: 9,854.60
- Overlap support
- 38.2% Fib retracement
- 78.6% Fib projection
Stop Loss: 9,802.65
- Overlap support
Take Profit: 9,936.63
- Swing high resistance
High Risk Investment Warning
Stratos Markets Limited (tradu.com/uk ), Stratos Europe Ltd (tradu.com/eu ):
CFDs are complex instruments and come with a high risk of losing money rapidly due to leverage. 70% of retail investor accounts lose money when trading CFDs with this provider. You should consider whether you understand how CFDs work and whether you can afford to take the high risk of losing your money.
Stratos Global LLC (tradu.com/en ): Losses can exceed deposits.
Please be advised that the information presented on TradingView is provided to Tradu (‘Company’, ‘we’) by a third-party provider (‘TFA Global Pte Ltd’). Please be reminded that you are solely responsible for the trading decisions on your account. Any information and/or content is intended entirely for research, educational and informational purposes only and does not constitute investment or consultation advice or investment strategy. The information is not tailored to the investment needs of any specific person and therefore does not involve a consideration of any of the investment objectives, financial situation or needs of any viewer that may receive it. Past performance is not a reliable indicator of future results. Actual results may differ materially from those anticipated in forward-looking or past performance statements. We assume no liability as to the accuracy or completeness of any of the information and/or content provided herein and the Company cannot be held responsible for any omission, mistake nor for any loss or damage including without limitation to any loss of profit which may arise from reliance on any information supplied by TFA Global Pte Ltd.

FTSE Corrective pullback support at 9750The FTSE remains in a bullish trend, with recent price action showing signs of a breakout within the broader uptrend.
Support Zone: 9750 – a key level from previous consolidation. Price is currently testing or approaching this level.
A bullish rebound from 9750 would confirm ongoing upside momentum, with potential targets at:
9900 – initial resistance
9930 – psychological and structural level
9960 – extended resistance on the longer-term chart
Bearish Scenario:
A confirmed break and daily close below 9750 would weaken the bullish outlook and suggest deeper downside risk toward:
9713 – minor support
9680 – stronger support and potential demand zone
Outlook:
Bullish bias remains intact while the FTSE holds above 9750. A sustained break below this level could shift momentum to the downside in the short term.
This communication is for informational purposes only and should not be viewed as any form of recommendation as to a particular course of action or as investment advice. It is not intended as an offer or solicitation for the purchase or sale of any financial instrument or as an official confirmation of any transaction. Opinions, estimates and assumptions expressed herein are made as of the date of this communication and are subject to change without notice. This communication has been prepared based upon information, including market prices, data and other information, believed to be reliable; however, Trade Nation does not warrant its completeness or accuracy. All market prices and market data contained in or attached to this communication are indicative and subject to change without notice.

UK100 H1 | Bearish Reversal Off ResistanceMomentum: Bearish
Price is currently above the ichimoku cloud, however, we could look for a bearish reversal at the all time swing high.
Sell entry: 9,939.85
- Swing high resistance
- 100% Fib projection
- 161.8% Fib extension
Stop Loss: 9,983.79
Take Profit: 9,873.80
- Pullback support
High Risk Investment Warning
Stratos Markets Limited (tradu.com/uk ), Stratos Europe Ltd (tradu.com/eu ):
CFDs are complex instruments and come with a high risk of losing money rapidly due to leverage. 70% of retail investor accounts lose money when trading CFDs with this provider. You should consider whether you understand how CFDs work and whether you can afford to take the high risk of losing your money.
Stratos Global LLC (tradu.com/en ): Losses can exceed deposits.
Please be advised that the information presented on TradingView is provided to Tradu (‘Company’, ‘we’) by a third-party provider (‘TFA Global Pte Ltd’). Please be reminded that you are solely responsible for the trading decisions on your account. Any information and/or content is intended entirely for research, educational and informational purposes only and does not constitute investment or consultation advice or investment strategy. The information is not tailored to the investment needs of any specific person and therefore does not involve a consideration of any of the investment objectives, financial situation or needs of any viewer that may receive it. Past performance is not a reliable indicator of future results. Actual results may differ materially from those anticipated in forward-looking or past performance statements. We assume no liability as to the accuracy or completeness of any of the information and/or content provided herein and the Company cannot be held responsible for any omission, mistake nor for any loss or damage including without limitation to any loss of profit which may arise from reliance on any information supplied by TFA Global Pte Ltd.

FTSE Bullish sideways consolidation supported at 9750The FTSE remains in a bullish trend, with recent price action showing signs of a breakout within the broader uptrend.
Support Zone: 9750 – a key level from previous consolidation. Price is currently testing or approaching this level.
A bullish rebound from 9750 would confirm ongoing upside momentum, with potential targets at:
9900 – initial resistance
9930 – psychological and structural level
9960 – extended resistance on the longer-term chart
Bearish Scenario:
A confirmed break and daily close below 9750 would weaken the bullish outlook and suggest deeper downside risk toward:
9713 – minor support
9680 – stronger support and potential demand zone
Outlook:
Bullish bias remains intact while the FTSE holds above 9750. A sustained break below this level could shift momentum to the downside in the short term.
This communication is for informational purposes only and should not be viewed as any form of recommendation as to a particular course of action or as investment advice. It is not intended as an offer or solicitation for the purchase or sale of any financial instrument or as an official confirmation of any transaction. Opinions, estimates and assumptions expressed herein are made as of the date of this communication and are subject to change without notice. This communication has been prepared based upon information, including market prices, data and other information, believed to be reliable; however, Trade Nation does not warrant its completeness or accuracy. All market prices and market data contained in or attached to this communication are indicative and subject to change without notice.

UK100 Ready for 10,000? Bullish Swing Setup Explained🔹 UK100 (FTSE 100) Index — Swing Trade Opportunity Guide
Asset: UK100 Index
Market Type: Indices
Trade Style: Swing Trade
📊 Market Bias
Trend Direction: 🟢 Bullish
Bullish structure confirmed with a HULL Moving Average + Triangular Moving Average pullback, indicating trend continuation after healthy retracement.
🎯 Trade Plan
Strategy: Trend-following pullback continuation
Entry Plan:
👉 Any price level entry allowed
👉 Layered entry approach (Thief Layering Strategy)
Buy Limit Layer Zones:
• 9700
• 9750
• 9800
(You may increase or adjust layers based on your own risk plan)
This layered approach helps optimize average entry during volatility without chasing price.
🛑 Risk Management
Stop Loss: 9650
⚠️ Dear Ladies & Gentlemen (Thief OG’s),
This stop loss is not mandatory. Adjust SL according to your personal risk management and strategy rules.
🎯 Profit Plan
Primary Target: 10000
📌 Reasoning:
• Strong resistance zone
• Overbought conditions expected
• Potential trap & corrective reaction near highs
⚠️ Dear Ladies & Gentlemen (Thief OG’s),
This TP is for guidance only. Partial profits and manual exits are encouraged based on price action.
🔗 Related Markets to Watch (Correlation Guide)
💵 USD Index (DXY)
• Weakness in DXY often supports global equity indices
• Risk-on sentiment favors UK100 upside continuation
🇺🇸 US30 / NAS100
• Strong US indices usually provide positive sentiment spillover
• Bullish continuation in US equities supports FTSE strength
🛢️ Brent Crude (UKOIL)
• UK100 has heavy energy exposure
• Rising oil prices can boost FTSE components
🏦 GBP/USD
• Extreme GBP strength may cap FTSE upside
• Mild GBP weakness is generally supportive for UK exporters
🧠 Final Notes
✔ Trend-following setup
✔ Layered risk-controlled entries
✔ Structure-based SL
✔ Resistance-aware profit planning
📌 Trade smart. Manage risk. Let the trend pay.

FTSE Bullish breakout supported at 9750
The FTSE remains in a bullish trend, with recent price action showing signs of a breakout within the broader uptrend.
Support Zone: 9750 – a key level from previous consolidation. Price is currently testing or approaching this level.
A bullish rebound from 9750 would confirm ongoing upside momentum, with potential targets at:
9900 – initial resistance
9930 – psychological and structural level
9960 – extended resistance on the longer-term chart
Bearish Scenario:
A confirmed break and daily close below 9750 would weaken the bullish outlook and suggest deeper downside risk toward:
9713 – minor support
9680 – stronger support and potential demand zone
Outlook:
Bullish bias remains intact while the FTSE holds above 9750. A sustained break below this level could shift momentum to the downside in the short term.
This communication is for informational purposes only and should not be viewed as any form of recommendation as to a particular course of action or as investment advice. It is not intended as an offer or solicitation for the purchase or sale of any financial instrument or as an official confirmation of any transaction. Opinions, estimates and assumptions expressed herein are made as of the date of this communication and are subject to change without notice. This communication has been prepared based upon information, including market prices, data and other information, believed to be reliable; however, Trade Nation does not warrant its completeness or accuracy. All market prices and market data contained in or attached to this communication are indicative and subject to change without notice.

FTSE 100 Support retest followed by a breakout The FTSE remains in a bullish trend, with recent price action showing signs of a breakout within the broader uptrend.
Support Zone: 9665 – a key level from previous consolidation. Price is currently testing or approaching this level.
A bullish rebound from 9665 would confirm ongoing upside momentum, with potential targets at:
9775 – initial resistance
9806 – psychological and structural level
9850 – extended resistance on the longer-term chart
Bearish Scenario:
A confirmed break and daily close below 9665 would weaken the bullish outlook and suggest deeper downside risk toward:
9630 – minor support
9598 – stronger support and potential demand zone
Outlook:
Bullish bias remains intact while the FTSE holds above 9665. A sustained break below this level could shift momentum to the downside in the short term.
This communication is for informational purposes only and should not be viewed as any form of recommendation as to a particular course of action or as investment advice. It is not intended as an offer or solicitation for the purchase or sale of any financial instrument or as an official confirmation of any transaction. Opinions, estimates and assumptions expressed herein are made as of the date of this communication and are subject to change without notice. This communication has been prepared based upon information, including market prices, data and other information, believed to be reliable; however, Trade Nation does not warrant its completeness or accuracy. All market prices and market data contained in or attached to this communication are indicative and subject to change without notice.

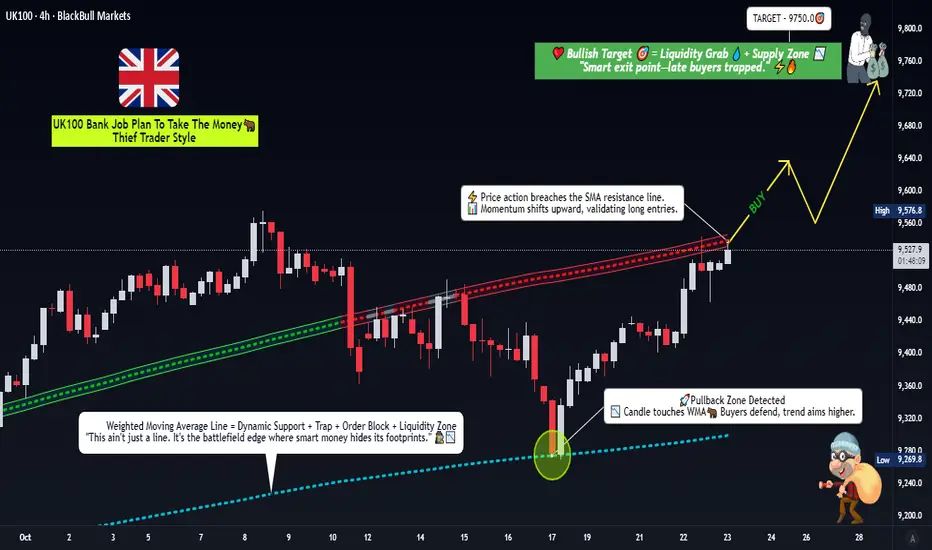
FTSE 100 Setup: Time to Go Long on This LSMA Breakout?🎯The UK100 "Capital Flow Heist" Blueprint 🚀 (Swing Trade Setup)
Buckle up, Thief Crew! 🏴☠️ We're plotting a bullish swing trade on the UK100, aiming to catch the next leg up. This isn't financial advice; it's a strategic blueprint for those who know how to handle the risk!
📈 The Master Plan (Analysis)
The strategy is simple: We're waiting for a confirmed bullish LSMA (Least Squares Moving Average) breakout to signal that the buyers are officially in control. This is all about timing the momentum shift and riding the wave.
⚙️ Trade Mechanics (The Heist Parameters)
Asset: UK100 (FTSE 100 Index)
Direction: Bullish
Style: Swing Trade
🎯 Entry Zone:
Action: Enter a LONG position on a confirmed candlestick close ABOVE the LSMA breakout level.
Level: 9560.0 (This is our launchpad! 🚀)
🛑 Stop Loss (The Escape Route):
Level: 9400.0
Thief's Note: This is my planned escape route. Place your SL where you are comfortable. Protect your capital like a pro! 💼
✅ Take Profit (The Loot Drop):
Level: 9750.0
Why Here? This zone represents a confluence of:
A strong historical resistance level.
Potential overbought conditions.
A classic bull trap area — so we grab our profits and exit stage left! 🎭
⚠️ Important Note from the OG: Dear Ladies & Gentlemen of the Thief Guild, I am not recommending you set only my SL or TP. It's your capital, your rules. You can make money, then take money at your own risk. Be a boss of your own trade. 😎
🔍 Related Pairs to Watch (The Intel)
To get a full picture, keep these assets on your radar. Movements here can influence our UK100 heist:
GBP/USD ( PYTH:GPUSD ): A stronger Pound can sometimes pressure the FTSE 100 (as many companies are multinational). Watch for inverse correlations.
US30 ($DOWI) / GER40 ( XETR:DAX ): Key global indices. Strong bullish moves in the US or German markets can often pull the UK market along for the ride.
EUR/GBP ( OANDA:EURGBP ): Economic dynamics between the UK and the Eurozone can cause capital flows in and out of UK assets.
✨ Final Community Message
“If you find value in my analysis, a 👍 and 🚀 boost is much appreciated — it helps me share more setups with the community!”
📜 Disclaimer & Hashtags
#UK100 #FTSE100 #TradingSetup #SwingTrading #TechnicalAnalysis #TradingView #CapitalFlow #ThiefStyle
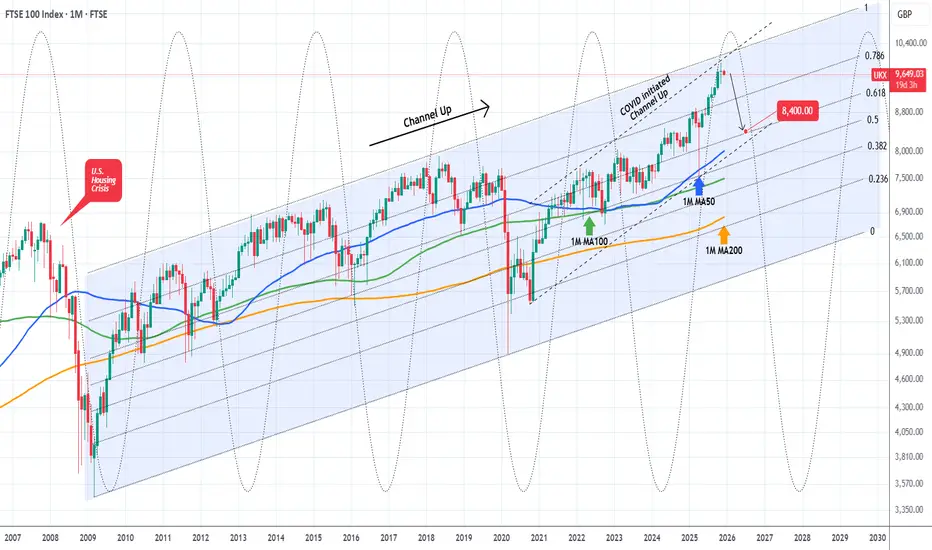
FTSE 100 Is starting a brutal 2026 Bear Cycle.Last time we looked at FTSE 100 (UK100) was 3 months ago (September 19, see chart below) where we gave a strong buy signal at the bottom of its 7-month Channel Up, which methodically hit our 9700 Target:
This time we are switching to the longest time-frame possible, the monthly (1M) as a key development has taken place. We switch our long-term stance to bearish as the index almost hit last month the top of its 16-year Channel Up, which started at the bottom of the 2008 U.S. Housing Crisis, and closed a very volatile November candle flat.
The use of the Sine Waves make the picture even clearer as they point out almost exactly every major Cycle Top since the 2008 Housing Crisis (5 such Cycle including that). And we are on one of them.
At the same time, the index also hit the top of the 5-year Channel Up that started shortly after the COVID crash bottom. Every correction (Bear Cycle/ Bearish Leg) within this pattern hit the 1M MA50 (blue trend-line) and rebounded. With the exception of the COVID flash crash which even broke below its 1M MA200 (orange trend-line), every other Bear Cycle since June 2012, hit the 1M MA100 (green trend-line) and rebounded.
As a result, we are expecting 2026 to be a strong Bear Cycle for FTSE, hitting at least its 1M MA50 at 8400, which is the bottom of the COVID Channel Up as well as the 0.618 Fibonacci retracement level of the post 2008 Channel Up.
---
** Please LIKE 👍, FOLLOW ✅, SHARE 🙌 and COMMENT ✍ if you enjoy this idea! Also share your ideas and charts in the comments section below! This is best way to keep it relevant, support us, keep the content here free and allow the idea to reach as many people as possible. **
---
💸💸💸💸💸💸
👇 👇 👇 👇 👇 👇
FTSE uptrend continuation supported at 9665The FTSE remains in a bullish trend, with recent price action showing signs of a breakout within the broader uptrend.
Support Zone: 9665 – a key level from previous consolidation. Price is currently testing or approaching this level.
A bullish rebound from 9665 would confirm ongoing upside momentum, with potential targets at:
9775 – initial resistance
9806 – psychological and structural level
9850 – extended resistance on the longer-term chart
Bearish Scenario:
A confirmed break and daily close below 9665 would weaken the bullish outlook and suggest deeper downside risk toward:
9630 – minor support
9598 – stronger support and potential demand zone
Outlook:
Bullish bias remains intact while the FTSE holds above 9665. A sustained break below this level could shift momentum to the downside in the short term.
This communication is for informational purposes only and should not be viewed as any form of recommendation as to a particular course of action or as investment advice. It is not intended as an offer or solicitation for the purchase or sale of any financial instrument or as an official confirmation of any transaction. Opinions, estimates and assumptions expressed herein are made as of the date of this communication and are subject to change without notice. This communication has been prepared based upon information, including market prices, data and other information, believed to be reliable; however, Trade Nation does not warrant its completeness or accuracy. All market prices and market data contained in or attached to this communication are indicative and subject to change without notice.

FTSE oversold rally support at 9600The FTSE remains in a bullish trend, with recent price action showing signs of a corrective pullback within the broader uptrend.
Support Zone: 9600 – a key level from previous consolidation. Price is currently testing or approaching this level.
A bullish rebound from 9600 would confirm ongoing upside momentum, with potential targets at:
9734 – initial resistance
9775 – psychological and structural level
9806 – extended resistance on the longer-term chart
Bearish Scenario:
A confirmed break and daily close below 9600 would weaken the bullish outlook and suggest deeper downside risk toward:
9570 – minor support
9540 – stronger support and potential demand zone
Outlook:
Bullish bias remains intact while the FTSE holds above 9600. A sustained break below this level could shift momentum to the downside in the short term.
This communication is for informational purposes only and should not be viewed as any form of recommendation as to a particular course of action or as investment advice. It is not intended as an offer or solicitation for the purchase or sale of any financial instrument or as an official confirmation of any transaction. Opinions, estimates and assumptions expressed herein are made as of the date of this communication and are subject to change without notice. This communication has been prepared based upon information, including market prices, data and other information, believed to be reliable; however, Trade Nation does not warrant its completeness or accuracy. All market prices and market data contained in or attached to this communication are indicative and subject to change without notice.

FTSE100 support retest at 9655The FTSE remains in a bullish trend, with recent price action showing signs of a breakout within the broader uptrend.
Support Zone: 9655 – a key level from previous consolidation. Price is currently testing or approaching this level.
A bullish rebound from 9655 would confirm ongoing upside momentum, with potential targets at:
9765 – initial resistance
9800 – psychological and structural level
9885 – extended resistance on the longer-term chart
Bearish Scenario:
A confirmed break and daily close below 9655 would weaken the bullish outlook and suggest deeper downside risk toward:
9625 – minor support
9595 – stronger support and potential demand zone
Outlook:
Bullish bias remains intact while the FTSE holds above 9655. A sustained break below this level could shift momentum to the downside in the short term.
This communication is for informational purposes only and should not be viewed as any form of recommendation as to a particular course of action or as investment advice. It is not intended as an offer or solicitation for the purchase or sale of any financial instrument or as an official confirmation of any transaction. Opinions, estimates and assumptions expressed herein are made as of the date of this communication and are subject to change without notice. This communication has been prepared based upon information, including market prices, data and other information, believed to be reliable; however, Trade Nation does not warrant its completeness or accuracy. All market prices and market data contained in or attached to this communication are indicative and subject to change without notice.

FTSE sideways consolidation below 9765 resistanceThe FTSE remains in a bullish trend, with recent price action showing signs of a breakout within the broader uptrend.
Support Zone: 9655 – a key level from previous consolidation. Price is currently testing or approaching this level.
A bullish rebound from 9655 would confirm ongoing upside momentum, with potential targets at:
9765 – initial resistance
9800 – psychological and structural level
9885 – extended resistance on the longer-term chart
Bearish Scenario:
A confirmed break and daily close below 9655 would weaken the bullish outlook and suggest deeper downside risk toward:
9625 – minor support
9595 – stronger support and potential demand zone
Outlook:
Bullish bias remains intact while the FTSE holds above 9655. A sustained break below this level could shift momentum to the downside in the short term.
This communication is for informational purposes only and should not be viewed as any form of recommendation as to a particular course of action or as investment advice. It is not intended as an offer or solicitation for the purchase or sale of any financial instrument or as an official confirmation of any transaction. Opinions, estimates and assumptions expressed herein are made as of the date of this communication and are subject to change without notice. This communication has been prepared based upon information, including market prices, data and other information, believed to be reliable; however, Trade Nation does not warrant its completeness or accuracy. All market prices and market data contained in or attached to this communication are indicative and subject to change without notice.

FTSE100 uptrend continuation supported at 9655The FTSE remains in a bullish trend, with recent price action showing signs of a breakout within the broader uptrend.
Support Zone: 9655 – a key level from previous consolidation. Price is currently testing or approaching this level.
A bullish rebound from 9655 would confirm ongoing upside momentum, with potential targets at:
9765 – initial resistance
9800 – psychological and structural level
9885 – extended resistance on the longer-term chart
Bearish Scenario:
A confirmed break and daily close below 9655 would weaken the bullish outlook and suggest deeper downside risk toward:
9625 – minor support
9595 – stronger support and potential demand zone
Outlook:
Bullish bias remains intact while the FTSE holds above 9655. A sustained break below this level could shift momentum to the downside in the short term.
This communication is for informational purposes only and should not be viewed as any form of recommendation as to a particular course of action or as investment advice. It is not intended as an offer or solicitation for the purchase or sale of any financial instrument or as an official confirmation of any transaction. Opinions, estimates and assumptions expressed herein are made as of the date of this communication and are subject to change without notice. This communication has been prepared based upon information, including market prices, data and other information, believed to be reliable; however, Trade Nation does not warrant its completeness or accuracy. All market prices and market data contained in or attached to this communication are indicative and subject to change without notice.

FTSE bullish breakout supported at 9655The FTSE remains in a bullish trend, with recent price action showing signs of a breakout within the broader uptrend.
Support Zone: 9655 – a key level from previous consolidation. Price is currently testing or approaching this level.
A bullish rebound from 9655 would confirm ongoing upside momentum, with potential targets at:
9765 – initial resistance
9800 – psychological and structural level
9885 – extended resistance on the longer-term chart
Bearish Scenario:
A confirmed break and daily close below 9655 would weaken the bullish outlook and suggest deeper downside risk toward:
9625 – minor support
9595 – stronger support and potential demand zone
Outlook:
Bullish bias remains intact while the FTSE holds above 9655. A sustained break below this level could shift momentum to the downside in the short term.
This communication is for informational purposes only and should not be viewed as any form of recommendation as to a particular course of action or as investment advice. It is not intended as an offer or solicitation for the purchase or sale of any financial instrument or as an official confirmation of any transaction. Opinions, estimates and assumptions expressed herein are made as of the date of this communication and are subject to change without notice. This communication has been prepared based upon information, including market prices, data and other information, believed to be reliable; however, Trade Nation does not warrant its completeness or accuracy. All market prices and market data contained in or attached to this communication are indicative and subject to change without notice.

FTSE resistance retest at 9715The FTSE remains in a bullish trend, with recent price action showing signs of a breakout within the broader uptrend.
Support Zone: 9510 – a key level from previous consolidation. Price is currently testing or approaching this level.
A bullish rebound from 9510 would confirm ongoing upside momentum, with potential targets at:
9715 – initial resistance
9760 – psychological and structural level
9800 – extended resistance on the longer-term chart
Bearish Scenario:
A confirmed break and daily close below 9510 would weaken the bullish outlook and suggest deeper downside risk toward:
9477 – minor support
9430 – stronger support and potential demand zone
Outlook:
Bullish bias remains intact while the FTSE holds above 9510. A sustained break below this level could shift momentum to the downside in the short term.
This communication is for informational purposes only and should not be viewed as any form of recommendation as to a particular course of action or as investment advice. It is not intended as an offer or solicitation for the purchase or sale of any financial instrument or as an official confirmation of any transaction. Opinions, estimates and assumptions expressed herein are made as of the date of this communication and are subject to change without notice. This communication has been prepared based upon information, including market prices, data and other information, believed to be reliable; however, Trade Nation does not warrant its completeness or accuracy. All market prices and market data contained in or attached to this communication are indicative and subject to change without notice.

FTSE100 post-Budget rally: Inverse Head & Shoulders eyes 9800Chancellor Reeves unveiled tax rises worth £26 billion annually by 2029-30 but showed fiscal discipline by committing to reduce government spending as a share of GDP each year and more than doubling the fiscal headroom buffer to £21.7 billion, reassuring bond markets still scarred by the Liz Truss mini-budget crisis.
With gilt yields falling, sterling at its best level since October, and a Bank of England rate cut expected in December, the macro backdrop supports further upside for Footsie, though sticky inflation and OBR growth downgrades remain headwinds.
Key drivers:
UK Budget introduces tax rises totalling £26bn annually by 2029-30 via threshold freezes, mansion tax, and dividend levies, but spending will decline as a share of GDP each year, calming government borrowing concerns and sending gilt yields lower.
Fiscal headroom buffer more than doubled to £21.7bn (from £9.9bn last year), giving bond vigilantes confidence that the debt trajectory is sustainable.
Sterling rallied above 1.32 towards 1.33 on lower borrowing risks, while FTSE 100 gained, led by financials.
Bank of England expected to cut rates 25bp in December, supporting equities, though sticky inflation and OBR growth downgrades are headwinds.
Technical setup : inverse head and shoulders with neckline/support at 9,630 (38.2% Fib), measured move and Fib confluence target 9,800 (between 61.8% and 78.6% retracement).
Trade idea : Entry on pullback to 38.2% Fib (9,630), stop below previous low (9,434), target 9,800, for 2:1+ risk-to-reward.
Trading the FTSE bounce? Drop your setups in the comments and follow for more high-action technical and macro trade ideas.
This content is not directed to residents of the EU or UK. Any opinions, news, research, analyses, prices or other information contained on this website is provided as general market commentary and does not constitute investment advice. ThinkMarkets will not accept liability for any loss or damage including, without limitation, to any loss of profit which may arise directly or indirectly from use of or reliance on such information.
