Trading opportunity for long position UMAUSDTBased on technical factors there is a Long position in :
📊 UMAUSDT
🔵 Long Now 2.355
🧯 Stop loss 2.166
🏹 Target 1 2.700
🏹 Target 2 3.200
🏹 Target 3 3.900
💸RISK : 1%
We hope it is profitable for you ❤️
Please support our activity with your likes👍 and comments📝
Umabtc

UMA/USDT - PULLBACK AND UP AGAIN !Just made nice 40% profit on trade which is also shown on chart.
RSI now is very high, it need to cool and go down.
I marked buyzone and possible scenario for price and RSI movement in WHITE colors.
Share your ideas and thoughts.

UMA ready to pump in a short-termUMAUSDT is ready to pump in a short-term.
It looks like both on 4h and 1D timeframes UMAUSDT is forming its temporary bottom and is ready to join other altcoins for its own relief rally.
We expect UMA to reach 4,80 - 5,20 in the next week.
-Trade on stop.
-If drops lower, accumulate
-High risk trade. Trade only as much as you´re willing to lose


umabtc break out Uma breaks out the downtrend daily and makes X2, now we are waiting for the close of the weekly candle; with the divergence observed, we will wait for a 500% gain at least.

UMA BRECKOUT! READY TO PUMP 100%!Hi guys, This is CryptoMojo, One of the most active trading view authors and fastest-growing communities.
Do consider following me for the latest updates and Long /Short calls on almost every exchange.
I post short mid and long-term trade setups too.
Let’s get to the chart!
I have tried my best to bring the best possible outcome in this chart, Do not consider it as financial advice.
UMA is breaking out from the bullish pennant pattern. I'm expecting a big move from it. Buy some now and hold it for some time.
Entry range:- $8-$8.3
Target1:- $9.6
Target2:- $11.2
Target3:- $13.4
Target4:- $16
SL:- $7.5
This chart is likely to help you in making better trade decisions if it did do consider upvoting this chart.
Would also love to know your charts and views in the comment section.
Thank you

After My Alert This Morning, UMA Pumped 70%! Amazing!
After an alert I put out to subscribers this morning, UMA went parabolic! Congrats to those who followed me! Is it altcoin season yet? And a little about bitcoin and where it needs to close today.

UMA/BTC potential breakout! - textbook falling wedge, watch for breakout but wait for at least daily close above it. UMA likes to fakeout.
- higher low/double bottom
- weekly StochRSI crossing up
- more frequent tests of upper trendline with good volume
- if UMA breaks out of the falling wedge, it can move quickly
- current market cap $580m, a lot up upside potential
Targets:
T1: 0.00037 BTC
T2: 0.0006 BTC
T3: 0.0011 BTC
Breaking the lower trendline invalidates the trade.
Good luck!

UMAUSDT - BUYING THE REAL DIPEmissary over here.
Hello again everyone.
Today we take a look at UMA.
Right here we have the roadmap for this coin I've been following for a while now, for the next six months. Price offer and demand zones denoted in purple horizontal lines. Arrows drawn depict how I roughly expect the coin to do in the mid term.
Plain and simple, buy the dip, from there on book your profits at the end of each green arrow and stack some more UMA at the end of each red one. Expected percentual profits for each move are depicted within the chart with the price range tool.
Thank you for reading the message once again. If we reach 100 followers I'll do something special for my audience.
If you like my work give it a thumbs up and leave a follow for more everyday analysis. Remember the message never sleeps.
Also I'd like to hear your opinion in the comments.
Remember this is no financial advise, DYOR and trade at your own pace and risk.
Byebye

UMABTC 8h long setup; Breakout of 1.5 year downtrendTA explained
Starting with the bigger picture for UMA using the 1W TF. A long lasting downtrend (starting at Sept 2020) was broken at the start of November with a very strong bullish weekly candle, after which the price pullback and retested the broken TL.
Zooming into the 8H TF we can see two interesting things. First we see the price retested the descending TL twice. Second interesting fact is the second time it tested the trendline it also aligns with the center of the demand zone on the left.
Last thing to consider is the break of the local descending trendline. After getting rejected 3 times, the fourth time price was able to break through. With this little pullback we might already start the upward continuation. If not a deeper retracement could happen by retesting the latest low and creating a double bottom which would give us our second entry as well:
Trade setup
Entry zone: 0.0002022 - 0.0002174
TP1: 0.0003279
TP2: 0.0004411
TP3: 0.0005539
SL: 0.0001745
RR: 9.93
Max leverage: na
—————
MDSquared Crypto Lounge
—————
Do Your Own Research (of course)
Trade at own risk (of course)
Only trade what you can afford to lose (of course)

UMAUSDT Technical Analysis💎 UMAUSDT has been rejected by the support zone. The series of green candle show that the bulls can potentially push the price much higher. However, we might see a pullback after the pump. The price is moving to the next major resistance.
🌐 Tradingview
💵 Invest Only 5% of your Portfolio
🎳 Entry/Pullback now or from 10.649 - 9.682
☕️ TP1 11.535
🍺 TP2 13.019
🍻 TP3 14.663
🍾 TP4 16.234
🍷 TP5 17.631
🍸 TP6 19.000
🍹 TP7
🎁 TP8
🚫 SL 9.518 - 8.405
Good Luck 🎲
Check the Links in Description and if you LIKE this analysis, please support our page and Ideas by hitting the LIKE 👍 button. ❤️ Your Support is really appreciated! ❤️
Traders, if you have your own opinion about it, please write your own in the comment box. We will be glad for this.
Feel free to request any pair/instrument analysis or ask any questions in the comment section below.
We will have more FREE forecasts in TradingView soon
Have a profitable day 😊👍🏻

Add a bag of UMAUma is ready to fly to moon and will move to his ATH buying gown hai 16.5 - 14$ it following several support line and soon it will break it resistance line
Add a bag of UMA
HAPPY TRADING

UMAUSD Update - Yes, we are still on our way to a $28 target!In this video:
Discussion of the current price action
Are we still headed to $28
Future price projections

UMA/USDT 44% up within 24 hours so book some Profit#UMAUSDT Update:
#UMA did 44% profit within 24 hours.
you can book some profit and enjoy the ride.
UMA/USDT did 31% within 14 hours#UMAUSDT profit update:
#UMA did 31% Profit within 14 hours.
Hope you enjoyed guys.

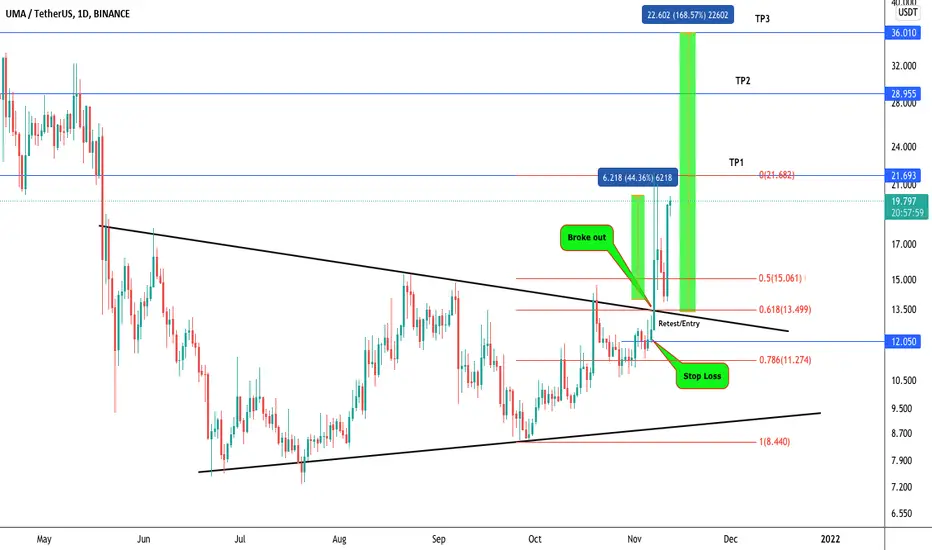
UMA/USDT Ready to 168% From here..?#UMA/USDT TA update:-
$UMA already breakout Resistance level and Now ready to Retest.
Retest will be best entry.
Entry:- $13.50-$14.20
Targets:- $21.70/$29/$36
Stop Loss:- $12
Support:- $13-$13.50
Resistance:- Targets

UMAUSD Final Target $28 - Technical Analysis - Patterns - LevelsIn this video:
5 minute charting analysis
Triangle(s) spotted
Reverse Head and Shoulders Pattern
Areas of resistance
Targets and final target of $28

UMAUSDT Technical Analysis⏳ Spot
💎 UMAUSDT has got rejected from the major resistance. It is going to have a pullback at the previous support and then we can expect another bullish move. It can pump after the resistance breakout
🌐 Tradingview
💵 Invest Only 5% of your Portfolio
🎳 Entry Now or at 15.261 to 17.385
☕️ TP1 21.854
🍺 TP2 26.235
🍻 TP3 30.084
🍾 TP4 33.845
🍷 TP5
🍸 TP6
🍹 TP7
🎁 TP8
🚫 SL 13.668 to 15.261
Good Luck 🎲
Check the Links in Description and If you LIKE this analysis, Please support our page and Ideas by hitting the LIKE 👍 button. ❤️ Your Support is really appreciated! ❤️
Traders, if you have your own opinion about it, please write your own in the comment box. We will be glad for this.
Feel free to request any pair/instrument analysis or ask any questions in the comment section below.
We will have more FREE forecasts in TradingView soon
Have a profitable day 😊👍🏻

UMAUSDT go longin my opinion it seems like a very interesting area to go long on this asset (UMA).
HOWEVER,Do not rely on my analysis and do you own research.

UMAUSDT is Heating up - BOS ConfirmedBOS - Break of structure
KR/KS - Key Resistance/ Support
ATH - All Time High
UMAUSDT🔥 - We are looking to see price fall back to the demand zone since BOS is confirmed.
I will look forward to buying in at demand zone ( 13.621 area )
Follow targets 1 and 2 to secure your profits. You may re-enter at our virtual demand zone and exit 50% at target 2, then leave the rest to see what price will do
Kindly do place your SL below KS.
Like, follow me and Comment below, let me know what you think.

UMAUSDT Technical Analysis⏳ Spot
💎 UMAUSDT has broken above the symmetrical triangle, the retest has been successful and the pullback has happened already. After series of rejections I expect that it goes higher.
🌐 Tradingview
🏁 Short & Medium Term
💵 Invest Only 5% of your Portfolio
🎳 Entry Now or at 11.996 to 12.947
☕️ TP1 14.008
🍺 TP2 15.269
🍻 TP3 16.856
🍾 TP4 18.543
🍷 TP5 20.597
🍸 TP6
🍹 TP7
🎁 TP8
🚫 SL 11.295 to 11.996
Good Luck 🎲
Check the Links in Description and If you LIKE this analysis, Please support our page and Ideas by hitting the LIKE 👍 button. ❤️ Your Support is really appreciated! ❤️
Traders, if you have your own opinion about it, please write your own in the comment box. We will be glad for this.
Feel free to request any pair/instrument analysis or ask any questions in the comment section below.
We will have more FREE forecasts in TradingView soon
Have a profitable day 😊👍🏻

#UMAUSDT ready to go to make new high at $16#UMA retest it's support area at 12.4 and try to reach to it's dynamic resistance at 13.8
if #UMA breakout , will pump to 15 - 16.5
#SoroushOsivand #SorooshSchool

UMA looks greatYOUR LIKE OR COMMENT IS MY FUEL FOR NEXT ANALYSIS :) IF U HAVE ANY QUESTION REACH ME HERE
This is not a financial advice. Always do your own research and always put stoploss in your trade (SL) :) If you want more detailed info how to study and read charts or just need help with some coin, just write to me here a comment, i will try to answer to everybody... i can help you :) all for free, don't worry, BE HAPPY!
