Umabtc
Level to WATCH for either more downward or reversal price action
*DISCLAIMER: I am not a financial advisor and this is not financial advice as these are purely my opinions and speculations. I do not guarantee any results nor am I responsible for your actions. You should always do your own due diligence before trading or investing in this market as it is extremely risky.
*Follow me for the latest cryptocurrency analyses on my watchlist
*Let me know in the comment section if you agree or disagree, would love to hear your ideas too.
*Thank you to those who donated, I very much appreciate it.


Large volumeI noticed this spike has more volume on UMABTC than UMAUSD on coinbase. Really interesting.

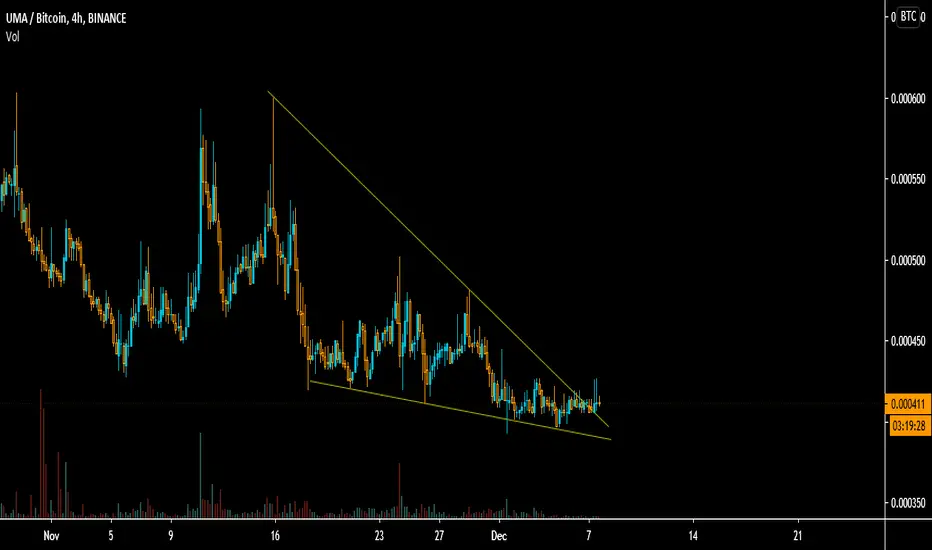
Bullish pattern apparent will it break to the upside?The current situation:
1. A bullish symmetrical triangle is apparent on the 4HR chart while the price action is near the apex of the triangle. The chance of breaking to the upside is 60% and the measured target is about 11.6 USD
The bearish case: if the price action closes below the 4HR 21MA and below the bottom trend line, then lower price action is expected
*Follow me for the latest cryptocurrency analyses on my watchlist
*Thank you to those who donated, I very much appreciate it.
*Let me know in the comment section if you agree or disagree, would love to hear your ideas too.
*These are purely my speculations and not financial advice. You should always do your own due diligence before trading or investing.

UMA 100% Candle + Project Overview & Chart Analysis w/ TargetsUMABTC | Strong drops lead to strong growth.
Today UMABTC printed a very strong 100% candle... We can also see really high volume.
About UMA
UMA describes itself as a protocol for building synthetic assets. It aims to allow users to write self-enforcing smart contracts with economic guarantees. UMA is designed to power the financial innovations made possible by permissionless, public blockchains, like Ethereum. Using concepts borrowed from fiat financial derivatives, UMA defines an open-source protocol that allows any two counterparties to design and create their own financial contracts. But unlike traditional derivatives, UMA contracts are secured with economic incentives alone, making them self-enforcing and universally accessible.
UMA, along with Ren protocol, has launched a Yield Dollar alongside a three-asset yield farming incentive, which enables its users to lock renBTC into UMA. renBTC can be used as collateral to mint uUSD and purchase more renBTC to create a permissionless leveraged position. Yield farming will also be supported.
Thanks a lot for reading.
Namaste.

✳️UMA/BTC (5-10) #UMA $UMA #UMABTCUMA is still in its bearish wave and it's not worthy to bet on just a little. We will wait for the price action at 750sts (if happens).
- If it breaks the 750sts zone, it will keep going up to 850sts
- If not, it will turn back to 650sts then find another opportunity to pump up
The reason why we shouldn't buy it is the super big volume of previous dumps, I think someone is selling it with big amounts!

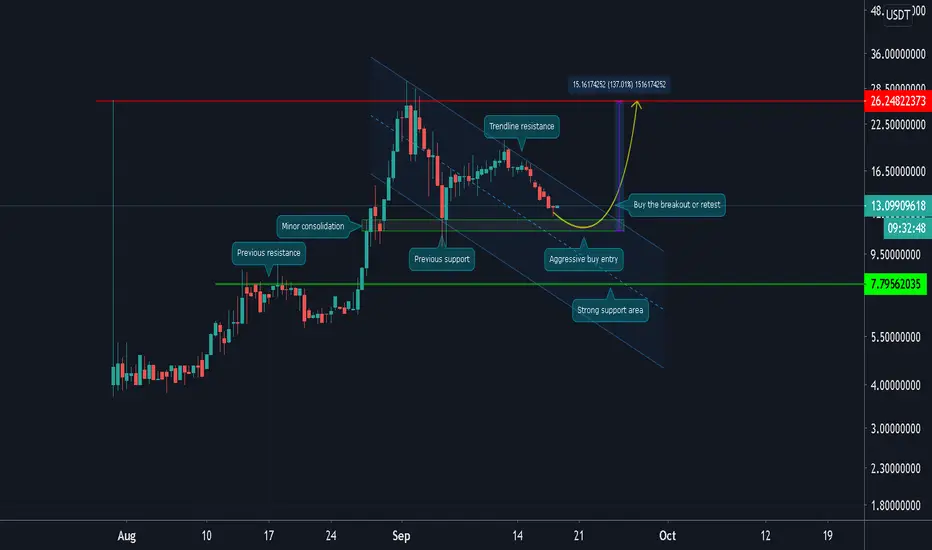
UMA/USDT (Retest Previous Support)POLONIEX: UMAUSDT
-UMA is trading inside a descending channel after a series of rejection at the trendline resistance
-It is also trading just above the previous support area at 12-11 dollars
-If this immediate support level will hold and see a channel breakout
-That is a good potential entry point for upside continuation up to 26 dollars
-But if this level failed, keep an eye at 8 dollars next major support
``````````````````````````````````````````````
Trading Involves High Risk
Not Financial Advice
Please Exercise Risk Management
``````````````````````````````````````````````
If You Like My Daily Published Ideas
A little Help By Supporting My Channel
Through Leaving A Thumbs Up, Comment & Follow
Happy Trading! --> Thank You! :)
``````````````````````````````````````````````