Unity Software (NYSE:U) – Bullish Setup on ATR Pullback Zone💼 UNITY SOFTWARE INC. (NYSE: U) — Profit Playbook | Swing Trade Edition
Plan:
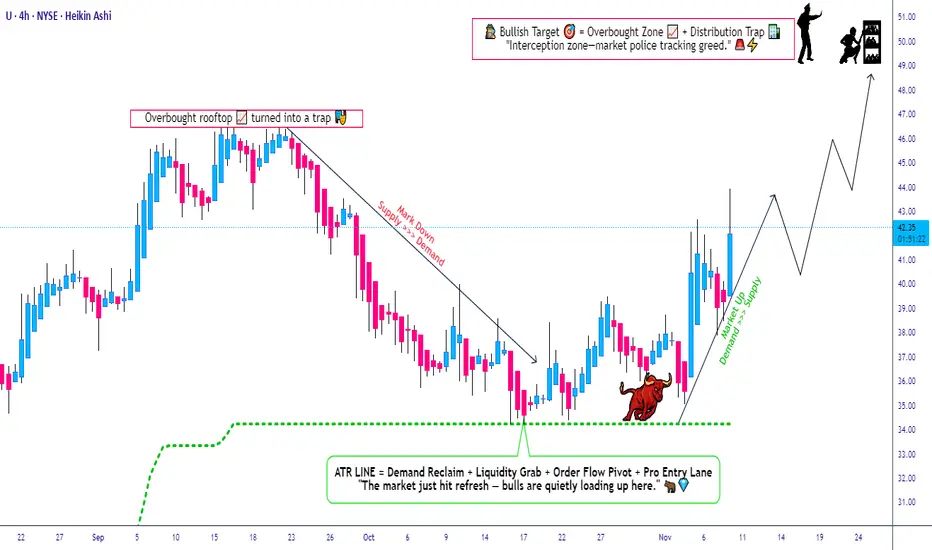
Bullish plan confirmed 🔔 using Super Trend ATR pullback confirmation. The market structure shows strong accumulation near support — perfect for layered Thief entries.
🎯 Entry Plan — Thief Layer Strategy (Multi-Limit Entry Style)
This setup uses a layered buy-limit method, often called the Thief Strategy, designed for professional accumulation during pullbacks.
📍 Buy-Limit Layers:
Layer 1 → $38.00
Layer 2 → $40.00
Layer 3 → $42.00
(You can increase layers based on your personal capital & risk setup.)
💡 Objective: Catch deep retracements with reduced entry risk, building position like a true OG Thief. 😎
🛑 Stop-Loss (Thief Safety Net)
🚨 Thief SL @ $36.00
📜 Note: Dear Ladies & Gentlemen (Thief OG’s), this is not financial advice.
Choose your own risk tolerance — make money, take money, and secure your bag wisely. 💼
🏁 Target — Police Barricade Resistance
🚓 Target Zone @ $50.00
⚠️ Resistance near $50 acts as the “Police Barricade” with overbought signs and possible profit traps.
OG Thieves — once your mission is complete, exit with clean profits! 💰
📜 Note: Dear Ladies & Gentlemen (Thief OG’s), target levels are flexible — manage trades with your own plan and conviction.
🔍 Correlated Pairs / Market Watchlist
To strengthen your market view, keep eyes on correlated tickers:
NASDAQ:MSFT — Cloud & AI exposure correlation to Unity’s software sector.
NASDAQ:NVDA — AI & metaverse narrative closely aligns with Unity’s growth cycle.
NASDAQ:META — Metaverse link; sentiment around VR/AR drives $U.
NASDAQ:AAPL — Tech momentum correlation; strong rallies tend to uplift Unity.
📈 When tech majors push bullish momentum, Unity often joins the ride — follow sector flows!
✨ “If you find value in my analysis, a 👍 and 🚀 boost is much appreciated — it helps me share more setups with the community!”
#U #UnitySoftware #SwingTrade #NYSE #ThiefStrategy #ATR #Supertrend #TechStocks #AI #Metaverse #TradingPlan #BullishSetup #StockMarket #TradeSmart #RiskManagement #ChartAnalysis #TradingView #EditorPick #StockIdeas #LayeringStrategy
Unityanalysis
UNITY: Breakout - Retest - Higher, 40% Movie InboundUnity Software - NYSE:U 🎮
Breakout👏Retest👏Higher👏
CupnHandles have the highest success rate after they breakout!
-H5 isn't GREEN but only by centimeters, being patient due to last weeks shenanigan's
-Williams CB just formed support
🎯$26🎯$30🎯$33
Not financial advice

Unity is on the RISE! New High Five Setup - 35% Move Inbound🚨 NEW HIGH FIVE SETUP! 🚨
Unity - NYSE:U
Just bought these calls for June next year. It's a riskier play but they have broken out of a Cup n Handle pattern and just successfully rested the breakout area today.
- High Five Indicator is green and flashed a BUY signal.
- AVP GAPS x2
🔜 $25.89
🎯 $30.35
📏 $33.31
⏳ 27May2025
NFA

Unity dropped 7.7% Q3 earnings, still got chance go bullish?
Technical speaking, the price is overall moving in a bullish market after forming a head-shoulder bottom.
It is fluctuating between a consolidation box for a short-term pullback.
However, it dropped 7.7% after releasing the earnings report, which disappointed many investors.
From a fundamental perspective, Unity Software's latest earnings report reveals that the company achieved a revenue of $447 million last quarter, representing an 18% year-over-year decline. Specifically, its game development engine segment, Create Solutions, and game advertising segment, Grow Solutions, experienced declines of 22% and 16%, respectively, indicating a significant setback in its core business.
So, will the price continue to go bullish after this pullback?
I think it might continue to go bullish if the price could break above the consolidation box later, so we could buy there.
If not, we'd better to wait for a better buy timing.

Unity stock has been suppressed at the same position !Unity stock has been suppressed at the same position in the past year!
This figure shows the weekly candle chart of Unity stock since its listing and trading. The graph overlays the top to bottom golden section of the highest point in history. As shown in the figure, after the full release of the bearish momentum in May 2022 of Unity stock, it completed its recent bottom in July 2022 and has been suppressed by the 2.000 position of the golden section in the figure until now! In the future, it is likely to hit a new low or achieve a double bottom before accumulating bullish momentum and rebounding upwards!

$U Unity Trade Idea with Entry, Possible Targets, and StopLoss!Hi Traders,
Here's my Trade Idea for UNITY, after a good V shape reversale, followed by Downtrend Breakout, and not too bad Momentum, I think if it breaks the 105.9 level, it may reach the mentioned targets.
Buy Stop 105.9$
STOPLOSS 91$
Targets:
127$
136$
156$
Nfa, DYOR, and good Luck.
Let me know what do you think in the comments!
