UNI/USDT — The Decision Zone: A Major Rebound or Full Breakdown?UNI is now sitting at the most critical level since 2022.
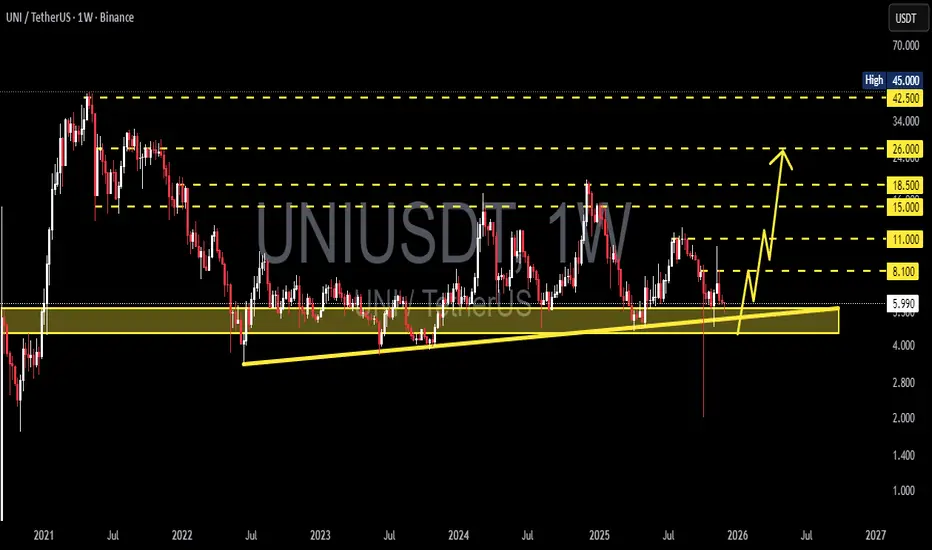
Price has returned to the golden support zone at 5.7–4.5, an area that has repeatedly acted as the final defense before massive moves — either explosive rallies or deep capitulation.
The weekly structure reveals one thing clearly:
The market is testing long-term investor conviction.
---
🔶 Market Structure & Dominant Pattern
UNI has been forming a multi-year accumulation range, with a remarkably consistent base at 5.7–4.5.
An ascending base formation has slowly taken shape from 2022 to 2025, showing subtle higher lows.
Price action here will determine whether this structure becomes:
Re-accumulation before a new uptrend, or
Distribution before a major breakdown.
This zone is not just support —
it is a liquidity battlefield where large buyers and market makers typically operate.
---
🟩 Bullish Scenario — If 5.7–4.5 Holds
If UNI shows strong weekly rejection from this zone:
1. Expect a bullish reversal candle (pin bar / long wick) confirming buyer aggression.
2. First target: 8.1 — the initial key resistance.
3. If momentum continues, price could expand toward
11 → 15 → 18.5.
4. A clean break above 15 usually signals the beginning of a mid-term expansion phase.
This is the scenario where UNI reclaims strength as one of the main DeFi assets.
---
🟥 Bearish Scenario — If 4.5 Breaks
A weekly close below 4.5 would be a major structural failure:
The multi-year accumulation pattern becomes invalid.
Market likely enters a capitulation phase.
Downside targets would shift to:
3.0
And potentially 2.0 if selling accelerates.
This scenario only unfolds if investors completely abandon the support zone.
---
🔍 Why the 5.7–4.5 Zone Is Critical
Almost every UNI rally since 2022 has started from this box.
Massive liquidity sits here: stop-loss clusters, limit orders, and margin liquidations.
Historical wicks repeatedly show aggressive buybacks from this region.
Market makers tend to accumulate here before large directional moves.
Simply put:
If UNI is going to launch a new uptrend, this is the most strategic zone to do it.
---
🧭 Bottom Line
UNI is in a make-or-break phase.
Holding above 5.7–4.5 opens a pathway toward 11–18.
Breaking below 4.5 sets the stage for a deeper bearish continuation.
This chart has no middle ground —
The next weekly closing will define UNI’s trajectory for 2025.
---
🔖 Hashtags for TradingView
#UNI #UNIUSDT #Uniswap #CryptoAnalysis #WeeklyChart #SupportZone #BreakoutOrBreakdown #BullishScenario #BearishScenario #CryptoMarket
Uniusdtsignal
UNIUSDT — at Golden Zone: Major Reversal or the Final Breakdown?Main Narrative
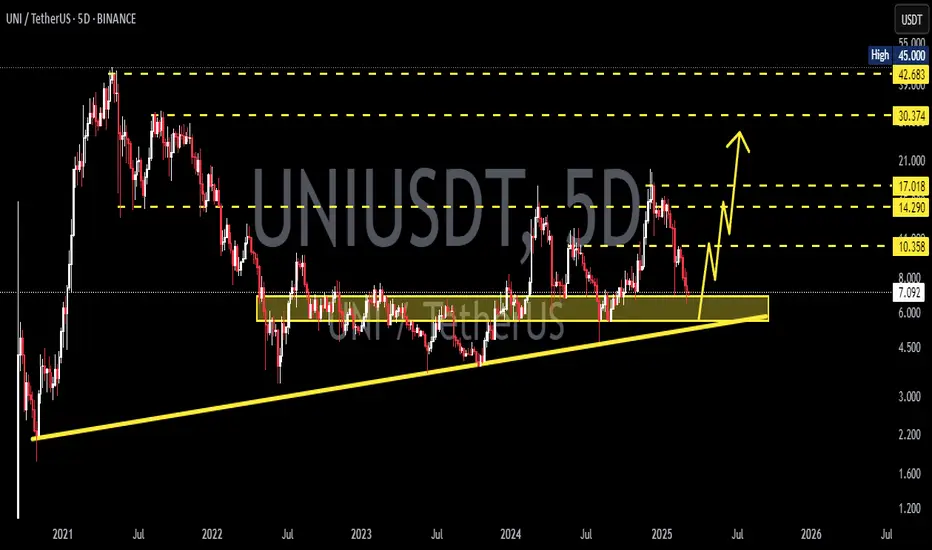
UNI is currently trading at one of the most decisive levels in its entire price history — the $4.0–$5.0 zone, a multi-year fortress of demand that has repeatedly triggered strong rebounds since 2021.
Each time price entered this zone, buyers stepped in aggressively. However, this time the structure looks different — lower highs have been forming consistently, indicating sustained selling pressure.
This is a make-or-break moment for UNI: either it defends this golden zone and starts a new uptrend, or it breaks down into uncharted territory.
---
Technical Analysis
Timeframe: Weekly (mid-to-long-term structure).
Current price: Around $6.39, sitting just above the critical golden zone.
Key levels:
Support zone: $4.0–$5.0 → major historical accumulation area since 2021–2024.
Resistance levels: $8.77 → $11.04 → $14.31 → $18.33 → $26.41 → $42.82.
All-Time High: $45.00.
Price structure:
Continuous lower highs since early 2024, showing sustained bearish control.
Price is moving within a multi-year accumulation range roughly between $4 and $18 — forming a type of megaphone compression that’s nearing its resolution point.
Notice the long lower wick below the current range — a clear liquidity sweep or stop-hunt, often a precursor to trend reversals.
Main pattern formation:
Descending structure (lower highs) → bearish compression.
Potential double bottom / spring setup → if a bullish candle forms in this zone, a macro reversal may begin.
Long-term accumulation range → suggests the market is building energy for a large move soon.
---
Bullish Scenario
Major Reversal Setup (Reclaim from the Golden Zone)
If UNI holds the $4.0–$5.0 zone and forms a strong bullish weekly candle, key upside targets are:
Target 1: $8.77 (first major resistance reclaim)
Target 2: $11.04
Target 3: $14.31
Extended target: $18.33 if momentum builds.
Additional confirmation: weekly bullish divergence on RSI or MACD, and a break above the first lower high structure.
This would signal the start of a potential mid-term reversal trend — possibly marking this zone as the golden bottom for UNI.
---
Bearish Scenario
Breakdown Continuation (Collapse Below Multi-Year Support)
A weekly close below $4.0 would confirm a breakdown from a 3-year accumulation structure.
Consequences could be severe:
Next support levels: $2.5 → $1.7 → $0.85.
Likely panic sell-off or capitulation wave.
However, such a breakdown could also serve as a final shakeout before a large-scale reversal — watch the weekly close, not just intraday wicks.
---
Sentiment & Context
UNI is standing at a psychological and structural crossroads.
Long-term holders have been defending this area for years, making it a critical liquidity zone.
If the zone breaks, stop losses and long-term positions could be flushed — but if it holds, UNI could become one of the strongest DeFi rebound plays in the next cycle.
This is the kind of setup where patience and confirmation matter far more than prediction.
---
Conclusion
The $4.0–$5.0 zone is not just support — it’s UNI’s lifeline.
Hold above = possible start of a new bullish era.
Break below = risk of a deeper bearish expansion.
Everything now depends on how the weekly candle closes.
The best traders will wait for confirmation rather than chase the wick.
> “This golden zone will decide UNI’s destiny — rebirth from the ashes, or another chapter in its decline.”
---
#UNI #UNIUSDT #Uniswap #CryptoAnalysis #TechnicalAnalysis #DeFi #SupportZone #WeeklyChart #TrendReversal #BreakdownAlert #SwingTrading #CryptoMarket #ChartAnalysis #CryptoOutlook

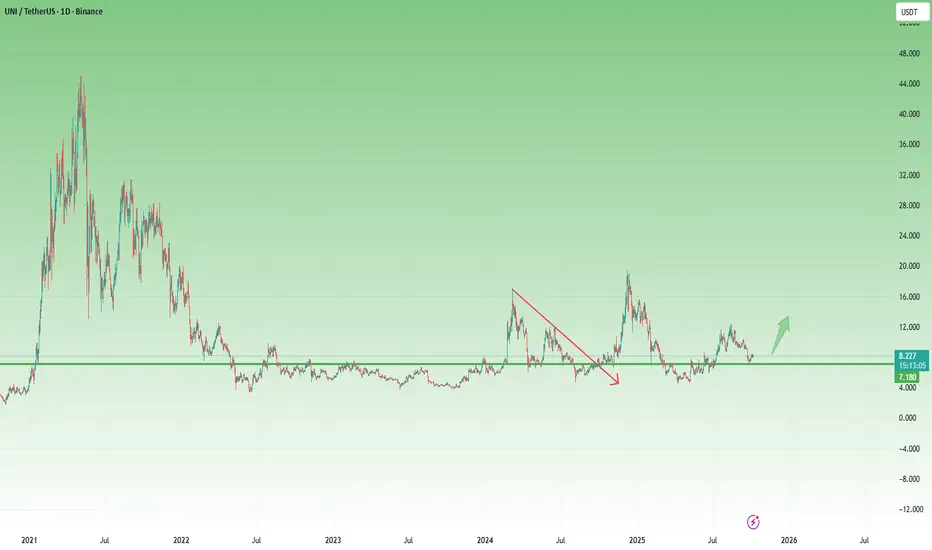
Uniswap Holding above $7 — Bullish Setup AheadAfter the massive 90% drop from its 2021 peak, Uniswap has been consolidating within a wide range. Each attempt to break higher has so far been followed by a return toward the lower end of the structure — a clear sign of prolonged accumulation.
What’s particularly interesting is how the $7 zone has consistently acted as a median level. Every time price dipped below it, UNI found demand and reversed back up. Recently, a solid support base has been confirmed around $5, further strengthening the bullish technical structure.
With the majority of altcoins now positioned for potential upward continuation, Uniswap could also be preparing for a significant leg higher, with a medium-term target around $14 per coin.
However, negation of this bullish setup would come with a clear breakdown below the $7 zone, which could open the way for a retest of the $5 support once again.
From a trading perspective, this setup offers an attractive 1:5 risk-to-reward ratio, making it an opportunity worth keeping on the radar — provided the $7 level holds.
UNIUSDT 1D Analysis UNI ~ 1D Analysis
#UNI Buy gradually after successfully breaking through this resistance line with a short-term target of at least 10%++
UNIUSDT 1WUNI ~ 1W Analysis
#UNI If you still have a Conviction on this coin, maybe this support you can consider to start buying back with a minimum target of 20%+.

UNIUSDT 1WUNI ~ 1W Analysis
#UNI Buy gradually from here if you still have a Conviction on this Coin with a minimum target of 20%+.
UNIUSDT Perpetual Swap Contract (4H - OKX) AnalysisUNIUSDT Perpetual Swap Contract (4H - OKX) Analysis
1. Trend Analysis
Overall Bearish Trend:
UNI has been in a strong downtrend, forming lower highs and lower lows.
The price is still below EMA 50, EMA 100, and EMA 200, confirming bearish momentum.
A Break of Structure (BOS) occurred earlier, reinforcing the downtrend.
Potential Reversal Signals:
The price bounced off the demand zone (around 10.22 USDT) and is attempting a recovery.
It is now testing EMA 20, and if it can break above EMA 50, a short-term reversal may be confirmed.
A successful break of 12.158 USDT (TP1) could push price higher towards EMA 50 and 100.
2. Key Resistance & Support Levels
Resistance Levels:
12.510 USDT (EMA 50 & local resistance) → Immediate resistance that UNI must break to continue higher.
13.302 - 13.590 USDT (EMA 100 & Fib 0.618) → If price reaches here, expect stronger resistance.
14.680 - 15.037 USDT (Fib 0.786 & EMA 200) → A major resistance zone. If broken, UNI could enter a bullish trend reversal.
Support Levels:
11.098 - 10.922 USDT (Demand Zone & Previous Bounce Area) → Strong support where buyers stepped in.
10.22 USDT (Entry Level from Demand Zone) → If price retests this level, it must hold to prevent further downside.
9.066 USDT (SL Level) → If UNI breaks below this level, further downside is expected.
3. Risks & Concerns
Low Volume on Bounce:
The price has bounced, but volume remains weak, meaning this could be a short-lived recovery.
UNI needs a strong volume breakout above EMA 50 to confirm a bullish reversal.
Bearish Market Structure Still in Play:
Even if UNI moves higher, it remains in a downtrend unless it clears 13.590 USDT (EMA 100).
A rejection at 12.510 USDT could lead to another move downward.
EMA Resistance Overhead:
UNI is facing multiple moving average resistances (EMA 50, EMA 100, EMA 200).
If price struggles to break EMA 50 at 12.510 USDT, selling pressure may return.
4. Trading Strategy
✅ Long Scenario (If Bullish Breakout Occurs):
Entry: If price holds above 12.158 USDT (TP1 level).
Target 1: 12.510 USDT (EMA 50 Resistance)
Target 2: 13.302 - 13.590 USDT (EMA 100 & Fib 0.618)
Target 3: 14.680 - 15.037 USDT (EMA 200 & Fib 0.786)
Stop-Loss: Below 10.922 USDT (Demand Zone)
✅ Short Scenario (If Price Rejects at Resistance):
Entry: If UNI fails to break 12.510 USDT (EMA 50 Resistance)
Target 1: 11.707 - 11.098 USDT (Local Support Zone)
Target 2: 10.922 - 10.220 USDT (Demand Zone Retest)
Target 3: 9.066 USDT (Extended Downside)
Stop-Loss: Above 12.750 USDT to prevent being stopped out on a breakout.
5. Summary & Outlook
📌 UNI has bounced from a demand zone but still faces strong resistance at 12.510 USDT.
📌 A breakout above 12.510 USDT could signal a short-term bullish move towards EMA 100 (13.590 USDT).
📌 Failure to break resistance may lead to another drop towards 10.922 USDT or lower.
🔎 Recommendation:
Watch price action near 12.510 USDT—if it breaks with volume, it could be a long setup.
If rejection occurs, look for short opportunities back to 10.922 USDT.
Let me know if you need further adjustments! 🚀📊

UNIUSDT 1WUNI Update ~ 1W
#UNI If you still have Conviction on this coin,. Buy gradually within this support block,. With a short term target of at least 20%++. This coin is still in a bullish trend

UNIUSDTUNI ~ 3D ✅
#UNI Make purchases gradually in this pattern. it is only a matter of time until this resistance line is successfully broken.

UNIUSDTUNI ~ 1W ✅
#UNI Very good buying zone for BINANCE:UNIUSD , For now.
If retesting occurs,. This is a great opportunity. with a short term target of at least 20%+


UNI/USDT Break the key resistance area. Bullish Momentum ???💎 UNI has been a focal point in the cryptocurrency market, having recently achieved a significant breakthrough by surpassing a key resistance area and breaking out of a bullish pennant pattern.
💎 This advancement indicates a potential retesting phase at what was previously resistance, now serving as support. Successful retesting could pave the way for continued upward movement, with the next target being a strong resistance area.
💎 During this retesting phase, it's crucial for UNI to demonstrate a robust bounce off the support area to maintain its upward trajectory. Failure to hold this support level could result in UNI retreating to the demand area, specifically around the $6.1 mark.
💎 The $6.1 demand zone becomes a critical point for UNI. For the asset to resume its upward path, a strong rebound from this level is necessary, aiming to surpass and sustain above the former resistance level.
💎 This action is vital for continuing the upward movement towards the strong resistance. Conversely, if UNI fails to hold this demand level and breaks down, it could signal a shift towards a stronger support area.

UNI target 9.51D time frame
-
UNI is retesting the support zone of the double bottom structure. There are two targets for this double bottom, 9.5 and 12. Considering the market tends to weak recently, I suggest to close positions if go up to 9.5 in future.
-
TP: 9.5 / 12
SL: 5.5

UNIUSDTBINANCE:UNIUSDT Short idea
⛔"Daily crypto market analyses I provide are personal opinions & not financial advice. Trading carries risks, so do your own research & seek advisor's help.#DYOR"
Don't forget to like and comment

Long trade setup for UNIUSDTFor the BINANCE:UNIUSDT.P Long Trade Setup, the following values are suitable for our interval trade:
Entry: 1.340
Target: 1.393
Stop: 1.306
Cost Reduction: -
The profit is reasonable relative to the risk.
*This is not investment advice; you can lose money. Crypto AI Signals is not responsible for any trades. 🚫💰

UNI SWING SIGNAL WITH TERIGER LONGHello again dear traders
UNI currency is located on a pivot support zone in high timeframes such as daily
Also, a decrease in sales momentum can be seen in the 12-hour time frame with an upward divergence
You can enter long trades with your own trading style with the entry trigger.
Thank you for your support
I would be happy if you could comment your opinion.

UNI target 9.8~10.61D time frame
-
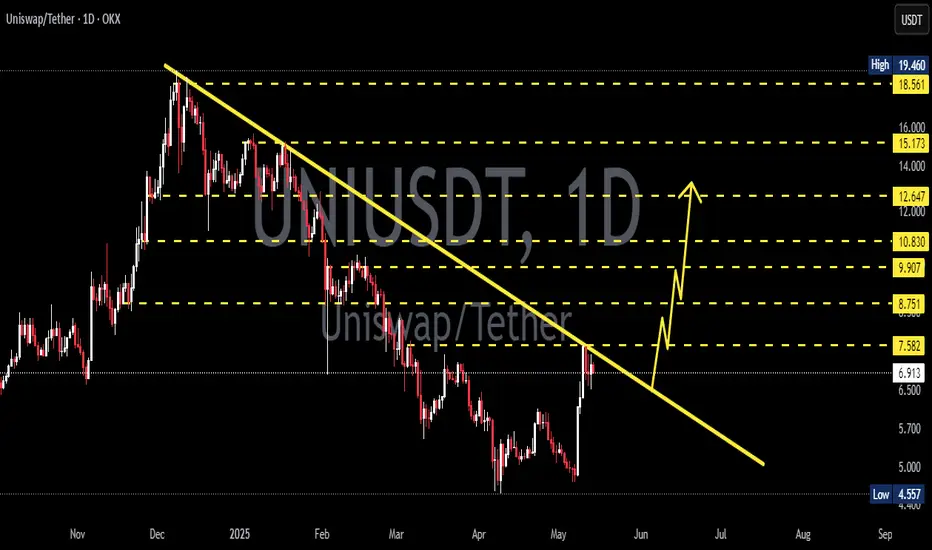
UNI broke the falling wedge structure.
Retesting is good to take entry and set trading plan.
TP: 9.8~10.6
SL: 4.515

UNIUSDT Elliott Waves AnalysisHello friends.
Please support my work by clicking the LIKE button👍(If you liked). Also i will appreciate for ur activity. Thank you!
Everything on the chart. (update)
Setup still alive.
Entry: market and lower
Targets: 7.5 - 10 - 12.5
after first target reached move ur stop to breakeven
Stop: ~3.7 (depending of ur risk). ALWAYS follow ur RM .
RR: 1 to 6
risk is justified
Good luck everyone!
Follow me on TRADINGView, if you don't want to miss my next analysis or signals.
It's not financial advice.
Dont Forget, always make your own research before to trade my ideas!
Open to any questions and suggestions

UNIUSDT Elliott Waves AnalysisHello friends.
Please support my work by clicking the LIKE button👍(If you liked). Also i will appreciate for ur activity. Thank you!
Everything on the chart.(update)
Targets: 7.5 - 10 - 12
Main Target zone: 12 - 15$
after first target reached move ur stop to breakeven
Stop: ~3.4 (depending of ur risk). ALWAYS follow ur RM .
Risk/Reward: 1 to 5
risk is justified
Good luck everyone!
Follow me on TRADINGView, if you don't want to miss my next analysis or signals.
It's not financial advice.
Dont Forget, always make your own research before to trade my ideas!
Open to any questions and suggestions.

UNIUSDT Elliott Waves AnalysisHello friends.
Please support my work by clicking the LIKE button👍(If you liked). Also i will appreciate for ur activity. Thank you!
Everything on the chart.(update)
Nothing has changed from my last idea, still waiting for upward movement.
Targets: 7.5 - 10 - 12
Main Target zone: 12 - 15$
after first target reached move ur stop to breakeven
Stop: agreesive 4.8, conservative 3.4 (depending of ur risk). ALWAYS follow ur RM .
Risk/Reward: 1 to 10
risk is justified
Good luck everyone!
Follow me on TRADINGView, if you don't want to miss my next analysis or signals.
It's not financial advice.
Dont Forget, always make your own research before to trade my ideas!
Open to any questions and suggestions.

UNIUSDT Elliott Waves AnalysisHello friends.
Please support my work by clicking the LIKE button👍(If you liked). Also i will appreciate for ur activity. Thank you!
Everything on the chart.(update)
Nothing has changed from my last idea,everything is relevant.
I think that we'll see 4.8 - 4.4 zone, it's will be perfect entry who out of pos.
Entry: market and lower
Targets: 7.5 - 10 - 12
Main Target zone: 12 - 15$
after first target reached move ur stop to breakeven
Stop: ~3.3 (depending of ur risk). ALWAYS follow ur RM .
Risk/Reward: 1 to 6
risk is justified
Good luck everyone!
Follow me on TRADINGView, if you don't want to miss my next analysis or signals.
It's not financial advice.
Dont Forget, always make your own research before to trade my ideas!
Open to any questions and suggestions.
