UOB is testing support, potential bounce Prices are testing support in line with our ascending trend line where we could see a bounce here
UOB

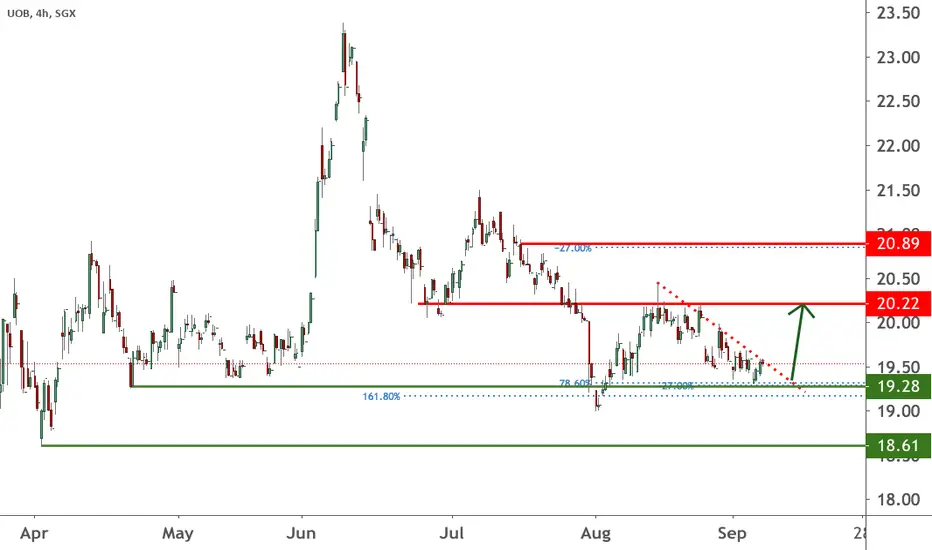
UOB could see further downside before it reaches supportPrices could push lower before it reaches our buy entry, in line with our graphical support area, 78.6% fibonacci extension and 78.6%, 127.2% Fibonacci retracement where we could see a bounce above this level.


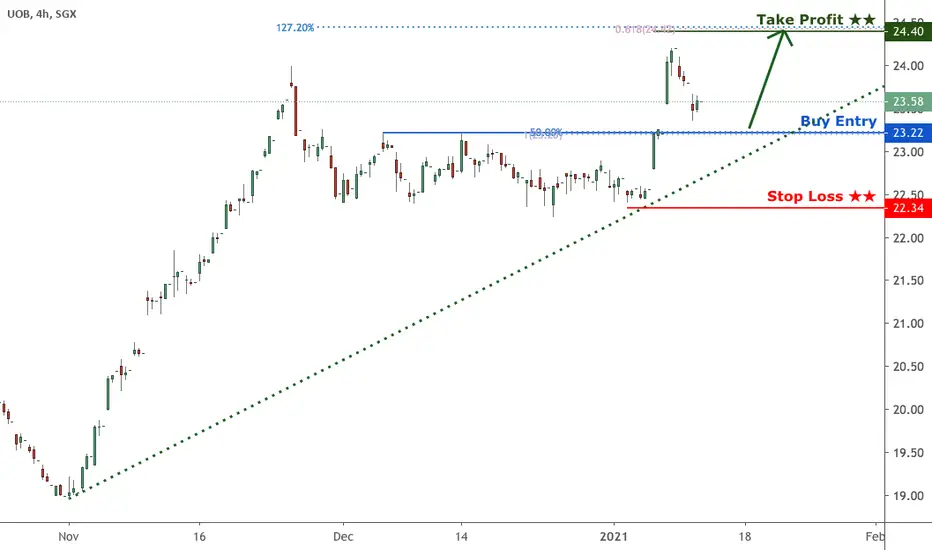
UOB is approaching resistance, potential reversalPrice is approaching our first resistance in line with our horizontal overlap resistance, 61.8% fibonacci retracement and 100% fibonacci extension where we could see a reversal below this level to our first support target.

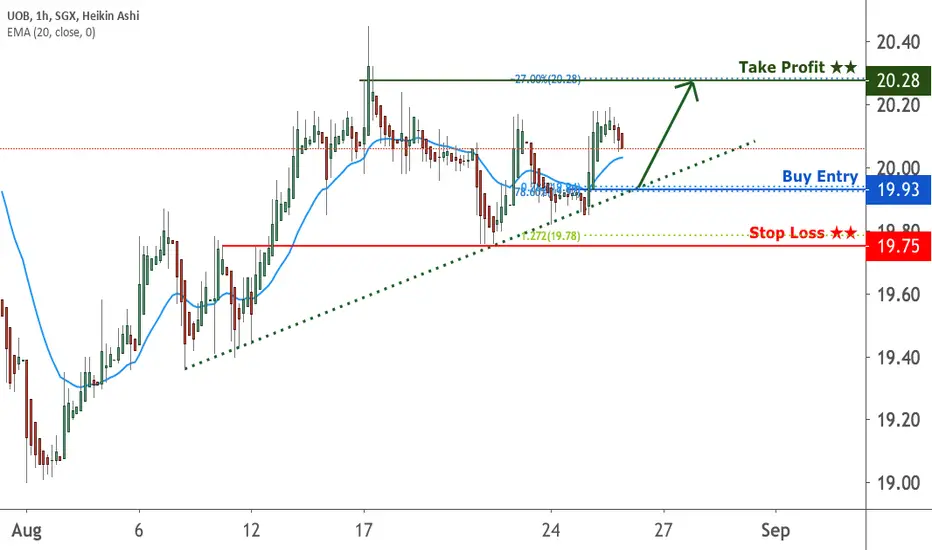
UOB is approaching support, potential bounce Price is approaching our first support in line with our 50% retracement, 100% extension and horizontal pullback support where we could see a bounce above this level to our take profit target.
UOB testing support, potential bouncePrice broke the descending trend line, a break that we have been waiting for, we could be seeing a further bounce above this level.

UOB bounced off key support, wait for break above trend linePrice bounced off a key support level and a break above our descending trend line could provide the bullish confirmation. I will only consider a long position after this trend line has been broken.
UOB approaching a key support level Price is approaching a key support level and a break above our descending trend line could see room for further upside.

UOB approaching support, potential bounce Price is approaching a key support level where we could see a bounce here
UOB Short PositionUOB Q2 Profits and Dividends Cut. Short position taken
M: Downtrend
A: Resistance
E: Bearish outlook and candle stick pattern
E: SL 19.70 RR 1.50
Entry Price: 19.45

UOB (U11) - Key levels to BUYHey everyone, here's my analysis on U11:
Summary
Price could drop lower to zone 1 between 13.18 - 14.24 before a bounce.
Action:
Buy Limit: 13.18 - 14.24
Analysis:
3 of the green zones highlighted above are support zones where we could see a bounce in price. Currently, given the situation that we are in with the Covid-19 outbreak yet to reach its peak, I lean towards seeing a further drop in price from its current level to zone 1 at 13.18 - 14.24 before a bounce, as illustrated by the yellow dotted lines. If price breaks below the key zone at 13.18 - 14.24, it is likely to test zone 2.
Disclaimer: There is a very high degree of risk involved in trading and investing. Past results are not indicative of future returns. Trading BEAN and all individuals affiliated with this site assume no responsibilities for your trading and investment results. All contents featured here are solely for educational purposes and ARE NOT investment or trading advices. Please do your own due diligence and trade at your own risk.

SG UOB with a suspected H-S-T pattern, decline target $21.3It seems like SG UOB has been charting out a H-S-T patterns over the past 1 year.
And similar pattern can be found in another SG bank stock - DBS.
What makes UOB's chart interest is its complex variation from the classic H-S-T pattern. Everything in this construct came "double". It two double-headed S and arguably a double-headed H. Even the retraction from the breakout line also happened twice (one in end nov early Dec, and the other one in last week).
If today's decline marked the end of the rebound, it' possible that the double-headed retraction was also done. As the next stage, the price might plunge through the breakout line again, and hit the minimum decline target i.e. $21.3.
Let this analysis be tested by time!
P.S. I am interested to see if it ends up with a double-tap at $21.3 range.

UOB - Short term downside potentialFor those interested in Singapore equities market, here's one potential setup.
Price has been rallying since the low in 2016 @ 16.77 to the recent high in 2017 @ 24.59. Price has developed a complete 5 waves structure, and according to Elliott Wave principle, we are now expecting a potential 3 waves retracement.
This gives us a potential short term trade targeting 22.66 - 22.94 area.
Disclaimer - do your own due diligence before shorting this stock.
