DAL - Upside Extension Toward ATH Looks PossibleDAL - CURRENT PRICE : 64.20
DAL is showing a strong bullish breakout as price surges above the key horizontal resistance near 64, supported by rising volume and a clean reclaim of both the EMA50 and EMA200. Today’s breakout candle signals renewed momentum, while the ascending trendline beneath reinforces a steady higher-low structure. RSI pushing above 60 reflects strengthening buyers without entering overbought territory. With this decisive breakout, DAL may build momentum toward higher resistance levels and potentially work its way toward challenging its all-time high zone if buyers continue to control the trend. Bias remains bullish above 58–60 support, with further upside favored as long as the breakout holds.
ENTRY PRICE : 64.00 - 64.40
FIRST TARGET : 69.00
SECOND TARGET : 74.00
SUPPORT : 58.00
Uptrend

PATH - Price Reclaims 50-EMA and 200-EMAPATH - CURRENT PRICE : 14.50 - 14.70
PATH is gaining traction after reclaiming both the 50-EMA and 200-EMA, signalling a shift back into short-term bullish momentum 📈. Price strength is supported by rising RSI and an improving MACD cross, suggesting buyers are regaining control.
🔥 Bullish Points
Price reclaimed 50-EMA and 200-EMA
RSI trending above 50 → bullish momentum returning
MACD turning positive with increasing histogram
Volume uptick on recent green candles = buyers active
ENTRY PRICE : 14.50 - 14.70
FIRST TARGET : 16.00
SECOND TARGET : 17.30
SUPPORT : 13.00

SMCI cools the servers while the market warms up expectationsSMCI continues to move inside an ascending channel and is currently trading in the buy zone between the 0.618 and 0.786 Fibonacci levels. Strong demand appears within this range and the ma200 adds structural support as a dynamic base. Weekly divergence indicates weakening selling pressure and increases the probability of a renewed upward cycle. As long as price holds above the ma200 and stays within the channel, the structure remains bullish with the next targets at 41.88 and later at 62.35.
Super Micro Computer remains one of the global leaders in artificial intelligence server infrastructure. As of December 4, trailing twelve month revenue stands near 14.9 billion dollars. Net income exceeds 850 million dollars and cash reserves remain above three billion dollars. The company expands production of liquid cooled systems and next generation platforms for advanced model training. Global demand for artificial intelligence compute capacity continues to strengthen revenue and support margins. Minimal debt levels provide stability during market volatility.
As long as price remains within the buy zone between the 0.618 and 0.786 levels and above the ma200, the bullish continuation scenario remains valid. A confirmed breakout opens the way toward 41.88 and later toward 62.35. Technical and fundamental signals currently align which increases the probability of a new upward wave.
Servers cool down slowly, but trends usually heat up faster, especially with charts like this.

XAUUSD – Fresh Intraday + Weekly OutlookGold is sitting in a key decision zone right now. After last week’s strong push, the market is correcting but still holding the broader bullish structure. We’re basically in the classic phase where the market tests whether the upside trend is ready to continue or if we’ll get a deeper pullback first.
**Where price stands:**
– Still inside the 4H ascending channel.
– Holding above the main support cluster at **4170–4160**, a zone packed with volume and previous absorption.
– Trading beneath the heavy supply area **4235–4245**, which rejected price last time.
– The current pullback has only reached the 38–50% retracement of the latest rally, which is typical of a healthy correction, not a trend reversal.
**Intraday scenarios I’m watching:**
**1. Bullish rotation back into 4230–4240 (most likely while above 4190–4180)**
Signs to confirm:
– Price holds above VWAP or reclaims it.
– 5m–15m MACD turns up or shows bullish divergence.
– Volume drops on the downside and reappears on the buy side near the mid-Bollinger band.
Targets: **4230 first**, then **4235–4240** where the real test sits.
**2. Deeper correction toward 4175–4160**
Triggers:
– Clean breakdown below 4190 with growing sell volume.
– 15m MACD accelerating below zero.
– Price failing to re-enter the Bollinger mid-band after pushes.
Support zones:
– **4180–4175**
– **4170–4160** (major support / best demand zone)
If buyers defend that region again, it becomes a solid area to look for upside continuation.
**3. Full breakout squeeze above 4240**
Less likely immediately, but possible if USD/yields stay weak. In that case, **4245–4250** comes quickly into play, and a move toward the upper side of the 4H channel could follow.
**For the rest of the week:**
As long as 4160–4170 holds, the higher-timeframe trend stays bullish. The only thing stopping gold right now is the supply layer at 4235–4245. If the market spends several sessions failing there, we could see a wider range forming between 4170–4240. If it breaks with volume, the trend extends.
**What I’m monitoring now:**
– Price reaction vs. VWAP
– Volume behavior at both extremes
– Divergences on 5m–15m
– USD and yields (still the biggest driver this month)
This type of movement — impulse → range → sharp pullback → decision — is extremely typical for gold before choosing its next leg. The structure still slightly favors continuation higher, but the real confirmation will happen around **4235–4245**.

STLA - Golden crossSTLA had a Golden Cross on November 18, 2025. Now it will begin the recovery phase for this stock. The stock price is above all MA20, MA50, and MA200. Both RSI and MACD indicators support the uptrend. Hopefully, this prediction is accurate.
The price on 11.28.2025: $10.66 (Entry).
Price target: $11.43/ $13.12/ $17.81/ $25.38
Stop loss: $10.14.
IMO, amateur trader.
Good luck!

GBP/AUD: Upside Potential from High Volume ZoneCurrent Situation:
GBP/AUD price reached the resistance level at 2.03417, where limit players halted the upward movement and pushed the price down into a high volume zone. A small reversal structure is forming in this area, indicating a possible resumption of growth.
Primary Scenario:
We expect continuation of upward movement from the current support zone. The presence of an unfilled gap above confirms the probability of price attraction to these levels. The high volume zone serves as a platform for building buying interest from institutional participants.
Target Levels:
Primary target: filling the gap above current levels
Secondary target: updating the high around 2.03417 and beyond
Alternative Scenario:
If price fails to hold within the high volume zone and breaks below it with increased selling volume, this will invalidate the bullish scenario and open the path for a deeper correction.
Trading Plan:
Entry Zone: Current high volume zone (position already opened)
Key Resistance: 2.03417
Support Level: Lower boundary of the high volume zone
Position Management:
Monitor price development in the reversal zone. Upon confirmation of upward movement, partial profit-taking is recommended as price approaches the 2.03417 level, followed by trailing the remaining position.
Risk Management:
Stop-loss should be placed below the high volume zone to protect against the alternative scenario realization.

A clear long term support that could be used to buyIn the last 5 years this has been a multi year support, many instances we went up from here.
Also ex dividend payment on 24 nov, some free money.

TMB (Tamilnadu merca bank) right to enter for swing ??no, this is not right time to enter swing . as per my anlysis ,choch happened, after choch it need to colloect poi. my entry at 455 and sl at 424 and my target at 796..
all my analysis for educational purpose only

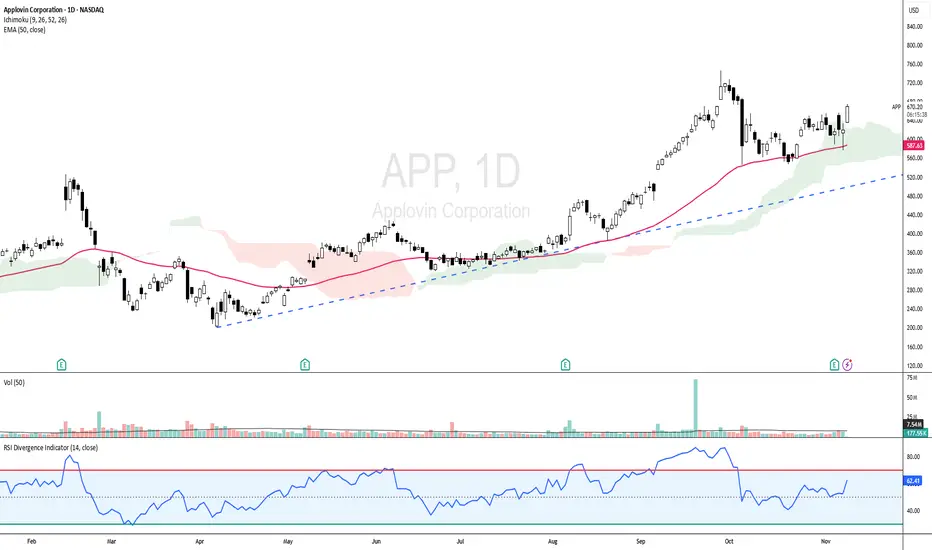
APP - UPTREND STILL INTACT!APP - CURRENT PRICE : 670.00 - 674.00
APP is showing strong bullish momentum as the price trades above the 50-day EMA and ICHIMOKU CLOUD , indicating a sustained uptrend. The RSI is in bullish territory but not yet overbought, indicating room for further upside. With the current setup, the stock has potential to retest its all-time high area if momentum continues.
ENTRY PRICE : 670.00 - 674.00
FIRST TARGET : 727.00
SECOND TARGET : 770.00
SUPPORT : 50-day EMA
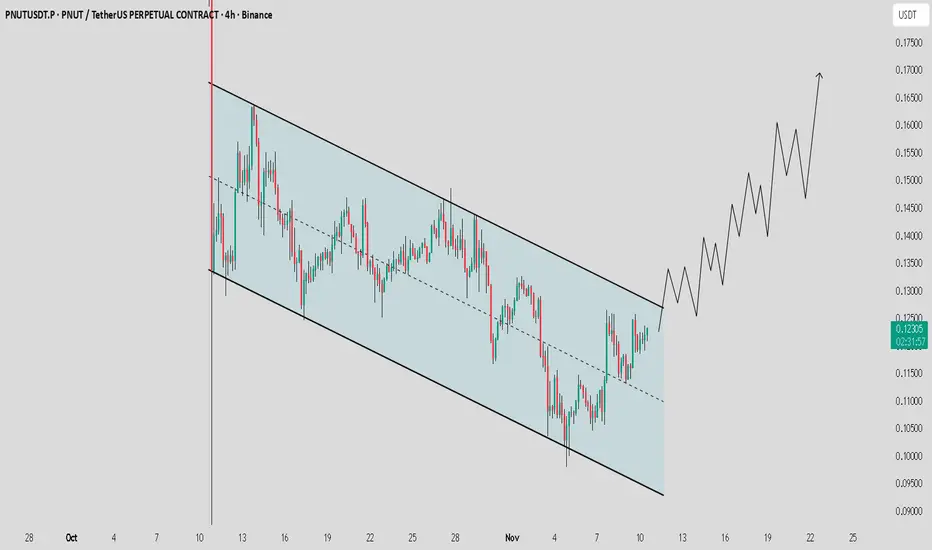
PNUT / USDT : Breakout from channel could ignite a strong rally
PNUT / USDT is moving cleanly within a descending channel and has now bounced from the mid-zone, heading towards the upper resistance line.
A confirmed breakout with volume could trigger a strong rally towards $0.18 - $0.22 in the coming days.
Watch for confirmation and manage risk wisely.
Nifty Metal Index NIFTY METAL INDEX Updated Chart for members Reference.
On Big Breakout (BO). On Confirmation Big rally on card 🧐
Support, Resistance /BO level, Tgt, Updated Tgt Marked in Chart.
Stocks to be noted
TATA STEEL
HINDALCO
JINDAL STEEL
SAIL
NMDC & NMDC STEEL
GALLANT ISPAT
WELSPUN
GPIL

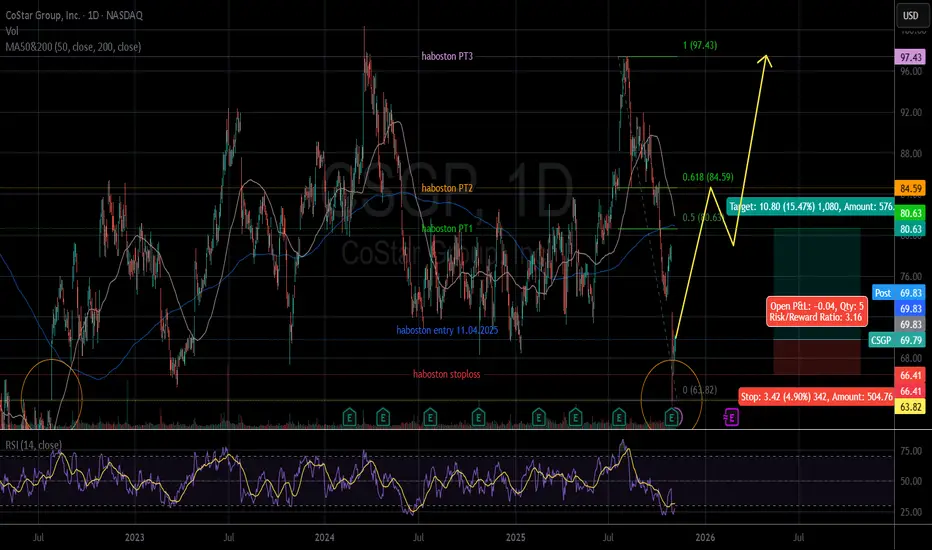
CSGP - Bullish, Reversal and rising againLast week, CSGO filled the gap at $63.82 on 27/07/2022.
So, the correction wave is over.
Use Fibonacci retracement to determine price targets.
The price after hour 11.04.2025: $69.83 (Entry).
Price target: $80.63/ $84.59/ $97.43
Stop loss: $66.41.
IMO, amateur trader.
Good luck!
Grab (GRAB) – Riding the Trend WaveGrab is looking grabbingly strong 😎 — making higher highs and higher lows since 7 April 2025, up almost 95% until 23 September 2025!
The stock broke out of its downtrend line from 21 Nov 2024 with big volume on 11 Sep 2025 — strong confirmation that bulls are taking charge. After the breakout, price retested the trendline (now support) twice and also bounced right from the Fibonacci 38.2% zone. Beautiful confluence! 🎯
The uptrend line from April is still holding well — as long as this stays intact, the party’s not over yet 🕺
📈 Trade Idea:
Entry zone: 5.65 – 5.37
Targets:
TP1 👉 6.60
TP2 👉 7.10
Support / Invalidation: 5.37 zone, uptrend line, or old downtrend line turned support
Summary:
Grab is acting like a true comeback kid 💪 — breakout ✔️, retest ✔️, uptrend intact ✔️.
If momentum keeps building, we might be seeing the next leg up soon! 🚀

SOFI — Bullish Breakout with Strong VolumeSOFI has broken out to a new all-time high with strong volume, signaling strong buying pressure and renewed bullish momentum.
The stock remains in a clear uptrend, trading above the 50-day EMA. Recently, SOFI rebounded perfectly at the EMA 50, confirming it as a strong dynamic support zone. The bullish pennant pattern breakout further strengthens the case for a trend continuation.
The uptrend line is still intact, and as long as the price holds above the EMA 50, the bullish outlook remains valid.
Entry Price : 31.00 - 32.00
Stop Loss: Below EMA 50 (~26.80–26.90)
Targets: 35.00 and 38.00

NASDAQ Watching 24,975 for Fresh Bounce in Ongoing UptrendHey Traders,
In tomorrow’s trading session, we are monitoring NAS100 for a buying opportunity around the 24,975 zone. NASDAQ remains in a broader uptrend and is currently undergoing a healthy correction, approaching the key 24,975 support and resistance area that aligns with the ascending trend structure.
If buyers step in at this level, we could see a continuation of the bullish momentum in line with the prevailing trend.
Trade safe,
Joe

Stage Analysis of ORISSAMINEStock has formed a good base after stage 4 and gave a breakout after 6 months of consolidation with huge volume.
It is now coming in stage 2 after breakout.

BTCUSD EMA50 Breaked and bullish trend breakdown (Readmore)..🚨#BTCUSD Technical Update 🚨
📉 Bitcoin shows bearish momentum after a confirmed uptrend breakdown and EMA 50 breach on the 1H timeframe.
🔍 Price action suggests sellers are taking control, with momentum shifting to the downside.
🎯 Selling Targets:
1️⃣ First Target: $106,400
2️⃣ Second Target: $104,500
⚠️ Invalidation: A sustained move back above the EMA 50 could signal a potential recovery — stay cautious and manage risk carefully!
#Bitcoin #BTC #CryptoAnalysis #TechnicalAnalysis #BTCUSD 💰📊

$GLW Bull FlagA high quality company within a strong uptrend. Consolidating in a bull flag as volume drops off. Earnings in one week time could be the catalyst which finally pushes this past $100 and beyond.

XAUUSD Bearish analysis EMA50 Breakdown 📉 XAUUSD (Gold) Technical Update 💰
Gold faced strong rejection from the major supply zone around 4375 🔻
After breaking below the 50 EMA, bearish momentum is clearly building on the 30M timeframe ⚙️
Current Price: 4330 🟡
🎯 Technical Targets:
1️⃣ 4313 – First support level
2️⃣ 4287 – Second target zone
📍 Key Demand Zone: Around 4207, where buyers may look to step in again 🏦
💡 Bias: Bearish below 4375 / Watch for reactions near 4313 and 4287 for potential short-term scalps or pullbacks.
#XAUUSD #Gold #PriceAction #ForexAnalysis #TechnicalAnalysis #TradingSetup #BearishTrend 📊

USDJPY: Waiting for a pullback signal on the lower timeframe
* Trend: assessed using at least three trend indicators, with market structure as the primary guide.
** Weak or Reversal Signals: Assessed based on one of our criteria for trend reversal signals.
*** Support/Resistance: Selected from multiple factors – static (Swing High, Swing Low, etc.), dynamic (EMA, MA, etc.), psychological (Fibonacci, RSI, etc.) – and determined based on the trader’s discretion.
**** Our advice takes into account all factors, including both fundamental and technical analysis. It is not intended as a profit target. We hope it can serve as a reference to help you trade more effectively. This advice is for informational purposes only and we assume no responsibility for any trading results based on it.
George Vann @ ZuperView

USDJPY D1 TRADE IDEA FRAMEWORK, FOR 20TH OCT, 2025.The UJ market is overall on an uptrend and currently in and out of range, which seems the price is trying to retrace downwards a bit to fill the Gap Area indicated below.
Now let's talk a little bit about Market Gaps...
One of the regular behaviour of the markets that happens is that usually after a sessional jump(GAPS) most times which is created after the weekend of a past trading week, the markets usually most times make a Gap because of the lack of trading activity over the weekend that create a void in prices, so in other for the market to create a balance before the market continues in its determined direction? It usually, as always, comes back to fill the Gaps of inactivity before it resumes on a balanced trajectory.
This is why, in most cases, holding trades over the weekend isn't advisable to avoid overnight fees, swaps, and drawdowns in capital or profits when holding a position, especially when under-capitalized, because these kinds of Gaps or Jumps in price happen due to fresh information that comes into the market before a new session begins.

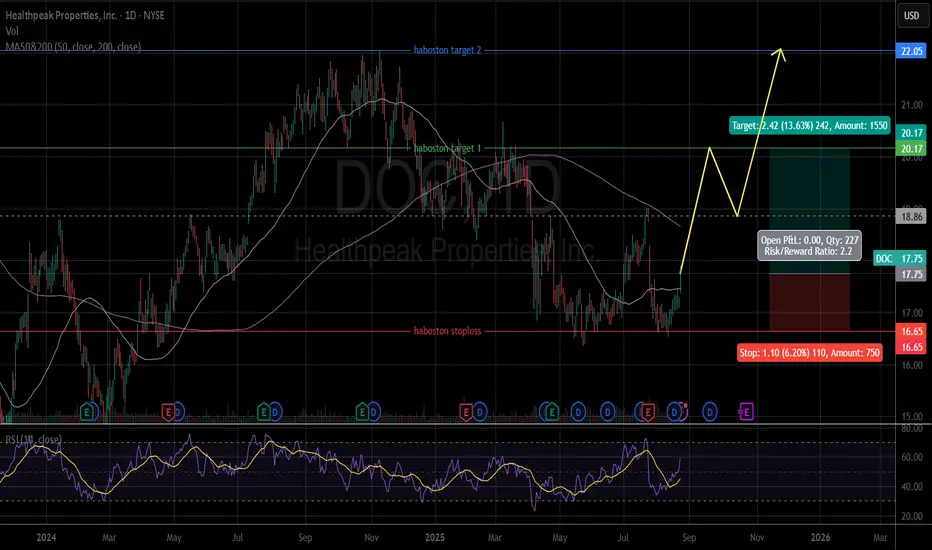
DOC - Uptrend. DOC's price above MA50 and under MA200.
. We have strong support at $16.65.
. Volume was above average last week.
. RSI show uptrend continues.
The price now (Closed on 08.22.2025): $17.75.
Price target: $20.17/ $22.05.
Stop loss: $16.65.
Risk/ Reward ratio: 2.2.
IMO, amateur trader.
Taking a trade on DOGE/USDTI’m a new trader and just started sharing my experience here. This is not financial advice, so take your own risk
