US100(NASDAQ) : Short Trade , 1hUS100 sell Entry : 12475.8 Stop : 12826.8 , Target1 : 12124.9 , Target2 : 11773.9 Risk/Reward Ratio ; 2UShortby mrAT_Trader223
US100 ( High Probability SELL Setup SOON ) * Here we can see the Next Moves for US100 today, * We're expecting the Mini Move ( PullBack ) before the continuation of the Down Trend, * We're Using STF for a cClearer View of our Analysis, Therefore we can't predict the duration of the moves, * We've got a Major Fundamental News today ( NFP ) at 1:30pm ( GMT + 00:00 ) London Time, * Keep a close eye on Nasdaq100 ( US100 ) Today, * Happy pip hunting traders. * FX KILLA * UShortby FX-PIPHUNTER446
#US100 - next trendAs you can see on the chart, it is about to touch a major resistance, so I can speculate three possible scenarios: - Cup & Handle Pattern, which could give us a significant retracement and then take a long position - It could hit resistance, have minimal retracement, and touch resistance again, so we could possibly see a Double Top, or a Head & Shoulders - It could break through the resistance without any problem, touch it again, and we could expect some bullish momentum. Let's see ✍🏽by icheeetah1
US100(NASDAQ) : Short Trade , 4hUS100 sell Entry : 11423.5 Stop : 11668.4 , Target1 : 11182.7 , Target2 : 10933.9 Risk/Reward Ratio : 2UShortby mrAT_Trader5
Nas 100 NAS 100 daily analysis on a 4H chart. The overall market is bearish and the price current is moving sideways. It will be wise to wait for a breakout before one can take a position. by chazabasil0
US100 Nasdaq NQ We have the price in the supply zone and we have also liquidity in price between 10817 to 10869 so the price will target it . Uby NinoTrade_1m220
US100, NASDAQ FUTURE , 12/27/2022THE GREAT ENTRY WITH SMALL STOP LOSE The great entry with small Stop lose , 160$ Hit 2120 $ Profit RR:1.13 UShortby NinoTrade_1mUpdated 1
US100 the end of the year is coming!Hello; Here is my view on the $US100; our friend Powel is starting to reduce the strength of the increase in key rates, an encouraging signal. But the macro is often decorrelated from the micro economy; for example the insolvency of American loans is increasing as are the delays in payment of imo loans. First signs of the 2008 crisis; I invite you to see the super movie: The Big Short! - The industry through the PMI index suffers worldwide (50 Neutral; more than 50 Growth and less than 50 Slowdown): zupimages.net .png - For the PMI Composite (Industry, services and construction) therefore highly representative of the health of a real economy is not doing any better: zupimages.net /vysk.png So this period in the markets for me is a temporary lull to wait for the end of the year before choosing a real direction. Liquidity is present in a significant way at the bottom as well as at the top, and the choice of direction is not ours, so let's limit our risk. Because the situation can quickly deteriorate, with a contagion of the consequences of the recession, to various sectors. To analyse : Price location: - After the Covid bottom of March 25, 2020 at 6900 points, the Nasdac rose 144% to put an ATH at 16,650 points. - Since this rise we have retraced a maximum of 37.1% at 10,470 points in 280 days of decline, to go below the equilibrium at 11,700 points (green line). Evolution of the price and personal vision: - We see that since the low point of 10,400, the price rises between two liquidity zones (Box at the bottom Green/Red and at the top Blue, with the $ symbols). - If the Range price is in waves 2,3 and 4, the standby liquidity will only grow, while allowing time for smart money to settle. - During this Range, Fakeaout or Breakaout are highly possible because two major Fibonacci levels are there and therefore, stops or TP retails. - I think that at the end of February a direction should be taken. For me wave 5 will be violent, and decisive for the next 6 months! I therefore propose 2 possible entries, Long and Short, both with an R/R of 4: The short position (line 5 in Red) corresponds to JP Morgan's target of 10,000 points, for fans of Fud. To quote a positive: The OBV, which had fallen to Covid levels, is recovering and printing beautiful Ws and respecting a trend line: zupimages.net If the trend line breaks, it will not be a good signal for me. Personal Conclusion: So I think we could put away some time to create standby liquidity, to pick it up in typical range moves. We must remain cautious and look for entries such as smart money, ie in these areas of potential TP/SL with judiciously placed SLs. The market is not giving gifts at the moment, think about your currency management! Uby Oudamska8
US100 NasdaqBEARISH CHANNEL in Long Time Frame #LTF and Rejection from the Lower Trend Line #LTL Break Of Structure #BOS BULLISH CHANNEL in Short Time Frame #STF as a Corrective Pattern will complete its Correction at 38.20% of Fibonacci Level according to Elliot Waves Selling Divergence by ForexDetective8
US100 (High Probability BUY Setup SOON)!!!! Here we can see the next move for NASDAQ100 (US100) on the M15 time frame we're using for a clearer view of our analysis, Do remember we're still in a Continued DOWNWARD MOMENTUM, The over night rally has been sold into & there's scope for further BEARISH PRESSURE going into this session, So bare in minds this is going to be a quick SCALPING uptrend move before the CONTINUING of the bearish move, Keep a close eye on US100 in the coming hours, HAPPY PIP HUNTING TRADERS. ULongby FX-PIPHUNTER227
US100price advanced in a bullish impulse and has Brocken above our descending triangle which was taken as a correction expecting price to continue bullishULongby mashuduzandile42
NASDAQ (US100) - Still bearish ✅Hello traders! ‼️ This is my analysis on US100 . Here we are bearish from all timeframes perspective, so I am looking only for shorts. I expect price to make a retracement after taking out sell side liquidity and look for a short after filling the imbalance or rejecting from bearish orderblock. Like, comment and subscribe to be in touch with my content!UShortby Snick3rSD8
US100 - DAILYDaily: Price is at its supply zone region. crossing up will take it to 12000ish region, and then trend-line, afterwards .618 fib level of previous LH to LL. A falling small trend line may also act as resistance. There is a pattern here on Daily Time Frame: after completing and achieving its leg target (purple lines), price retraces a bit around 12% (marked in green circle), and then falls approx. 14% down (marked in yellow circle). it happened twice. Now, price did retraced 12% recently. But will it go back down 14%? we will have to wait and seeUby Moji19904
NASDAQ (US100) - Short from bearish orderblock ✅Hello traders! ‼️ This is my analysis on US100 . Here we are still in the bearish market structure for almost all timeframes, so I am looking only for shorts. I expect price to make a retracement to fill the imbalance after taking out sell side liquidity and then to reject from bearish orderblock. Like, comment and subscribe to be in touch with my content!UShortby Snick3rSD2211
Descent to 10100.00Hello A precious blow... we will come out with a profit soon... SELL @us100 TP : 10150 GOOD LUCKNShortby issam-chakour1
NASDAQ (US100) - New expansion expect ✅Hello traders! ‼️ This is my analysis on US100. As I said in my previous post, I expected price to fill the imbalance and to reject from resistance, we can see that and after broke the market structure on a lower timeframe I expect to continue bearish price action. Like, comment and subscribe to be in touch with my content!UShortby Snick3rSD3315
NASDAQ (US100) - Short from resistance ✅Hello traders! ⁉️This is my analysis on US100. Even if we have a strong bullish momentum here, on a higher timeframe we are in a bearish market structure. I expect price to continue the retracement to fill the imbalance and then to reject from resistance. Like, comment and subscribe to be in touch with my content!UShortby Snick3rSD12
US100 Triangle Pattern on 1Hr TFTriangle Pattern Long in case of an above breakout Short in case of a below breakoutUby sanasaeed442
US100 NASDAQ Technical Analysis and Trade IdeaTaking a look at the US100. In the video we discuss key levels of support and resistance, the trend, price gaps and a possible trade opportunity. As always everything explained in detail in the video, not financial advice. NAS100 analysis.UShort04:41by fxtraderanthony111
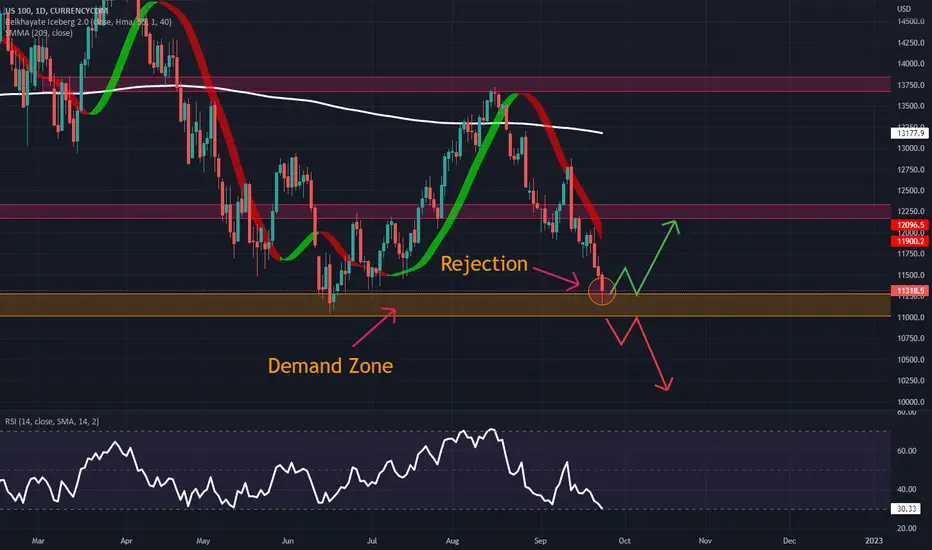
US100 AnalysisAfter we have had a rejection at the level of the demand zone we will see either a correction at the level of 12000 or if we will have a breakout and a close of a candle above the demand zone we will see a continuation of the downtrendUby Herotraderfx0
⁉️ US100 - Market AnalysisHello traders! ⁉️This is my analysis on US100 . Here I expect bullish price action as price rejected from bullish orderblock. I am looking for a long position if price breaks the structure and retrace a little bit. Like, comment and subscribe to be in touch with my content!ULongby Snick3rSD2210
us 100 dailyThe us100 continues to head lower, if you even look at the monthly candle it suggest to prices heading even lower. will see how we move this week.UShortby Vamacrypto2
NASDAQ-True analysisAccurate analysis. That's an update. Based on my analysis for US30 on Aug 17. To be Notified about the analysis, follow me and contact me if you have any comments or questions. (I will answer whenever I have time).by Ario_trader1