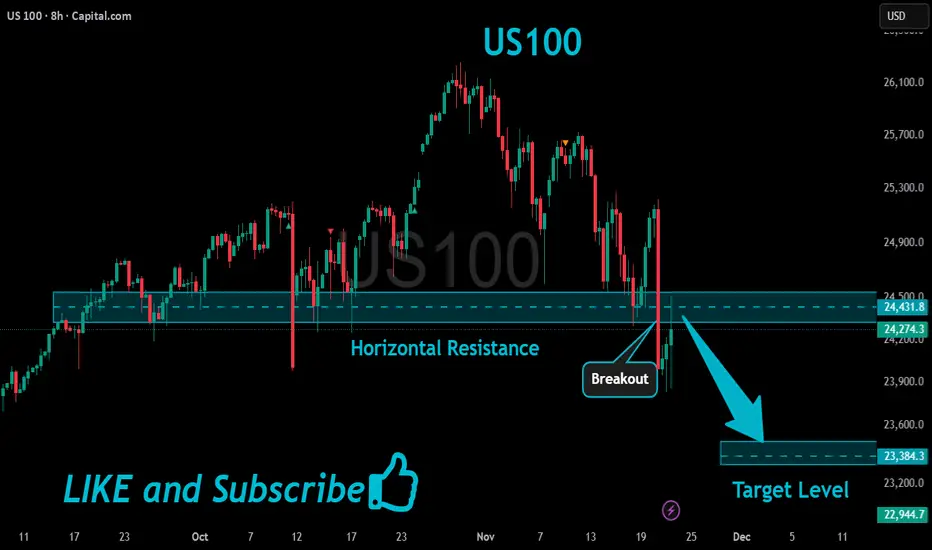
US100 Potential Short!
HI,Traders !
#US100 is making a rebound
But we are bearish biased
And after hits the
Horizontal resistance of 24431.8
We will be expecting a
Local bearish correction !
Comment and subscribe to help us grow !
Us100analysis
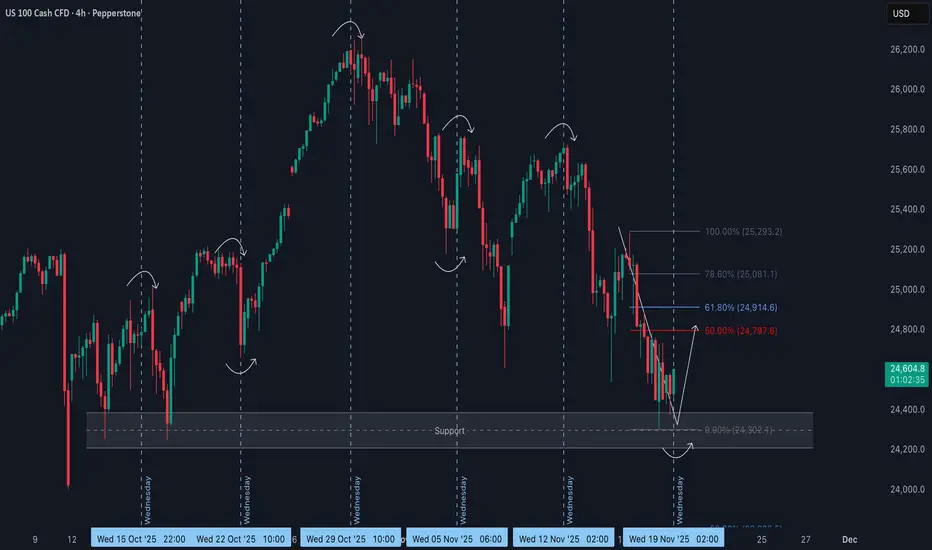
NAS100 Wednesday Reversal Potential from Key SupportOver the past several weeks, the NAS100 has shown a clear tendency for aggressive mid-week reversals, with Wednesdays repeatedly triggering sharp shifts in direction 🔄. This pattern suggests a strong time-based element in the algorithmic delivery of price, rather than random fluctuation.
🗓️ Each Wednesday has produced a notable reaction, whether through a liquidity grab, a stop run, or a full intraday reversal. With today being Wednesday once again, the timing aligns perfectly with the type of behaviour the market has been delivering consistently.
📉 The current decline has brought price directly into a well-defined high-timeframe support region. This area has a history of accumulation and typically holds a large amount of resting liquidity underneath it. The repeated wicks into this zone resemble classic Wyckoff spring behaviour 📦 — a sweep of sell-side liquidity followed by a potential response from larger players.
📐 The most recent bearish leg is noticeably overextended and has not offered a proper retracement since breaking lower. This leaves inefficiencies behind and increases the likelihood of a move back toward equilibrium.
🔄 Given the confluence of mid-week timing, the tap into higher-timeframe support, the liquidity sweep, and the extended nature of the current downswing, the expectation is for at least a corrective move back into equilibrium 📈.
A bullish break of short-term structure on the lower timeframes would strengthen this bias and open the door for a retracement into the premium levels listed above.
⚠️ Not financial advice. This is simply a technical outlook and my opinion.
NASDAQ Signal : US 100 H1 / H4 : long !!!Hello Traders! 👋
What are your thoughts on NASDAQ ?
This correction could offer a buy-the-dip opportunity, with potential for a move back toward the recent highs.
NASDAQ ( US100 ) :
Market price : 24400
Buy limit 1 : 24200
buy limit 2 : 24000
Tp1 : 24600
Tp2 : 25000
Tp 3: 25700
Tp 4 : 26300
SL : 23700
Traders, Don’t forget to like and share your thoughts in the comments! ❤️
Remember this is a position that was found by me and it is a personal idea not a financial advice, you are responsible for your loss and gain.

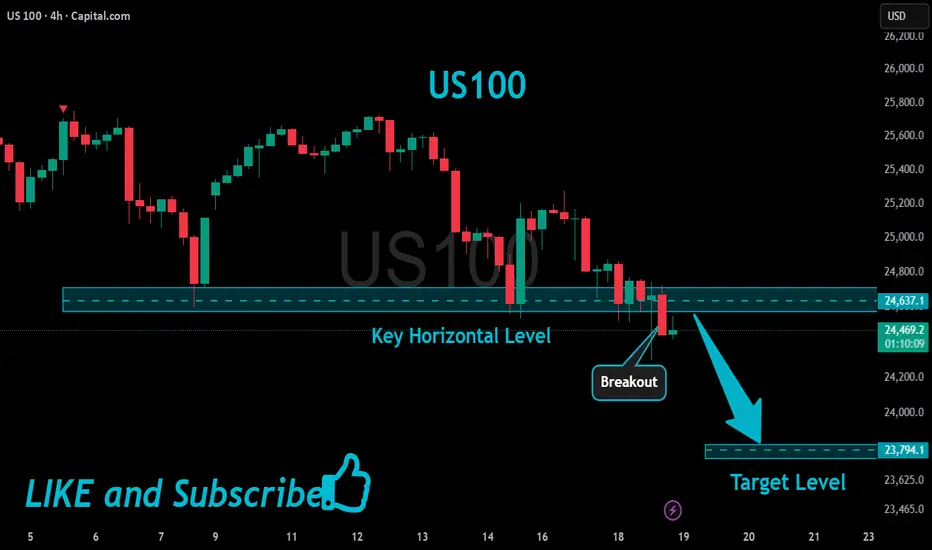
US100 Will Keep Falling!
HI,Traders !
#US100 keeps falling down
And made a strong
Bearish breakout of the key
Horizontal key level of 24637.1
And the breakout is confirmed
So we are bearish biased and
We will be expecting a further
Bearish move down !
Comment and subscribe to help us grow !
US100 Resistance Cluster!
HI,Traders !
#US100 made a bullish
Rebound But has now Near hit a resistance
Cluster of the horizontal and
Falling resistance lines
Around 25395.4 area From where we will be
Expecting a bearish move down !
Comment and subscribe to help us grow !

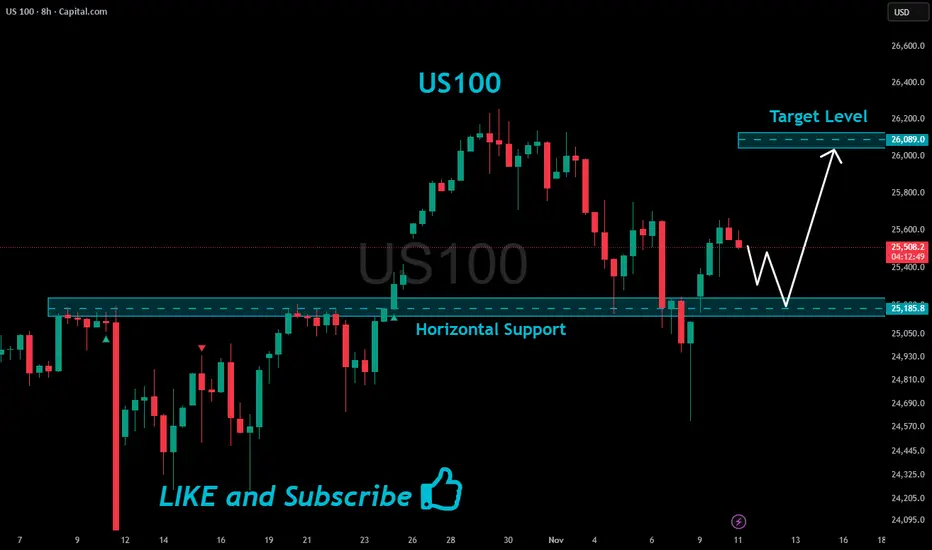
US100 Support Ahead!
HI,Traders !
#US100 is making a local
Bearish correction but
We are bullish biased mid-term
So after the pair hits the horizontal
Support of 25185.8 we will be
Expecting a local bullish rebound !
Comment and subscribe to help us grow !
US100 Resistance Ahead!
HI,Traders !
US100 is making a
Nice bullish correction
After a sharp local flash-crash
But a local horizontal resistance
Level is ahead at 25185.8
So after the retest we will
Be expecting a local
Bearish correction !
Comment and subscribe to help us grow !

US100 Will Hit Resistance Soon!
HI,Traders !
#US100 keeps growing
And the price will soon
Hit a horizontal resistance
Of 25817.8 from where
A local bearish correction
Is to be expected !
Comment and subscribe to help us grow !

Nasdaq 100 – A Quiet Accumulation Before the Next PushThe Nasdaq 100 (US100) is showing early signs of a structural rebalancing after the recent correction. Price is currently hovering near 25,600, retracing modestly after a short-term rebound from the 25,280 demand zone — a level where Smart Money seems to have re-entered quietly.
💭 1️⃣ Market Structure – A Story of Displacement and Repricing
The current chart reveals a clear Break of Structure (BOS) followed by a corrective pullback.
After the previous sell-off, price found support at the 25,280 – 25,300 range — a discount zone aligning with both an order block and a trendline confluence.
This zone likely served as institutional demand, where Smart Money began accumulating long positions before the upward displacement.
The recent retracement, however, remains within a corrective structure, meaning we could still see one more liquidity sweep before the market decides its next major leg.
🩶 2️⃣ Supply & Demand Zones – The Footprints of Institutions
Karina is currently tracking three zones that matter most to the structure:
Demand Zone:
25,280 – 25,300: The base of institutional accumulation and current structural support.
Supply Zones:
25,970 – 26,160: A major bearish order block where Smart Money previously distributed positions — likely the next liquidity target.
The most probable scenario: a retest of the lower demand → a liquidity grab → bullish displacement toward 25,970 – 26,160 → reversal back to equilibrium.
🧭 3️⃣ Liquidity Flow – The Path of Least Resistance
Above the current range lies buy-side liquidity resting at 26,000+, while below, sell-side liquidity has already been swept near 25,280.
This suggests that the next move could be an engineered push upward — designed to collect liquidity above 25,970 – 26,160 before potential continuation back into the demand zone.
Such a move would mirror the classic SMC liquidity cycle:
Accumulate → Displace → Manipulate → Distribute.
🌙 4️⃣ Trading Outlook – Patience Before Precision
Karina’s bias for the day is moderately bullish, anticipating a short-term expansion toward the upper liquidity pool.
However, she remains cautious — waiting for confirmation near the demand zone before entering long.
Buy Idea:
Entry: 25,280 – 25,300
Stop Loss: below 25,200
Target 1: 25,970
Target 2: 26,160
If the liquidity sweep at 26,160 completes, Karina expects a controlled retracement — a potential short setup back into equilibrium around 25,400.
🌷 5️⃣ Reflection – When the Market Whispers, Smart Money Listens
The chart right now feels calm, methodical — like the quiet before a decisive wave.
Smart Money rarely rushes. It absorbs, manipulates, and moves when most traders stop paying attention.
For Karina, this is one of those moments where patience becomes the most powerful strategy.
The next move will not be random — it will be precise, intentional, and elegant, just like the rhythm of liquidity itself 🌙
This analysis reflects Karina’s personal perspective and is not financial advice.
How do you see the US100’s next move? Is Smart Money gearing up for another liquidity sweep above 26k? Let’s discuss below 💬

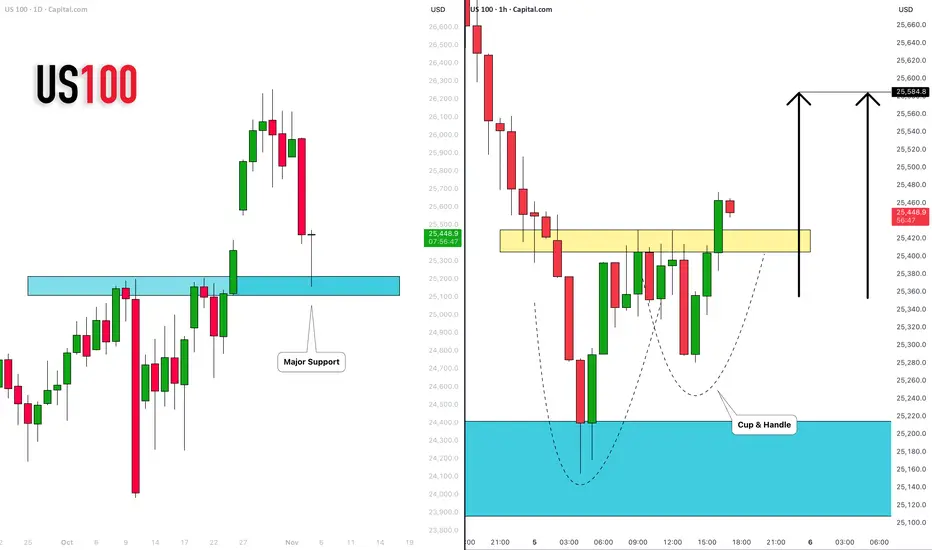
NASDAQ INDEX (US100): Time to Recover
US100 index dropped yesterday, as I predicted.
The market is recovering now, after a test of a major daily support cluster.
A formation of a cup & handle pattern on that and a breakout of its neckline
indicate a strong buying pressure.
With a high probability, the market will rise and reach 25580 level soon.
❤️Please, support my work with like, thank you!❤️
I am part of Trade Nation's Influencer program and receive a monthly fee for using their TradingView charts in my analysis.
How to Trade NASDAQ NAS100 Retracements Into An Imbalance🚀 NASDAQ NAS100 Analysis – Watching for a Bullish Opportunity 📈
I'm currently focused on the Nasdaq NAS100. On the weekly timeframe, it remains in a strong bullish trend 💹. Recently, however, we've seen a sharp and aggressive retracement. Given that the market was overextended, this pullback is healthy and expected, as price seeks to tap liquidity pools and rebalance ⚖️.
Zooming into the 4-hour timeframe, we can clearly identify a bullish imbalance 🔹. This area serves as my key point of interest for a potential move lower. The ideal scenario is for price to hold above the imbalance low and then break structure bullishly 🔼.
Key conditions for a high-probability long trade:
Price must not break below the imbalance low 🚫⬇️
Price must establish higher highs and higher lows to confirm bullish momentum 🔝
If these conditions align, I will be looking for a long entry opportunity. ⚠️ Not financial advice – this is purely market analysis for educational purposes.

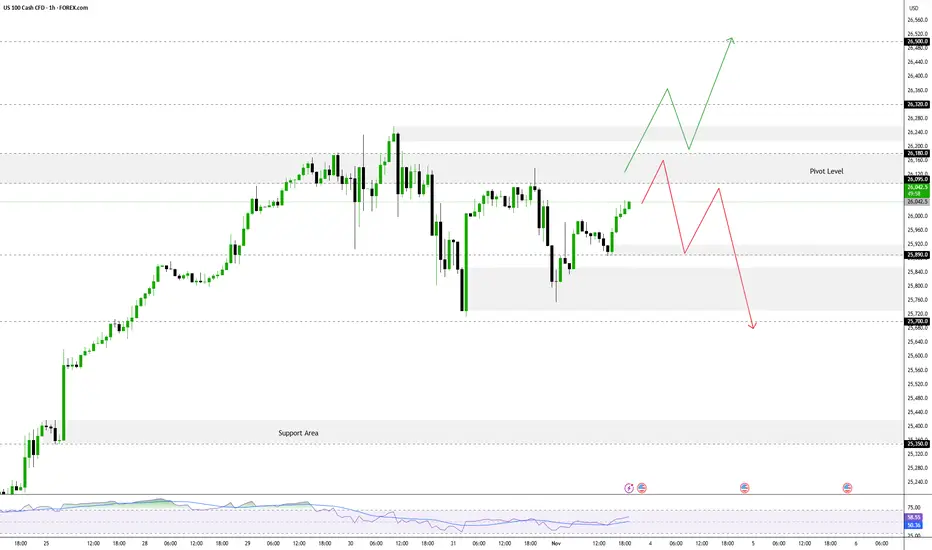
NASDAQ Testing Pivot Zone, Awaiting Breakout The FOREXCOM:NAS100 is currently testing a key zone called the Pivot Zone (a direction-determining area). The short-term trend will be determined by whether the price manages to stay below or break above this zone.
Pivot Zone: 26,095 – 26,180
As long as the price trades below this zone, short-term momentum remains bearish (tending to fall).
➡️ Bearish Scenario
If the price remains below 26,180, the negative bias will continue, with the following main targets:
- Target 1: 25,890
- Target 2: 25,700
- Target 3: 25,340
⬆️ Bullish Scenario
If a breakout and confirmation occurs above 26,180, this could signal the start of a new bullish trend, with the following targets:
- Target 1: 26,500
- Target 2: 26,850
USNAS100 remains bearish below 26,180, but a confirmed break above this level could signal the start of a new bullish leg.
Are Institutional Buyers Returning to NASDAQ100 Again?🎯 NASDAQ100 Blueprint: The Thief's Ultimate Heist Setup 💰
📊 Asset Overview
NASDAQ:NDX | US100 Index
Market Capital Flow Analysis - Swing Trade Setup
🔍 Technical Foundation
Bias: 🐂 BULLISH CONFIRMED
The LSMA (Least Squares Moving Average) breakout has painted the perfect picture. When institutional money flows align with technical breakouts, you know the smart money is positioning for the next leg up.
Current Market Structure:
We're witnessing a textbook bullish continuation pattern with strong momentum building above key moving averages. The index is showing resilience at support zones while eyeing psychological resistance levels ahead.
💎 The Thief's Layered Entry Strategy
Entry Philosophy: "Why catch one knife when you can catch four?" 😏
This is classic Thief-style layering - multiple limit orders spread across strategic price zones to build a position with optimal average entry:
Entry Layers (Limit Orders):
🎯 Layer 1: 24,800
🎯 Layer 2: 25,000 (Psychological level)
🎯 Layer 3: 25,200
🎯 Layer 4: 25,400
Pro tip: You can add more layers based on your risk appetite and capital allocation. Scale in gradually, not aggressively.
Alternative: If you prefer simplicity, you can enter at current market price - but layering gives you the edge when volatility strikes.
🛡️ Risk Management
Stop Loss Zone: 24,600
⚠️ Important Notice: Dear Ladies & Gentlemen (Thief OG's), this SL is MY reference point based on market structure. You are the captain of your own ship - set your stop loss according to YOUR risk tolerance and account size. Trade at your own risk!
🎯 Profit Target
Primary Target: 26,000
Why this level?
Strong historical resistance zone
Overbought territory on multiple timeframes
Potential bull trap formation area
Confluence with Fibonacci extension levels
⚠️ Exit Strategy Note: Dear Ladies & Gentlemen (Thief OG's), this TP is MY analysis. When YOU see green, YOU decide when to bank it. Take profits incrementally if you prefer safety over maximum gains. Remember: Pigs get fat, hogs get slaughtered! 🐷
🔗 Correlated Assets to Watch
These pairs move in tandem with NASDAQ100 - keep them on your radar:
📈 SP:SPX (S&P 500): The big brother index - when SPX moves, NQ100 often follows
📈 NASDAQ:QQQ (Nasdaq ETF): Direct tracking vehicle for tech-heavy momentum
📈 NASDAQ:AAPL (Apple Inc.): Largest NASDAQ component - heavy influence on index direction
📈 NASDAQ:MSFT (Microsoft): Tech titan with significant index weighting
📈 NASDAQ:NVDA (NVIDIA): Semiconductor leader driving AI narrative
📈 NASDAQ:TSLA (Tesla): High-beta play that amplifies NASDAQ moves
📈 TVC:DXY (US Dollar Index): Inverse correlation - strong dollar often pressures tech stocks
📈 TVC:TNX (10-Year Treasury Yield): Rising yields = tech pressure; falling yields = tech rally
Key Correlation Insight: Tech stocks (and thus NASDAQ) typically benefit from falling yields and weakening dollar conditions. Monitor these macro factors!
⚡ Key Technical Points
✅ LSMA breakout confirms bullish momentum shift
✅ Volume profile suggests accumulation at current levels
✅ Multiple timeframe alignment (swing trader's dream)
✅ Risk-reward ratio favors long positioning
✅ Institutional money flow indicators turning positive
⚠️ Watch for: Volatility spikes near resistance, macro news events, and Federal Reserve commentary that could impact tech valuations.
🎭 The Thief's Final Words
"In the market, you're either the heist mastermind or the one getting robbed. Choose wisely." 😎
This setup is designed for swing traders who understand that patience and proper position sizing beat FOMO every single time. Layer in, manage risk, and let the market come to you.
Remember: This isn't financial advice - it's a roadmap drawn by someone who respects the market's ability to humble even the best of us.
📢 Community Support
✨ If you find value in my analysis, a 👍 and 🚀 boost is much appreciated — it helps me share more setups with the community!
#NASDAQ100 #US100 #NQ100 #SwingTrading #TechnicalAnalysis #LSMA #LayeredEntry #ThiefStyle #IndexTrading #BullishSetup #RiskManagement #TradingStrategy #MarketAnalysis #PriceAction #SupportAndResistance #TradingIdeas #StockMarket #ForexTrading #DayTrading #TradingCommunity

US100 Will Keep Growing!
HI,Traders !
#US100 made a bullish
Breakout of the key horizontal
Level of 177.327 and the
Breakout is confirmed so
We are bullish biased
And we will be expecting
A further bullish continuation !
Comment and subscribe to help us grow !

NAS100US100 created a NH as price is changing direction creating a bearish peanant, price to retrace back to resistance before it dumps..Trade safe and be Blessed..

US 100 Upside Breakout – Target in SightUS 100 has broken above key resistance at 25,074, confirming a bullish breakout. Price is now at 25,508, supported by VWAP and 5 EMA. Momentum favors buyers, with the 1st target near 27,000, expected to be reached in the upcoming week if trend strength continues. Ideal entry on pullbacks or bullish continuation candles. Place stop-loss below breakout zone at 24,800 to manage risk. Watch for volume confirmation and sustained price action. This setup offers a short-term opportunity for swing traders aiming to ride the breakout wave.
NAS100 Why I'm Watching for a Countertrend Short on US100The NASDAQ (US100) has pushed aggressively into fresh all-time highs, tapping into a key liquidity zone where buy-side liquidity sits above previous swing highs. 📈💧
Price has extended without any meaningful pullback, suggesting we may soon see exhaustion and a corrective move. As we approach the end of the week, institutional traders often rebalance or close positions, which can trigger short-term retracements. 🏦🔄
If price breaks structure to the downside, I’ll be watching for a counter—
residing in a premium zone to—butter to the downside swings—for a potential countertrend—but—
🛑 Not financial advice. For educational purposes only.

US100 Will Go Down!
HI,Traders !
#US100 has made a retest
Of the horizontal resistance
Of 25169.1 and we are already
Seeing a bearish reaction so
We are bearish biased and
Therefore a local bearish
Pullback is to be expected !
Comment and subscribe to help us grow !

NASDAQ 100 Resistance Reaction and Countertrend Short SetupThe NASDAQ 100 has rallied strongly and is now trading near the top of its current range 📊. Price is approaching a key resistance level, and I’m expecting a potential reaction from liquidity above the highs, followed by a retracement back to equilibrium — around 50% of the current price swing 📉.|
A countertrend short setup could be considered here, with the option to take partial profits early to reduce risk 💡. Full details of the trade idea and execution are explained clearly in the video.
⚠️ Disclaimer: This is for educational purposes only and not financial advice.

US100 Bearish Bias!
HI,Traders !
#US100 keeps growing
But a horizontal resistance
Level of 25039.3 is nearby
So after the retest of the
Level we will be expecting
A local bearish correction
On Monday !
Comment and subscribe to help us grow !

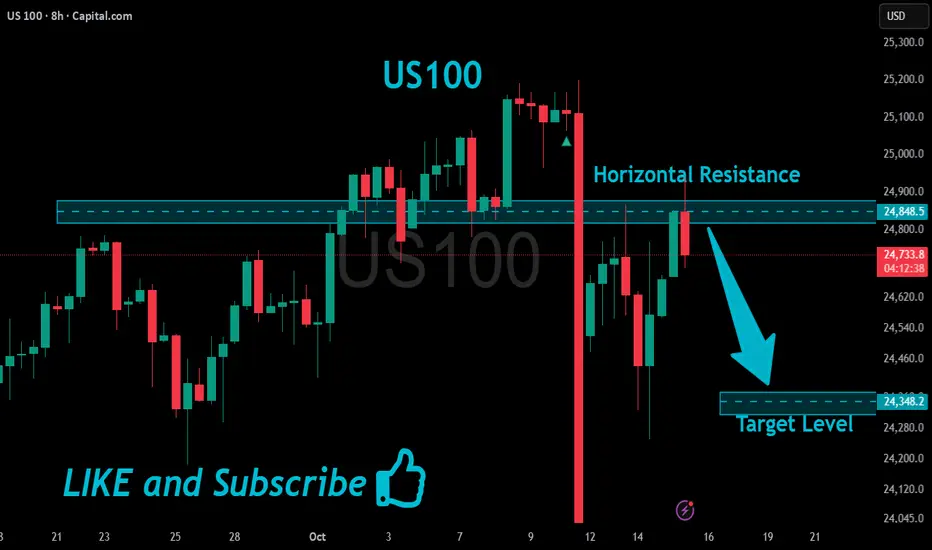
US100 Local Bearish Pullback Expected!
HI,Traders !
#US100 is hit A strong horizontal resistance
Level of 24848.5 after a sharp
Push upwards by the bulls
So a local correction is needed
From the resistance with the
Expected target being the
Local level below at 24348.2 !
Comment and subscribe to help us grow !
US100 Bearish Breakout!
HI,Traders !
#US100 made a bearish
Breakout of the key
Horizontal level of 24795.7
Which is now a resistance
And the breakout is confirmed
So after the potential pullback
And retest we will be expecting
A further bearish move down !
Comment and subscribe to help us grow !

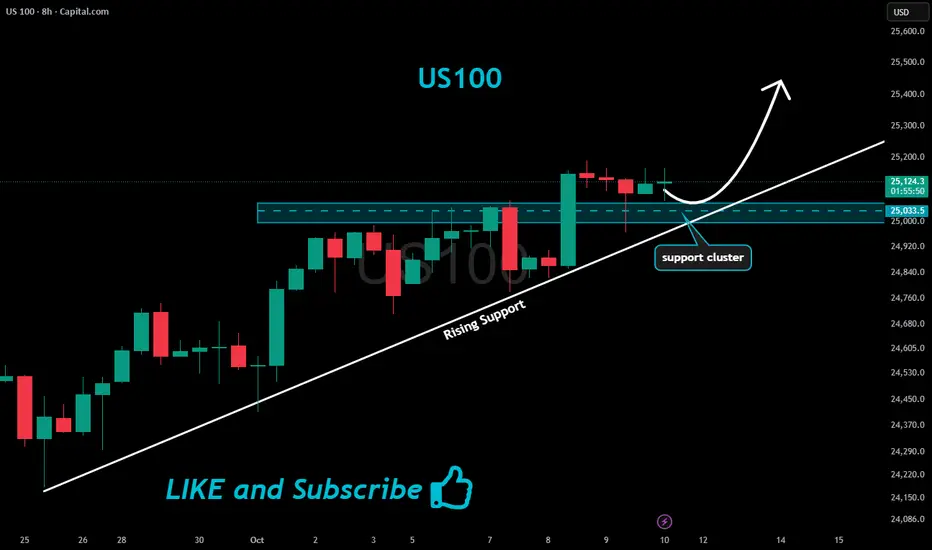
US100 Will Keep Growing!
HI,Traders !
#US100 is trading in an
Uptrend and broke
The key horizontal level
Of 25033.5 and the breakout
Is confirmed so after a potential
Retest of the support cluster
Of the rising and horizontal
Support lines below we will
Be expecting a bullish continuation !
Comment and subscribe to help us grow !