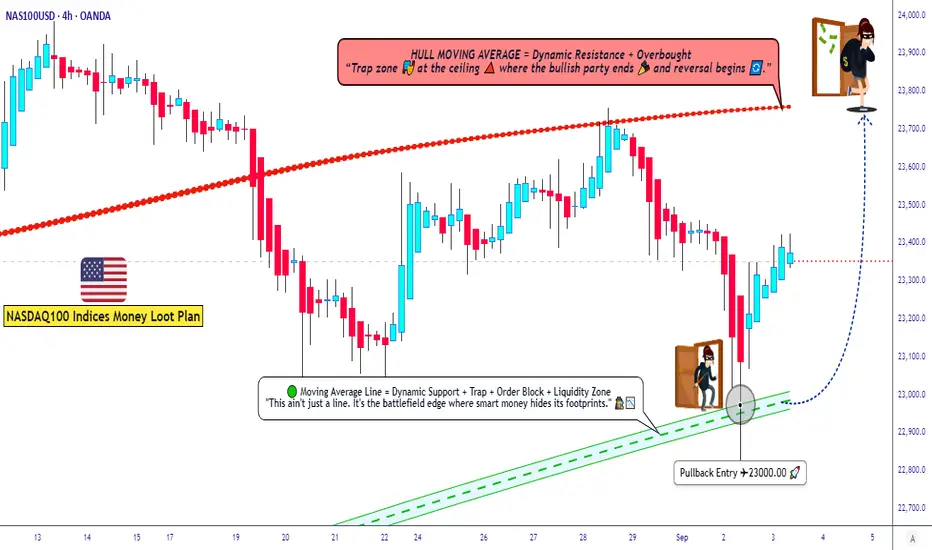
US100 Trading Plan ¦ Layering Strategy + Macro Sentiment Drivers🚀 NASDAQ100 / US100 Index – Thief Money Heist Plan 🎭
📌 Plan: Bullish Swing / Scalping Setup
Dear Ladies & Gentlemen (Thief OG’s), here’s the heist-style breakdown for US100 🔑:
🏴☠️ Entry Style (Thief Layering Strategy)
Using layered limit orders for flexibility & precision:
• 23200.0
• 23250.0
• 23300.0
• 23350.0
(You may increase limit layers based on your strategy & risk appetite)
📉 Moving Average Pullback Entry Plan
• Buy entries on pullbacks to the Fibo level 382 Triangular Moving average zone.
• Look for bullish candles confirming the bounce from these MAs.
• This offers better risk-to-reward by catching momentum on retracements instead of chasing highs.
❓ Why This Works?
• Moving averages often act as dynamic support/resistance in trending markets.
• Institutional traders & algos track them heavily, making them high-probability zones.
• Combining with layering entries = higher flexibility + reduced risk of mistimed single entry.
🛡️ Stop Loss (Protect the Vault)
• Thief SL: @23000.0
• Reminder: Adjust your SL based on your own strategy & risk tolerance.
🎯 Target (Escape Zone)
• Overbought + Trap Zone ahead!
• Escape target: @23750.0
• Note: Don’t rely only on my TP — secure profits at your own pace and risk.
📊 US100 Index CFD Real-Time Data Sep 03
📈 Daily Change: +133.47 (+0.57%)
📅 Monthly Performance: +0.76%
📆 Yearly Performance: +23.48%
😰😊 Fear & Greed Index
📊 Current Reading: 53/100 (Neutral)
🧐 Interpretation: Market sentiment is balanced, showing neither extreme fear nor greed. Investors are cautious but not panicked.
🧠 Retail vs. Institutional Sentiment
👥 Retail Traders: Moderately bullish (55% Long, 45% Short)
🏦 Institutional Traders: Slightly cautious (50% Long, 50% Short)
🔑 Key Drivers: Mixed signals from manufacturing data and upcoming labor market reports.
📉📈 Fundamental & Macro Score
📊 Macro Score: 6/10
Manufacturing PMI (48.7) still in contraction but improving.
Labor market data (JOLTS) awaited for clarity.
⚡ Volatility Score: 5/10 (Moderate)
VIX near average levels, indicating stable expectations.
💧 Liquidity Score: 7/10
Strong volume and breadth in large-cap tech stocks.
🐂🐻 Overall Market Outlook
✅ Bullish (Long): 60%
Supported by strong yearly gains and resilience in big tech.
⚠️ Bearish (Short): 40%
Concerns over manufacturing contraction and inflation pressures.
💡 Key Takeaways
📈 US100 is trending mildly positive today (+0.57%).
😐 Sentiment is neutral—no extreme fear or greed.
📊 Macro data hints at cautious optimism but watch for upcoming labor reports.
🐂 Overall bias leans slightly bullish for long-term holders.
📊 Related Pairs to Watch
FOREXCOM:SPX500
TVC:DJI
TVC:VIX
NASDAQ:NDX
FX:USDOLLAR
✨ “If you find value in my analysis, a 👍 and 🚀 boost is much appreciated — it helps me share more setups with the community!”
#NASDAQ100 #US100 #NDX #SPX500 #DJI #TradingView #SwingTrade #ScalpTrading #LayeringStrategy #MarketAnalysis
Us100analysis
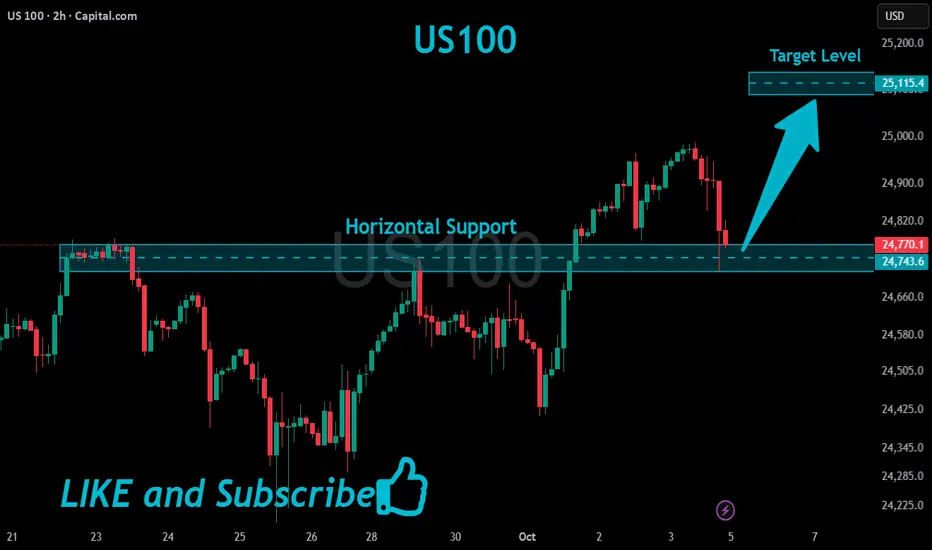
US100 Will Grow!
HI,Traders !
#US100 is trading in an
Uptrend and is
Going down to retest
The horizontal support
Around 24743.6 so after
The retest we will be
Expecting a further
Bullish move up !
Comment and subscribe to help us grow !
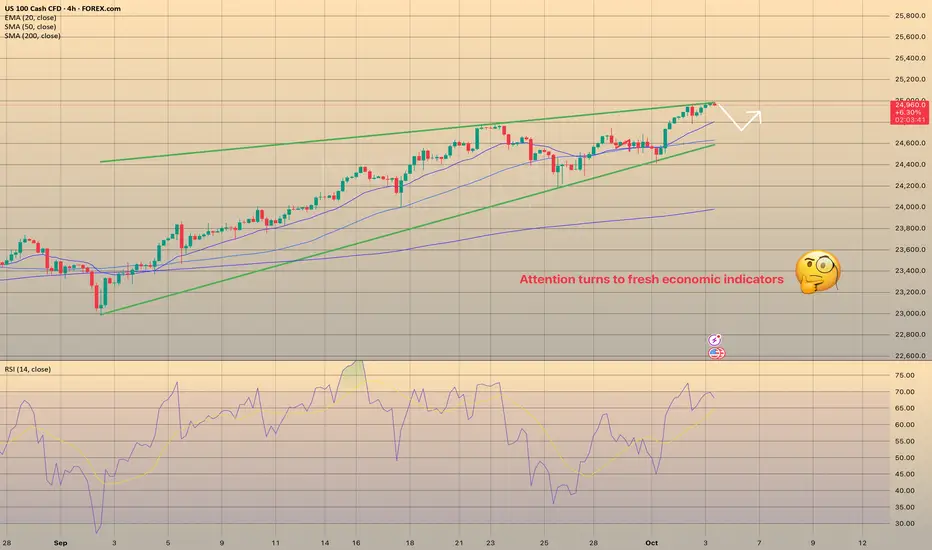
Wall Street extends record run as Shutdown delays key data, Fed Wall Street extends record run as Shutdown delays key data, Fed in Focus
U.S. stocks closed at record highs on Oct. 2, led by tech, with futures extending gains the next day. Optimism is supported by expectations of Fed rate cuts, though the government shutdown—now in its third day—has delayed key data, including nonfarm payrolls, leaving traders reliant on weaker private labor surveys.
With official releases on hold, ISM and S&P Global PMI data will carry added weight, while Fed officials’ speeches could sway rate-cut bets. While momentum points to weekly gains, the rally remains fragile as political gridlock, hawkish commentary, or profit-taking could trigger volatility.
Market Implications:
Supportive factors: Tech sector strength, softer labor signals, and rate-cut expectations.
Risks: Prolonged shutdown delaying visibility on economic conditions, potential hawkish Fed commentary, and profit-taking at record levels.
Outlook: If momentum holds, the S&P 500, Dow, and Nasdaq are positioned to close the week higher, though volatility is likely to remain elevated until greater policy clarity emerges.
NASDAQ100 HIGH PROBABILITY SETUP SOON!!!🚨 NAS100 HIGH PROBABILITY BUY SETUP 🚨
* Here We Can See Clearly The Next Potential Moves For US100 Coming Hours/Days.
* Keep Your Eyes Close On Your Trading Positions.
* Happy PIP Hunting Traders.
FXKILLA.

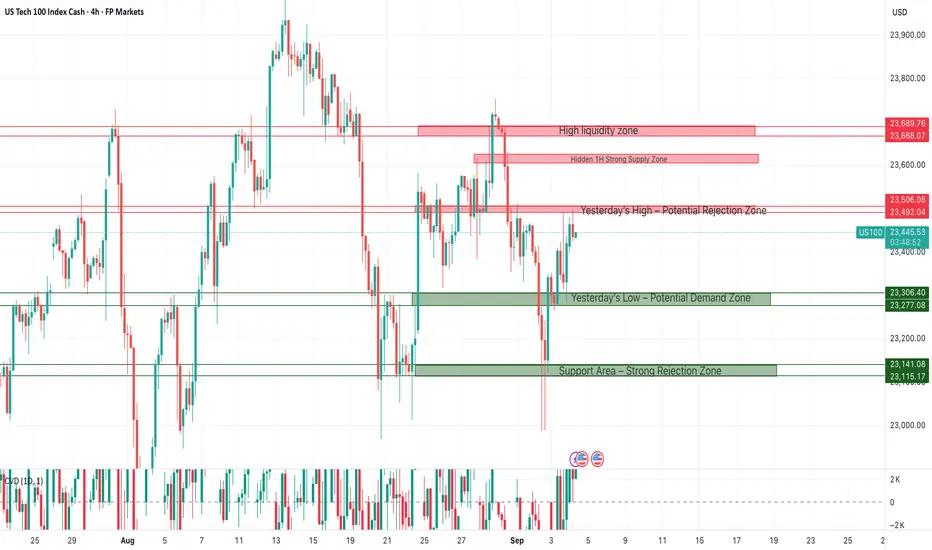
Nas100: Trading Levels in FocusKey Zones in Play
Zone 1 – Yesterday’s High:
Yesterday’s high represents the level where buyers lost momentum and sellers stepped in. If price revisits this zone, traders should expect potential supply pressure. A clean break and sustained hold above would signal renewed strength and could re-ignite bullish momentum.
Zone 2 – Yesterday’s Low:
This zone is the lower boundary of the previous session and now acts as short-term support. Buyers may defend this level to maintain structure, but its reliability is limited given the fresh all-time high environment and lack of historical confirmation. A decisive break below would weaken the bullish case and could invite deeper retracement.
Conclusion:
With US100 trading close to record highs, these zones provide useful guidelines, but they should not be treated as precise buy or sell triggers. In uncharted territory, reactions are often more volatile, making it essential to treat these levels as reference points rather than absolute decision zones.
Morning Sentiment Brief
Market sentiment remains cautiously optimistic. The recent Fed rate cut and ongoing enthusiasm around AI investments continue to underpin a bullish narrative, keeping the US100 near record highs. However, Powell’s cautious tone this week, stressing data-dependence and warning about stretched equity valuations, has cooled some of the initial euphoria.
Traders are now balancing optimism with prudence. Tech momentum is intact, but profit-taking and sector rotation show that conviction is more selective. Political and regulatory headlines add another layer of uncertainty, leaving the market more sensitive to incoming catalysts. Overall, the bias stays positive, but participants are trading with more caution as the index moves in uncharted territory.
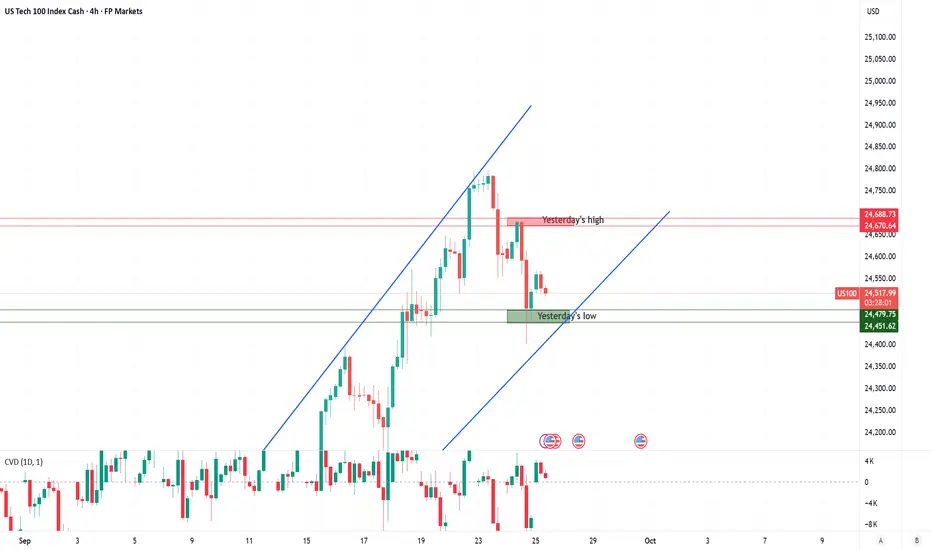
US100 Trend Watch – Critical LevelsUS100 Update
On the low time frame, US100 is consolidating around the 24,603 – 24,655 zone after rejecting higher levels.
Key levels:
24,655 – 24,603 → short-term resistance zone. A breakout and hold above would confirm bullish continuation.
24,158 → main trend support. As long as this level holds, the broader bullish structure remains intact.
Upside scenario: If price breaks and sustains above 24,655, momentum could extend further to test 25,000+.
Downside risk: If price falls below 24,603 and especially under 24,158, risk increases for a deeper pullback toward 23,800 – 23,400.
📌 Summary
Above 24,655 → bullish continuation toward new highs.
Hold above 24,158 → uptrend structure remains safe.
Below 24,158 → deeper correction risk, next support at 23,400.

Nas100: Trading Zones at Record HighsKey Zones in Focus
Zone 1 – All-time high area:
This zone marks the current all-time high and therefore acts as immediate resistance. Price has already tested this area, and sellers may attempt to defend it, leading to potential rejection or short-term pullbacks. A clean breakout and sustained hold above this level would confirm bullish continuation into uncharted territory, opening the door for further upside momentum.
Zone 2 – Demand zone:
This zone represents a recent consolidation cluster where both buyers and sellers were actively positioning. As the breakout unfolded, this area shifted from resistance to support. Short-term buyers are likely to step in here to defend the trend. A decisive break back below this zone, however, would weaken bullish conviction and could trigger a deeper retracement toward lower levels.
The sentiment around the US100 has turned more optimistic following last week’s Federal Reserve meeting, where the central bank cut interest rates by 25 basis points — the first rate cut since December 2024. This concrete policy move has reinforced investor confidence that monetary conditions are shifting toward a more supportive stance. At the same time, strong momentum in the technology sector, highlighted by new AI-focused partnerships and improving trade signals between the U.S. and China, has further boosted risk appetite. While some caution remains regarding the pace of future cuts and macroeconomic headwinds, the overall market tone is positive, with traders viewing the recent policy shift as a catalyst for continued strength in the Nasdaq-100.

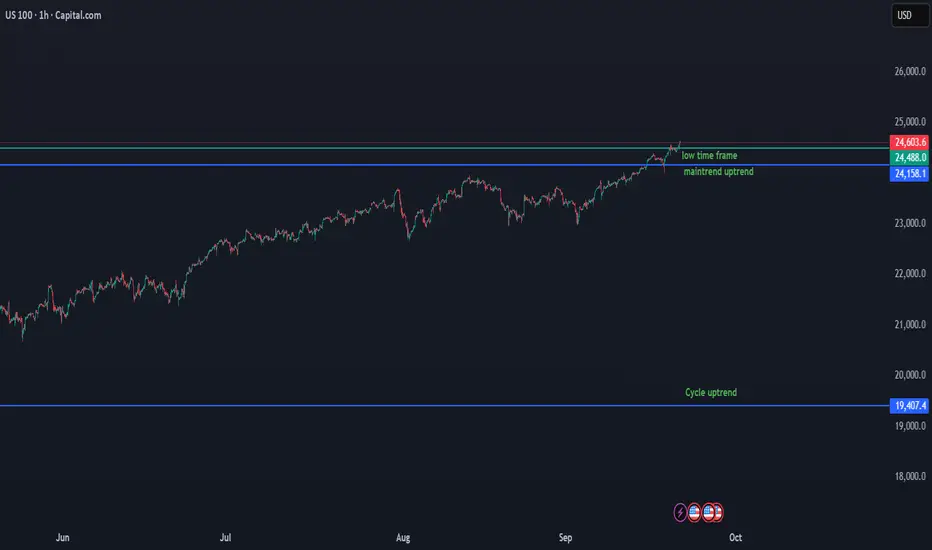
US100 Key Levels & Trend OutlookUS100 Update
We use advanced data that counts the start of the cycle and all important key levels.
On the low time frame, Nasdaq is consolidating just above the 24,516 – 24,488 support zone, which now acts as the key base for continuation.
Key levels:
24,516 – 24,488 → critical short-term support. Holding above confirms continuation of the uptrend.
24,603+ → current resistance. A clean breakout and hold above this level would extend bullish momentum and push toward new highs.
Downside risk: If price breaks back below 24,488, the next support sits around 24,158. A deeper breakdown from there could open a correction toward 23,404.
Cycle support: 19,407 is the major cycle uptrend level. Nasdaq must stay above this to keep the long-term bullish structure intact.
📌 Summary
Above 24,516 – 24,488 → bullish continuation in play.
Break & hold above 24,603 → signals further upside.
Below 24,488 → correction risk, first support at 24,158, then 23,404.
19,407 → cycle-level support for the long-term trend.
Nas100 – Today's Trading Zones Analysis 17 sep.Trading Zones
As price trades around all-time highs, the amount of historical data to build strong zones is limited. This makes the current levels less reliable, and traders should approach them primarily as guidance rather than decisive turning points.
Zone 1 – All-Time High / Yesterday’s High:
This area marks the recent record peak. While it can act as resistance in the short term, its strength is uncertain due to limited data. Price reactions here may be volatile and driven more by sentiment than structure.
Zone 2 – Yesterday’s Low:
A lighter support level that can provide intraday reactions but lacks deep structural confirmation. Best used as a reference point rather than a major decision area.
Zone 3 – Strong Support / High Profitability for Momentum:
This is the most significant zone on the chart, where strong buyers have previously stepped in. It carries a higher probability of triggering a strong reaction. That reaction could unfold as a bounce higher if demand holds, or as a sharp move lower if the zone breaks decisively.
All eyes are on today’s Fed meeting , where markets widely expect a 25bp rate cut. While the move is largely priced in, the real focus will be on Powell’s tone and the updated dot plot, which will guide expectations for the pace of easing ahead. Sentiment in the US100 remains cautiously optimistic, supported by strong tech momentum and softer inflation data, but with price trading at record highs, volatility is likely to spike if the Fed delivers any surprises.

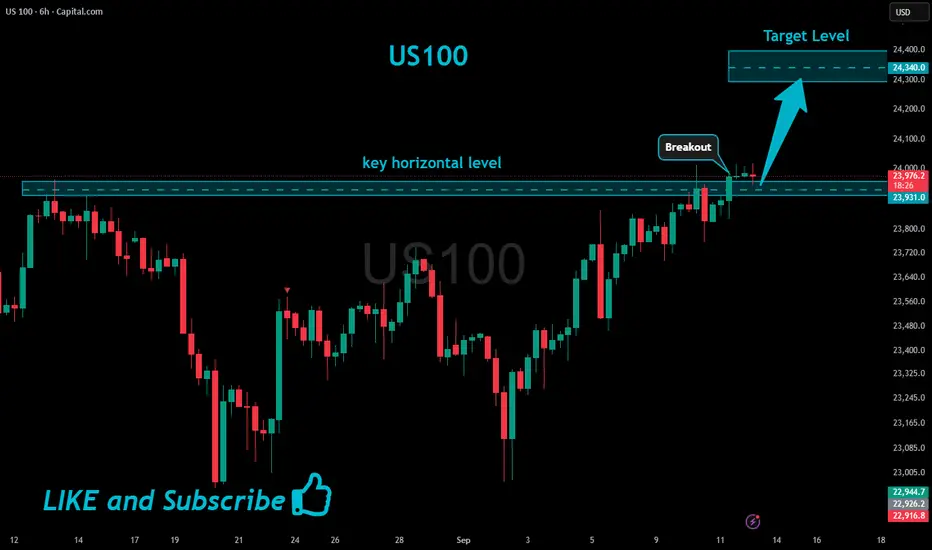
US100 Will Keep Growing!
HI,Traders !
#US100 is trading in an
Uptrend and the index broke
The key horizontal level
Around 23931.0 and the
Breakout is confirmed so
We are bullish biased
And we will be expecting a
Further bullish move up !
Comment and subscribe to help us grow !
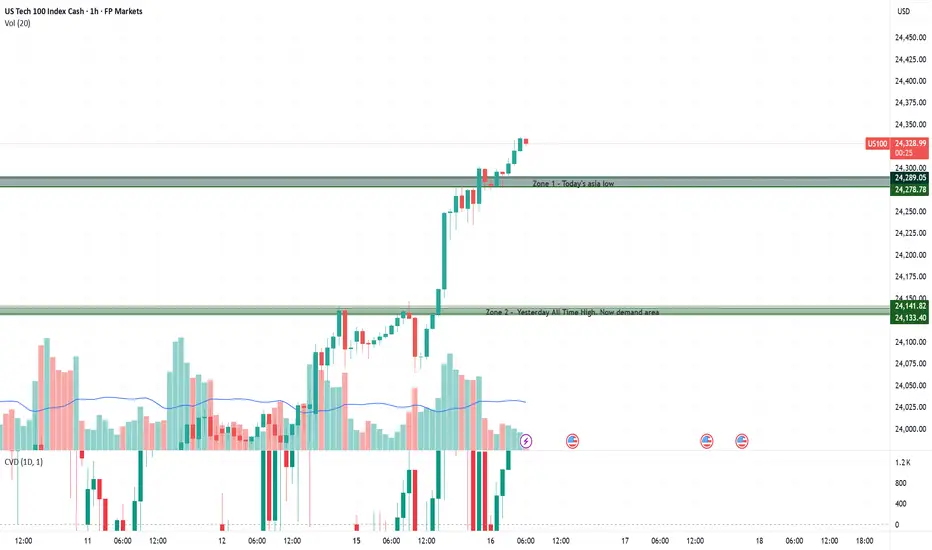
NAS100 Trading Zones – Navigating All-Time HighsThe Nasdaq is trading at all-time highs, which means there are no established sell zones above. In this environment, price is in full discovery mode. Every new tick higher sets fresh records, and volatility often picks up as traders probe for tops. That makes it difficult to fade strength, shifting the focus toward demand zones below as key areas for potential pullbacks.
🔹 Zone 1 – Today’s Asia Low (24,278–24,289)
This zone marks the intraday low from the Asian session and serves as the nearest short-term demand. A revisit here could attract buyers for a bounce, while a decisive break lower would signal loss of momentum and invite deeper retracement.
🔹 Zone 2 – Yesterday’s All-Time High, Now Demand (24,133–24,141)
Yesterday’s record high has flipped into a demand zone. As long as price holds above this level, the bullish structure stays intact. A strong rejection here favors continuation higher, but failure to hold could open the door to sharper downside.
Sentiment in the US100 remains cautiously optimistic. Softer labor data and easing producer prices have strengthened expectations of Fed rate cuts, while strong momentum in select tech names, including Oracle’s upbeat cloud outlook, continues to drive the index higher. Still, with price trading near all-time highs, volatility is elevated and the backdrop fragile, leaving traders mindful that optimism rests heavily on the Fed delivering on dovish expectations.
Futures steady ahead of Fed cutFutures steady ahead of Fed cut
U.S. stock futures held flat on August 15 ahead of the Sept. 17–18 Fed meeting, where a 25-bps cut is widely expected. Markets price about 70 bps of easing by year-end, though Powell may highlight inflation risks to temper dovish bets. Retail sales Tuesday will be the last key data before the decision.
Global markets were subdued: oil ticked higher on Ukraine-Russia tensions, the dollar eased, and Asian stocks firmed with South Korea’s Kospi hitting records. The Bank of Canada may also cut this week, while the BoE and BoJ are likely to stay on hold.
Traders are watching today’s Empire State manufacturing survey (8:30 AM EDT), the Senate vote on Fed nominee Stephen Miran, speeches from ECB’s Lagarde and Schnabel, and EU Council President Costa’s visit to Cyprus ahead of its 2026 presidency.
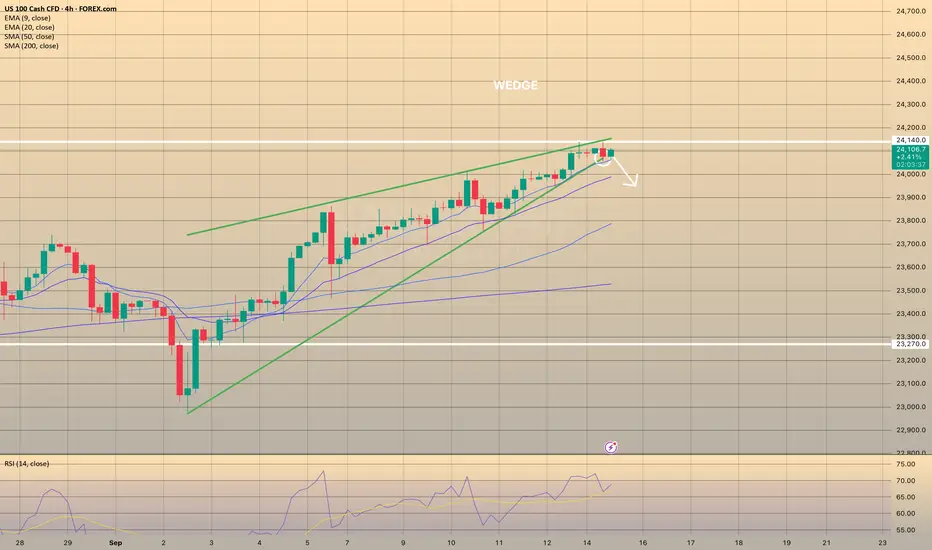
Nas100 – Trading Zones to Watch Near HighsZone 1 – All-Time High Supply (24,133 – 24,142)
This zone sits right at the all-time high, where volatility and liquidity are elevated. Sellers are likely to defend aggressively here, making sharp rejections common. A clean breakout and acceptance above would show strong buyer conviction and could trigger momentum into new record territory.
Zone 2 – High Liquidity Demand (24,014 – 24,026)
This area reflects a high-liquidity pocket where buyers previously absorbed heavy selling pressure. Pullbacks into this zone may attract renewed demand, offering potential long setups. If the zone breaks decisively, however, it risks flipping into resistance and signaling continuation lower.
Sentiment in the US100 remains cautiously constructive. Optimism is fueled by strong tech leadership and expectations of upcoming Fed rate cuts, while softer labor data and cooling producer prices have eased pressure on yields. Still, inflation readings surprised slightly to the upside last week, reminding traders that risks remain. With price now testing all-time highs, volatility is elevated and the market’s mood is fragile momentum is there, but it requires confirmation through clean breakouts rather than relying on hope alone.

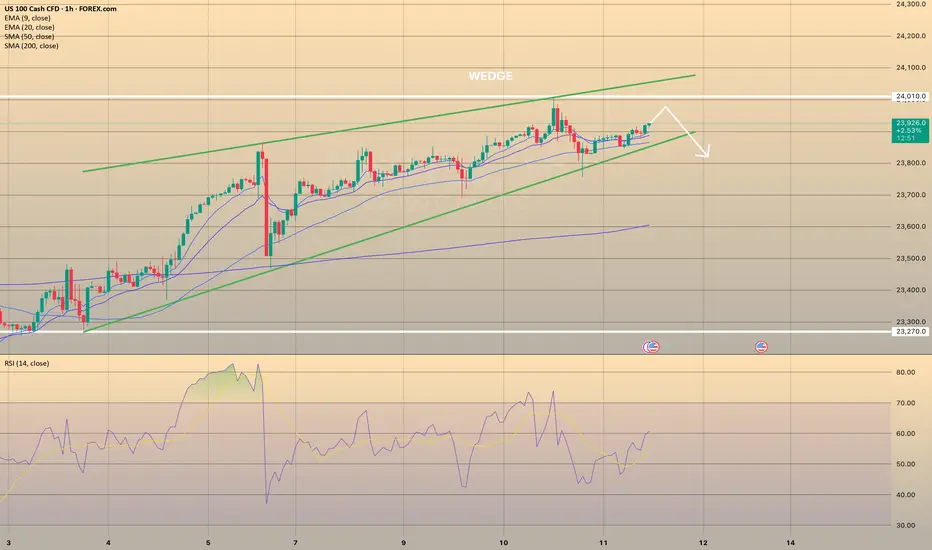
NASDAQ100 HIGH PROBABILITY SETUP SOON!!!🚨 NAS100 HIGH PROBABILITY SELL SETUP 🚨
* Here We Can See Clearly The Next Potential Move For US100 Coming Hours/Days.
* Keep Your Eyes Close On Your Trading Positions.
* Happy PIP Hunting Traders.
FXKILLA.

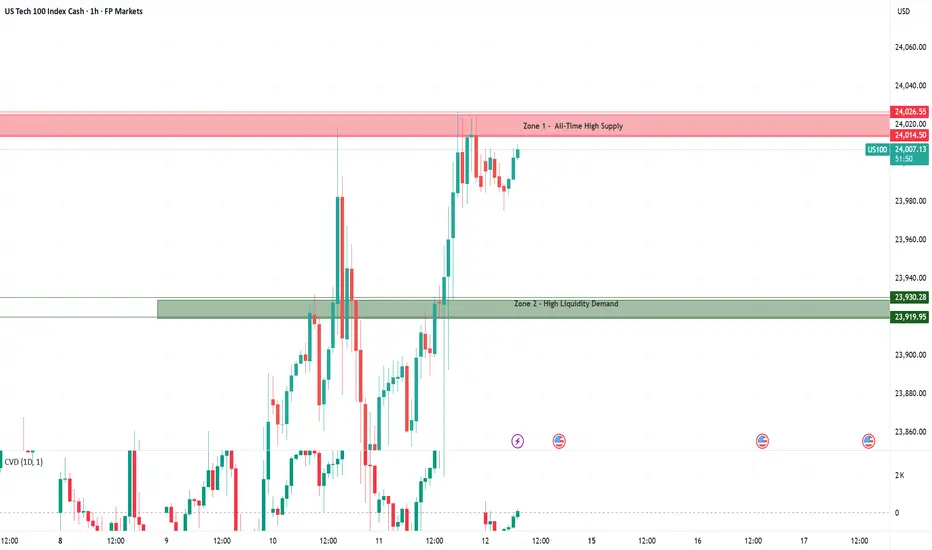
Nas100 – Today’s Key Trading ZonesTrading zones
Zone 1 – All-Time High Supply (24,014 – 24,026)
This zone sits at the all-time high, where volatility and liquidity hunts are often at their peak. Sellers are likely to defend aggressively here, making sharp rejections common. A clean breakout and hold above would indicate strong buyer conviction and could open the door for further momentum into uncharted territory.
Zone 2 – High Liquidity Demand (23,920 – 23,930)
This demand zone represents a high-liquidity pocket created by prior consolidation. Buyers are expected to step in here on pullbacks, providing potential long setups. However, if the zone fails to hold, it may flip into resistance and trigger continuation downside moves.
With price trading near all-time highs, only two zones are marked today. Volatility at record levels makes price action less structured, leaving limited data to build reliable zones from. As a result, focus remains on the all-time high supply zone above and the high-liquidity demand zone below as the key areas for potential reaction.
Sentiment in the US100 is cautiously positive but fragile. Strong tech momentum and expectations of Fed rate cuts support the index, while softer labor data and cooling producer prices ease pressure on yields. Still, higher-than-expected CPI reminds investors that inflation risks remain, keeping markets on edge near all-time highs.
Futures rise as traders await inflation data, Fed cuts in focusFutures rise as traders await inflation data, Fed cuts in focus
U.S. stock index futures rose slightly on Thursday as traders awaited key consumer price data at 8:30 a.m. ET, expected to show higher August inflation. Wednesday’s softer PPI report fueled bets on Fed rate cuts next week, with markets fully pricing in a 25-bps move and assigning a 10% chance of 50 bps.
Weak labor data reinforced easing expectations, while jobless claims numbers are also due today. The AI trade revived midweek, lifting chipmakers and utilities tied to data centers. Oracle gained 1.6% premarket, while gun stocks extended gains after news of a campus shooting. Despite September’s poor historical record, Wall Street has opened the month on a strong note, with strategists seeing Fed cuts as the key driver of market direction.
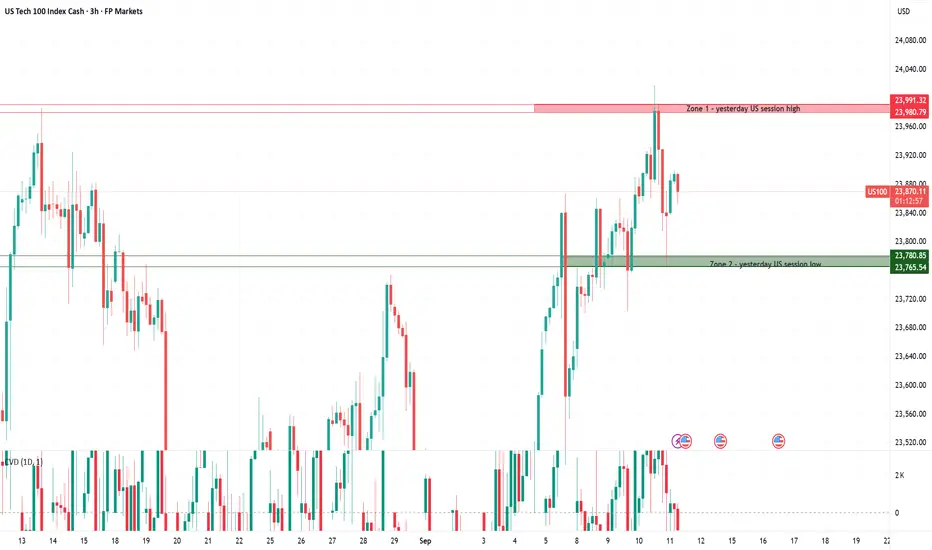
NAS100 Trading Zones – Volatility at All-Time HighsZone 1 – 23,980 – 23,991
This zone sits just below the all-time high, making it a critical supply area where volatility tends to spike. Sellers are likely to defend here aggressively, and false breakouts are common as liquidity is swept around all-time highs. A clean breakout and hold above would signal strong buyer conviction and could fuel a momentum push into uncharted territory.
Zone 2 – 23,765 – 23,781
This zone represents a key demand area where buyers previously stepped in to defend intraday lows. A sharp bounce here would confirm renewed buying interest, while a decisive break below would shift control back to sellers and could trigger a deeper correction.
With price trading near all-time highs, caution is warranted. Volatility often spikes in these areas, as liquidity hunts and false breakouts are common. Traders should be selective, waiting for clear confirmation before committing to new positions.
Sentiment in the US100 remains cautiously positive, supported by strong momentum in select tech names and growing expectations of Fed rate cuts after softer labor data and a sharp drop in producer prices. Lower input costs are viewed as supportive for corporate margins in the near term, while falling yields continue to benefit growth stocks. Still, the broader backdrop is fragile, as weaker job revisions and signs of cooling demand remind investors that economic momentum is slowing.
NAS100 - Trading Zones and Market SentimentZone 1 – 23,926 – 23,943
This is a critical resistance area sitting just below the all-time high. Sellers are likely positioned here, making it a strong zone for potential rejection. A clean breakout and successful retest, however, would flip the zone into demand and open the path toward fresh highs.
Zone 2 – 23,854 – 23,880
Formed around recent consolidation and breakout structure. Buyers are expected to defend this zone on pullbacks, creating potential long opportunities. If broken decisively, it could turn into resistance, signaling weakening momentum.
Zone 3 – 23,782 – 23,798
A deeper demand level aligned with prior absorption and intraday lows. Likely to attract liquidity sweeps and sharp reactions on first touch. A failure here would shift control back to sellers and suggest a larger corrective move.
Sentiment in US100 Today: Between Optimism and Caution
Retail investors pull back from most Big Tech, except Nvidia and Palantir.
According to Charles Schwab’s STAX activity, retail investors have generally reduced exposure to large-cap tech stocks, with the exception of Nvidia and Palantir, which both saw significant net buying. This points to rising risk appetite, particularly toward select growth names in the tech sector.
Job revision data weakens the economy, but keeps rate expectations alive.
Wall Street remains subdued but continues to lean on the likelihood of a Fed rate cut, after job growth was revised down by nearly 1 million over the past 12 months.
Conclusion: Sentiment in the US100 remains cautiously optimistic, driven by a strong tech sector and dovish Fed expectations but the foundation is fragile, especially in light of weaker economic signals.

NASDAQ NAS100 at a Crossroads: Riding Nvidias Surge with CautionThe immediate reaction to Nvidia's stellar earnings has been decidedly bullish, propelling the NASDAQ higher. We saw a classic "buy the rumor, sell the news" event where the "news" was so powerful it triggered a "fear of missing out" (FOMO) rally with a healthy correction on Friday.
In the next one to two weeks, the near-term bias is bullish, but with extreme caution. The market has received the fundamental "all-clear" it was waiting for from its most important company. However, the index is now technically overextended and sentiment is euphoric, making it vulnerable to a short-term pullback or consolidation. The primary trend, however, remains bullish IMO.
1. The Catalyst: Nvidia Earnings
Nvidia didn't just beat expectations; it shattered them and raised future guidance, validating the entire AI investment thesis.
Revenue & EPS: Significant beats on both the top and bottom lines.
Guidance: Q2 revenue guidance of ~$28B was vastly higher than analyst estimates of ~$26.6B, demonstrating unprecedented demand for its Blackwell and Hopper architecture chips.
Data Center: Revenue of $22.6B, up 427% year-over-year, is the core of the story. This shows that AI infrastructure spending is not slowing; it's accelerating.
Stock Split: The announcement of a 10-for-1 stock split adds a psychological boost for retail investors, improving accessibility and reinforcing bullish sentiment.
Analyst Interpretation: This wasn't just a quarterly report; it was a fundamental confirmation that the AI revolution has tangible, massive earnings power. It alleviated fears that the AI trade was a bubble. For the NASDAQ, which is market-cap weighted and heavily influenced by NVDA, this was rocket fuel.
2. Technical Analysis (One-Day Timeframe Post-Earnings)
Price Action: The NASDAQ gapped up powerfully at the open, breaking cleanly above its previous consolidation range. This was a strong bullish signal.
Volume: The rally was accompanied by massive volume, confirming broad institutional participation. This wasn't a low-volume grind; it was a conviction move.
3. Macro & Fundamental Backdrop
Interest Rates: The market is currently pricing in a higher-for-longer stance from the Fed. However, recent economic data (PMIs, jobless claims) has shown slight signs of softening, which keeps hopes alive for a potential rate cut later in the year. A stable, non-accelerating rate environment is acceptable for tech stocks, especially those like Nvidia with explosive earnings growth that outweighs rate concerns.
Geopolitics: While always a risk (U.S.-China tensions, elections), the market has largely shrugged off these concerns for now, choosing to focus on the stellar corporate fundamentals.
Market Breadth: A key watch-out. The rally has been narrow, led primarily by the "Magnificent 7" (now perhaps the "Fab 1" - Nvidia). For the rally to be sustainable, we need to see broader participation from other sectors and smaller-cap stocks within the NASDAQ.
4. Likely Outcome for the Next 1-2 Weeks: Bullish with a Caveat
Bullish Scenario (60% Probability):
The momentum from Nvidia is likely to carry the NASDAQ higher in the very near term. We could see a continued "melt-up" towards 17,400-17,500 as underinvested funds are forced to chase performance and add equity exposure. Any dip will likely be shallow and bought aggressively, with the 17,000 level holding firm.
Consolidation/Pullback Scenario (35% Probability):
This is the most likely healthy outcome. After such a massive, emotion-driven surge, the market is likely to need a period of digestion. We could see the NASDAQ chop sideways for a week or two to work off the overbought conditions. This would reset the momentum indicators and allow the market to build a new base for the next leg higher. This is not a bearish signal; it is a strengthening signal.
Bearish Reversal Scenario (5% Probability):
A sharp reversal below the 17,000 support level and a fill of the earnings gap (~16,900) would be a significant warning. This would likely require a new, negative macro catalyst (e.g., unexpectedly hot inflation data, a major geopolitical escalation) that forcefully changes the interest rate narrative.
Trading & Investment Implication
For Bulls / Existing Longs: Hold positions. Consider taking partial profits on extreme strength, but avoid selling your entire position. The trend is your friend. Use any pullback to the 17,000 support as a potential buying opportunity.
For New Entrants: Chasing the green spike is high-risk. Be patient. Wait for the inevitable pullback or period of consolidation to establish a position. The risk/reward is poor on the day after a massive gap up.
For Bears: Fighting this tape is exceptionally dangerous. The fundamental news from NVDA is a game-changer for the index. Shorting based solely on overbought conditions is a quick path to losses.
Final Analyst Call: The next week is likely bullish with high volatility, potentially extending gains. However, the following week is highly susceptible to a consolidation or pullback as the initial euphoria settles. The overall trajectory for the next two weeks is cautiously bullish, with the understanding that a 2-4% pullback is a normal and healthy part of a strong uptrend.
The burden of proof is now on the bears to prove they can wrestle control back from a market that just received the best possible news from its most important constituent.
Not financial advice, this is just my opinion.

Nasdaq-100: Trading Levels to WatchKey Zones Today
Supply Zones (Red)
Zone 1: 23,926 – 23,943
This is the upper resistance zone, located just below all time high. Sellers are likely positioned here, making it a strong area for potential rejection. A confirmed breakout and retest, however, would indicate buyer strength and could open the path toward new all-time highs.
Zone 2: 23,854 – 23,880
A key intraday supply area with multiple prior rejections. Often acts as a liquidity pool, where failed breakouts can trigger sharp downside moves. A clean break and hold above would flip this zone into short-term support for continuation longs.
Demand Zones (Green)
Zone 3: 23,708 – 23,734
Formed around the recent breakout structure, this zone is expected to attract buyers on pullbacks. A sharp bounce here would confirm demand strength, while a decisive break below flips the area into resistance and could trigger continuation shorts.
Zone 4: 23,551 – 23,577
A deeper support level, aligned with prior consolidation and buyer absorption. Strong bounce potential on first retest, but repeated tests weaken the level. A breakdown here would shift momentum clearly in favor of sellers and open space for a larger downside move.
Nas100 - Cautiously Bullish, Waiting on Momentum
Sentiment in the US100 is cautiously positive but fragile. Large-cap tech continues to support the index, and hopes of imminent Fed rate cuts provide additional tailwinds. Still, the index remains below its all-time high, and uncertainty around economic data and geopolitics keeps investors from going all-in.
In short: there is momentum and optimism, but it rests on a fragile foundation where a single weak data point could quickly shift sentiment.
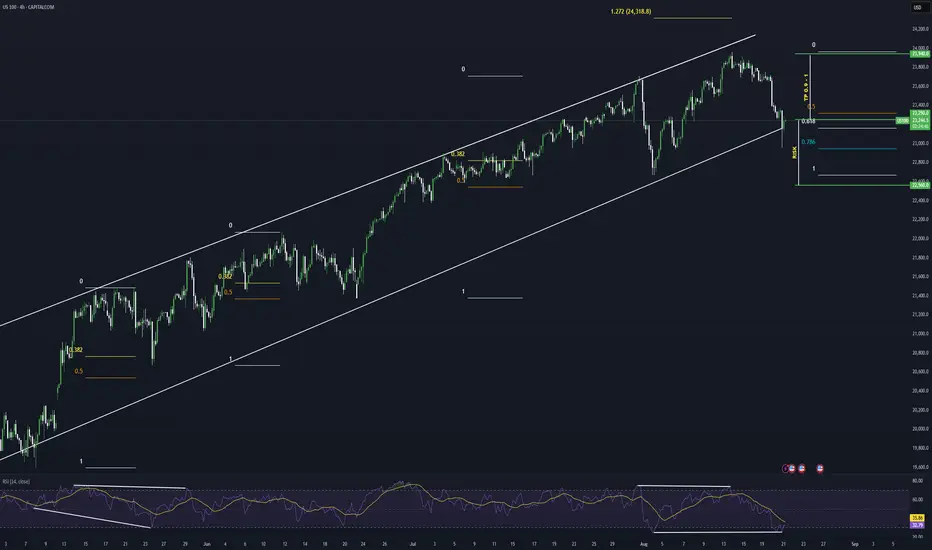
NASDAQ Potential Bullish ContinuationNASDAQ price action seems to exhibit signs of potential Bullish momentum as the price action may form a credible Higher Low with multiple confluences through key Fibonacci and Support levels which presents us with a potential long opportunity.
Trade Plan:
Entry : 23250
Stop Loss : 22560
TP 0.9 - 1: 23870 - 23940
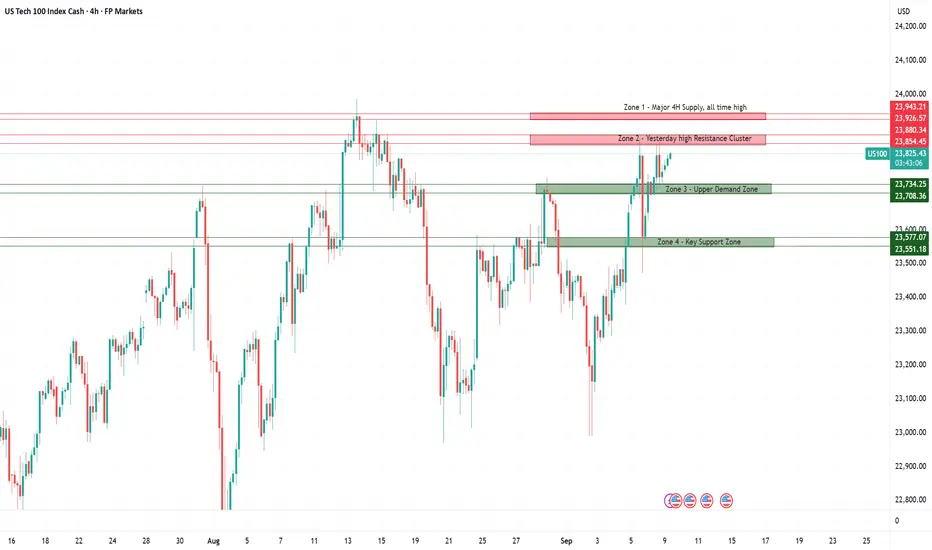
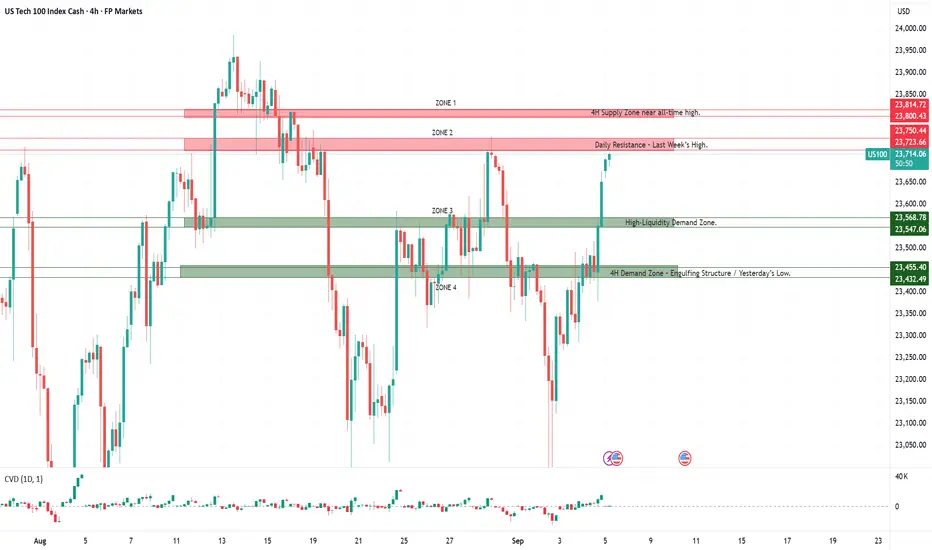
US100 – Today’s Key Trading ZonesHere are today’s trading zones for the US100. The levels are not fixed buy or sell signals, but decision areas where price often accelerates. Rejections can set up counter-trades, while clean breaks and retests can create continuation opportunities.
Zone 1
This area represents a major resistance close to the historical top. Price entering this zone carries a high probability of seller absorption and sharp rejection. A clean breakout and hold above would shift sentiment and open the door for new highs.
Zone 2
A key decision area from previous weekly highs. Often acts as a liquidity pool where breakout traps are common. A strong rejection can offer short opportunities, while a confirmed break and retest may flip the zone into support.
Zone 3
This level has repeatedly attracted strong reactions and carries high resting liquidity. Expect aggressive order flow here – either a sharp bounce for longs or, if broken, a continuation short on retest.
Zone 4
Formed around a strong 4H engulfing pattern and aligned with yesterday’s low. Buyers are likely to defend this level, making it a key intraday demand zone. A decisive break below would indicate seller dominance and could accelerate downside momentum.
Market Sentiment – Cautious Optimism
Overall sentiment in the US100 remains cautiously optimistic, supported by strong performance in Big Tech and expectations of a more dovish Fed. Still, the backdrop is fragile given broader macroeconomic signals, with investors balancing optimism against underlying economic risks.
Big Tech Drives the Market
Large-cap tech stocks led the market higher at record pace. Alphabet surged nearly 9%, Apple advanced 3–4%, and Tesla gained about 1.4%, boosted by a favorable antitrust ruling and strong technical momentum. Alphabet even reached a new record high, underscoring the sector’s ability to lift the entire index.
Macro Data – Mixed but Supportive
Weaker job openings data reinforced expectations of Fed rate cuts, a positive driver for growth stocks as lower bond yields support risk appetite. At the same time, the ISM Services PMI rose to 52.0, marking a third straight month of expansion and showing resilience in the services sector despite manufacturing weakness and a cooling labor market.
US100 on Shaky Ground – What Traders Should Watch TodayZones in Focus
The marked zones on the chart are not fixed buy or sell levels but decision areas where price is likely to accelerate and create short-term opportunities.
Red zones (potential supply): If price trades into these areas and shows rejection, it can set up short positions. A clean break above, however, flips the zone into potential support, opening the door for continuation longs.
Green zones (potential demand): If price reaches these areas and bounces sharply, it can provide long setups. A decisive break lower, by contrast, turns the zone into resistance, creating opportunities for continuation shorts on a retest.
The framework is built around letting price action on the 5-minute chart confirm the reaction: rejections favor counter-trades, while breakouts and retests favor continuation in the direction of the move.
The Market Is Sending Mixed Signals
The latest JOLTS report showed U.S. job openings falling to 7.18 million in July, below expectations of 7.38 million and down from 7.36 million in June. That makes it the lowest reading in ten months – and for the first time since the COVID era, there are more unemployed workers than available jobs.
For equities, this kind of data is a double-edged sword. On one hand, fewer openings cool the labor market and strengthen the case for earlier Fed rate cuts. On the other, if the trend deepens, it signals weaker economic momentum and risks feeding through to lower earnings growth.
Mood Check: Nasdaq Between Hope and Fear
The mood in the Nasdaq-100 is cautiously optimistic, yet undeniably fragile.
The bright side: Big Tech carried the index higher yesterday, with Alphabet rallying 9% and Apple 3–4%. That added roughly 1% to the Nasdaq-100 and reminded us how concentrated the index still is – a single positive headline can shift sentiment fast. At the same time, falling yields and softer labor data fuel hopes that the Fed may soon move toward cuts, a clear tailwind for growth stocks.
The risk side: Macro signals tell a different story. The ISM confirmed that manufacturing remains in contraction, and JOLTS made clear that the labor market is cooling. Inflation pressure may be easing, but so is economic momentum. That keeps investors defensive, even as the index rallies.
The Bigger Picture
Taken together, US100 sentiment is leaning positive in the near term, but the foundation is shaky. Gains are being driven more by mega-cap strength and expectations of rate relief than by broad economic resilience. Until the macro backdrop turns more convincingly, every rally remains vulnerable.