US 100NASDAQ - US 100
- Completed " 13245 " Impulsive Waves and " ABCD " Corrective Waves
- Break of Structure
- RSI - Divergence
- Symmetrical Triangle as an corrective pattern in Short Time Frame
- Order Block
Us100future

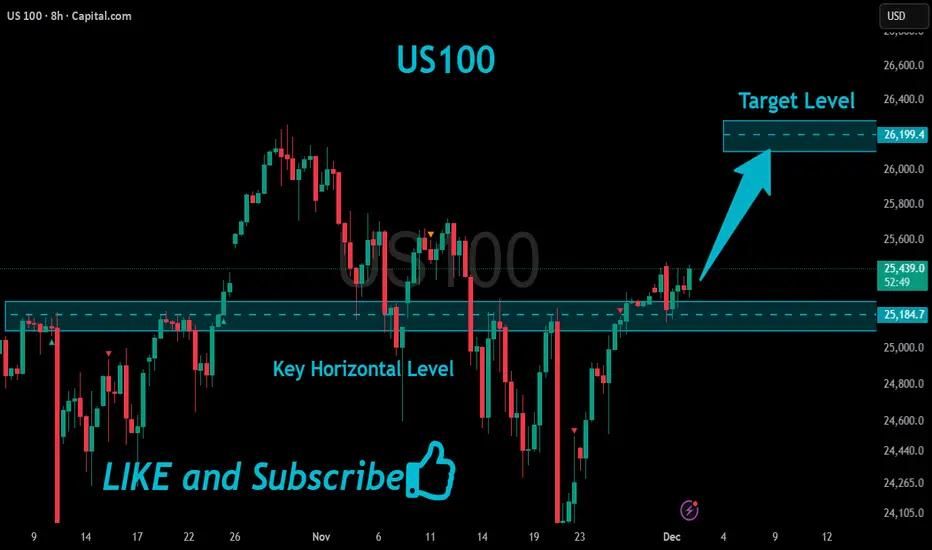
US100 Bullish Breakout!
HI,Traders !
#US100 is going up now
And made a bullish
Breakout of the key horizontal
Level of 25184.7 and the breakout
Is confirmed so we are bullish
Biased and we will be
Expecting a further
Bullish move up !
Comment and subscribe to help us grow !
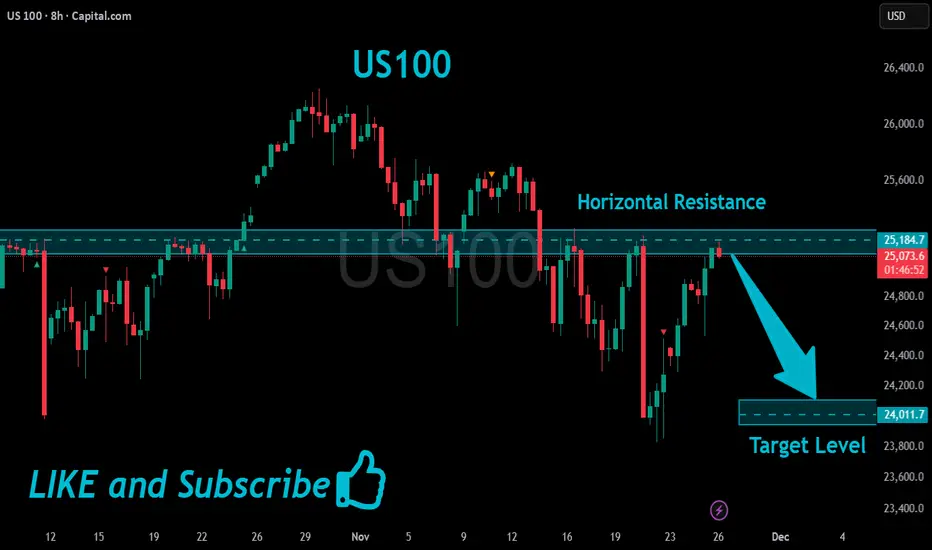
US100 Will Go Down!
HI,Traders !
#US100 already made a retest
Of the horizontal resistance
Of 25184.7 from where we
Are seeing a bearish reaction
And we will be expecting a
Further bearish move down !
Comment and subscribe to help us grow !
US100 Potential Short!
HI,Traders !
#US100 is making a rebound
But we are bearish biased
And after hits the
Horizontal resistance of 24431.8
We will be expecting a
Local bearish correction !
Comment and subscribe to help us grow !
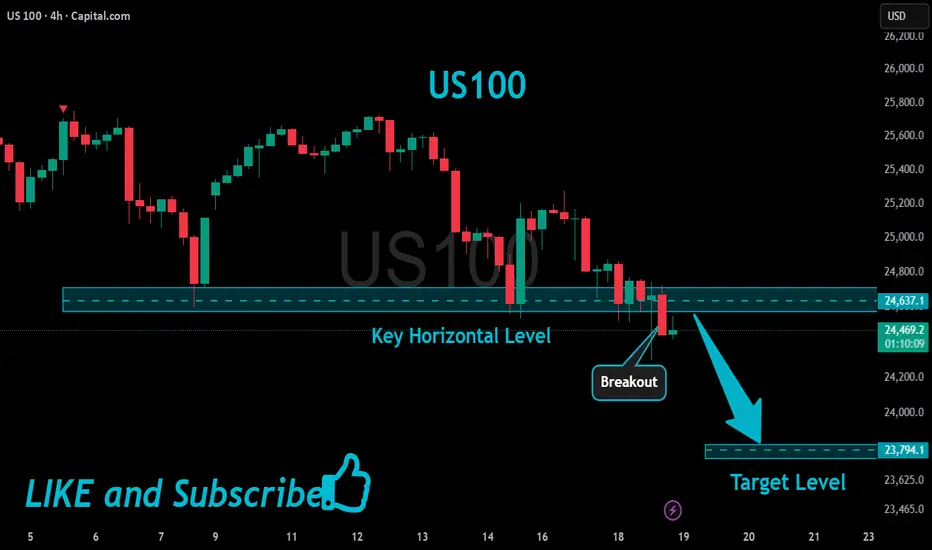
US100 Will Keep Falling!
HI,Traders !
#US100 keeps falling down
And made a strong
Bearish breakout of the key
Horizontal key level of 24637.1
And the breakout is confirmed
So we are bearish biased and
We will be expecting a further
Bearish move down !
Comment and subscribe to help us grow !
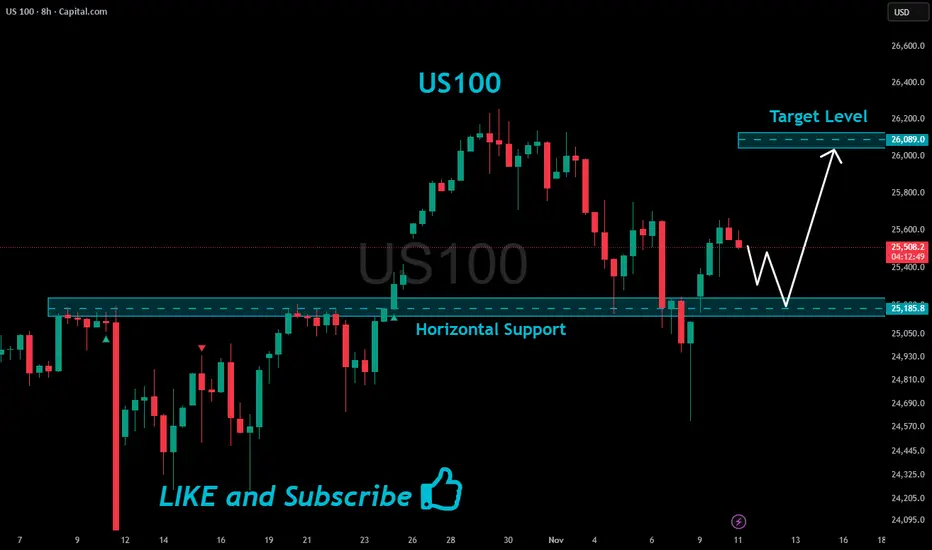
US100 Support Ahead!
HI,Traders !
#US100 is making a local
Bearish correction but
We are bullish biased mid-term
So after the pair hits the horizontal
Support of 25185.8 we will be
Expecting a local bullish rebound !
Comment and subscribe to help us grow !
US100 Resistance Ahead!
HI,Traders !
US100 is making a
Nice bullish correction
After a sharp local flash-crash
But a local horizontal resistance
Level is ahead at 25185.8
So after the retest we will
Be expecting a local
Bearish correction !
Comment and subscribe to help us grow !

US100 Will Hit Resistance Soon!
HI,Traders !
#US100 keeps growing
And the price will soon
Hit a horizontal resistance
Of 25817.8 from where
A local bearish correction
Is to be expected !
Comment and subscribe to help us grow !

US100 Will Keep Growing!
HI,Traders !
#US100 made a bullish
Breakout of the key horizontal
Level of 177.327 and the
Breakout is confirmed so
We are bullish biased
And we will be expecting
A further bullish continuation !
Comment and subscribe to help us grow !

US100 Will Go Down!
HI,Traders !
#US100 has made a retest
Of the horizontal resistance
Of 25169.1 and we are already
Seeing a bearish reaction so
We are bearish biased and
Therefore a local bearish
Pullback is to be expected !
Comment and subscribe to help us grow !

US100 Bearish Bias!
HI,Traders !
#US100 keeps growing
But a horizontal resistance
Level of 25039.3 is nearby
So after the retest of the
Level we will be expecting
A local bearish correction
On Monday !
Comment and subscribe to help us grow !

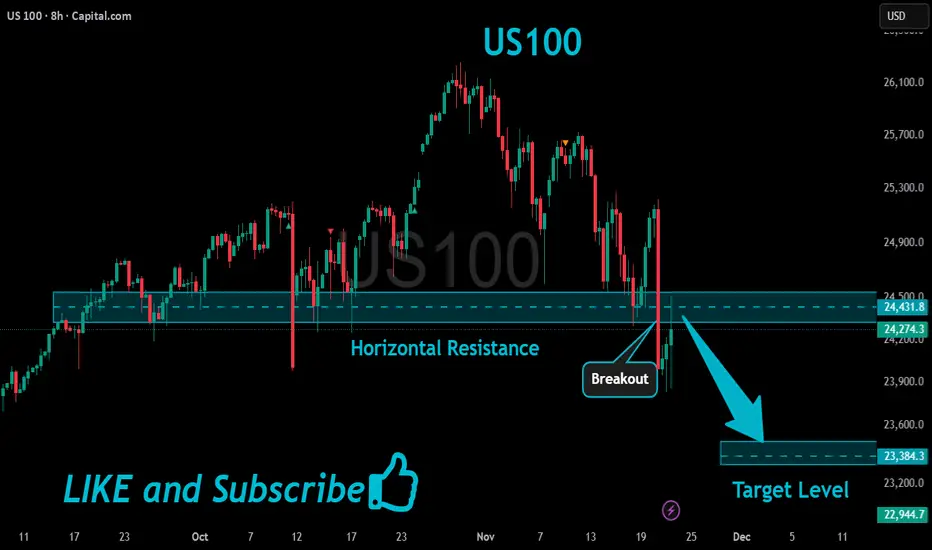
US100 Bearish Breakout!
HI,Traders !
#US100 made a bearish
Breakout of the key
Horizontal level of 24795.7
Which is now a resistance
And the breakout is confirmed
So after the potential pullback
And retest we will be expecting
A further bearish move down !
Comment and subscribe to help us grow !

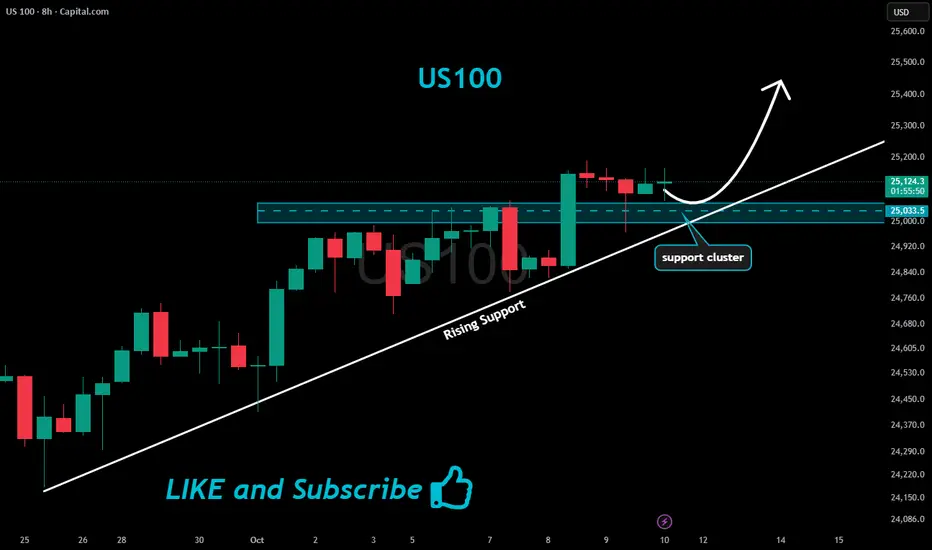
US100 Will Keep Growing!
HI,Traders !
#US100 is trading in an
Uptrend and broke
The key horizontal level
Of 25033.5 and the breakout
Is confirmed so after a potential
Retest of the support cluster
Of the rising and horizontal
Support lines below we will
Be expecting a bullish continuation !
Comment and subscribe to help us grow !
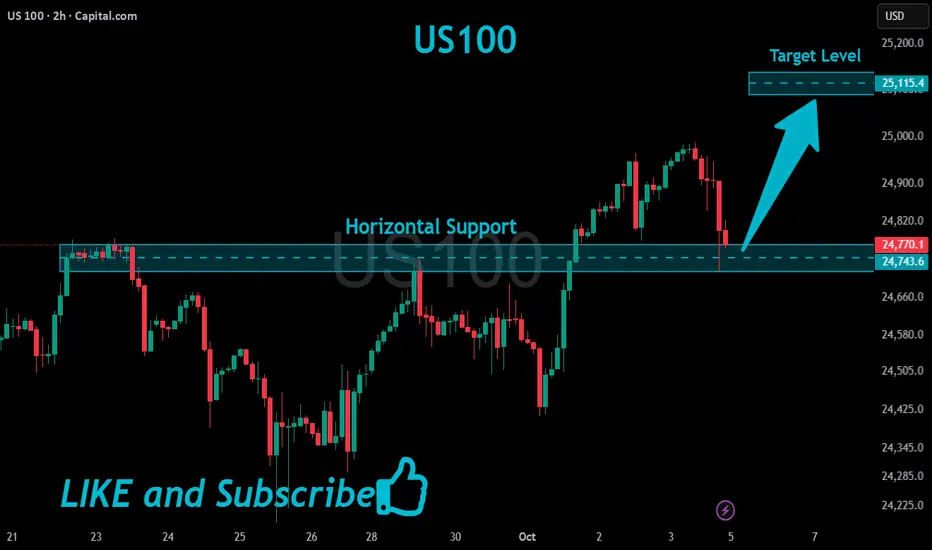
US100 Will Grow!
HI,Traders !
#US100 is trading in an
Uptrend and is
Going down to retest
The horizontal support
Around 24743.6 so after
The retest we will be
Expecting a further
Bullish move up !
Comment and subscribe to help us grow !
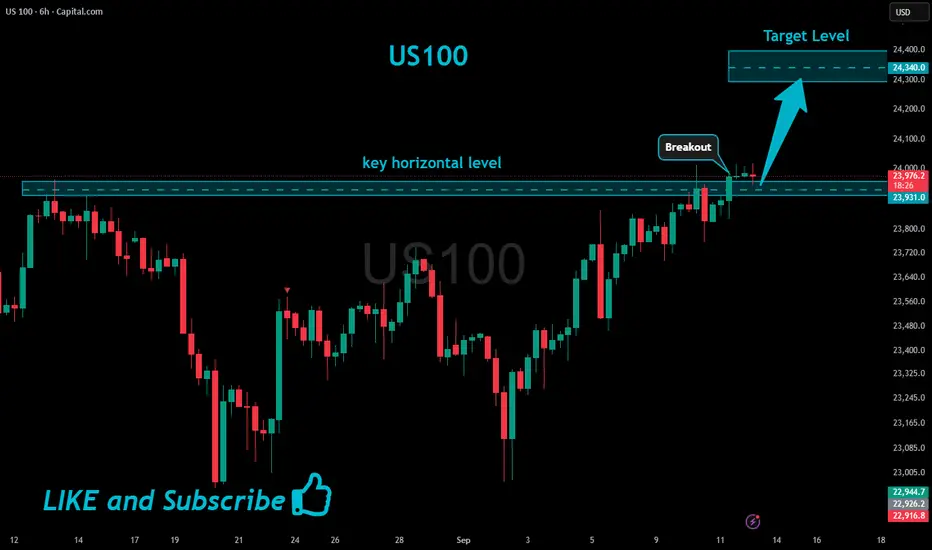
US100 Will Keep Growing!
HI,Traders !
#US100 is trading in an
Uptrend and the index broke
The key horizontal level
Around 23931.0 and the
Breakout is confirmed so
We are bullish biased
And we will be expecting a
Further bullish move up !
Comment and subscribe to help us grow !
NASDAQ NAS100 at a Crossroads: Riding Nvidias Surge with CautionThe immediate reaction to Nvidia's stellar earnings has been decidedly bullish, propelling the NASDAQ higher. We saw a classic "buy the rumor, sell the news" event where the "news" was so powerful it triggered a "fear of missing out" (FOMO) rally with a healthy correction on Friday.
In the next one to two weeks, the near-term bias is bullish, but with extreme caution. The market has received the fundamental "all-clear" it was waiting for from its most important company. However, the index is now technically overextended and sentiment is euphoric, making it vulnerable to a short-term pullback or consolidation. The primary trend, however, remains bullish IMO.
1. The Catalyst: Nvidia Earnings
Nvidia didn't just beat expectations; it shattered them and raised future guidance, validating the entire AI investment thesis.
Revenue & EPS: Significant beats on both the top and bottom lines.
Guidance: Q2 revenue guidance of ~$28B was vastly higher than analyst estimates of ~$26.6B, demonstrating unprecedented demand for its Blackwell and Hopper architecture chips.
Data Center: Revenue of $22.6B, up 427% year-over-year, is the core of the story. This shows that AI infrastructure spending is not slowing; it's accelerating.
Stock Split: The announcement of a 10-for-1 stock split adds a psychological boost for retail investors, improving accessibility and reinforcing bullish sentiment.
Analyst Interpretation: This wasn't just a quarterly report; it was a fundamental confirmation that the AI revolution has tangible, massive earnings power. It alleviated fears that the AI trade was a bubble. For the NASDAQ, which is market-cap weighted and heavily influenced by NVDA, this was rocket fuel.
2. Technical Analysis (One-Day Timeframe Post-Earnings)
Price Action: The NASDAQ gapped up powerfully at the open, breaking cleanly above its previous consolidation range. This was a strong bullish signal.
Volume: The rally was accompanied by massive volume, confirming broad institutional participation. This wasn't a low-volume grind; it was a conviction move.
3. Macro & Fundamental Backdrop
Interest Rates: The market is currently pricing in a higher-for-longer stance from the Fed. However, recent economic data (PMIs, jobless claims) has shown slight signs of softening, which keeps hopes alive for a potential rate cut later in the year. A stable, non-accelerating rate environment is acceptable for tech stocks, especially those like Nvidia with explosive earnings growth that outweighs rate concerns.
Geopolitics: While always a risk (U.S.-China tensions, elections), the market has largely shrugged off these concerns for now, choosing to focus on the stellar corporate fundamentals.
Market Breadth: A key watch-out. The rally has been narrow, led primarily by the "Magnificent 7" (now perhaps the "Fab 1" - Nvidia). For the rally to be sustainable, we need to see broader participation from other sectors and smaller-cap stocks within the NASDAQ.
4. Likely Outcome for the Next 1-2 Weeks: Bullish with a Caveat
Bullish Scenario (60% Probability):
The momentum from Nvidia is likely to carry the NASDAQ higher in the very near term. We could see a continued "melt-up" towards 17,400-17,500 as underinvested funds are forced to chase performance and add equity exposure. Any dip will likely be shallow and bought aggressively, with the 17,000 level holding firm.
Consolidation/Pullback Scenario (35% Probability):
This is the most likely healthy outcome. After such a massive, emotion-driven surge, the market is likely to need a period of digestion. We could see the NASDAQ chop sideways for a week or two to work off the overbought conditions. This would reset the momentum indicators and allow the market to build a new base for the next leg higher. This is not a bearish signal; it is a strengthening signal.
Bearish Reversal Scenario (5% Probability):
A sharp reversal below the 17,000 support level and a fill of the earnings gap (~16,900) would be a significant warning. This would likely require a new, negative macro catalyst (e.g., unexpectedly hot inflation data, a major geopolitical escalation) that forcefully changes the interest rate narrative.
Trading & Investment Implication
For Bulls / Existing Longs: Hold positions. Consider taking partial profits on extreme strength, but avoid selling your entire position. The trend is your friend. Use any pullback to the 17,000 support as a potential buying opportunity.
For New Entrants: Chasing the green spike is high-risk. Be patient. Wait for the inevitable pullback or period of consolidation to establish a position. The risk/reward is poor on the day after a massive gap up.
For Bears: Fighting this tape is exceptionally dangerous. The fundamental news from NVDA is a game-changer for the index. Shorting based solely on overbought conditions is a quick path to losses.
Final Analyst Call: The next week is likely bullish with high volatility, potentially extending gains. However, the following week is highly susceptible to a consolidation or pullback as the initial euphoria settles. The overall trajectory for the next two weeks is cautiously bullish, with the understanding that a 2-4% pullback is a normal and healthy part of a strong uptrend.
The burden of proof is now on the bears to prove they can wrestle control back from a market that just received the best possible news from its most important constituent.
Not financial advice, this is just my opinion.

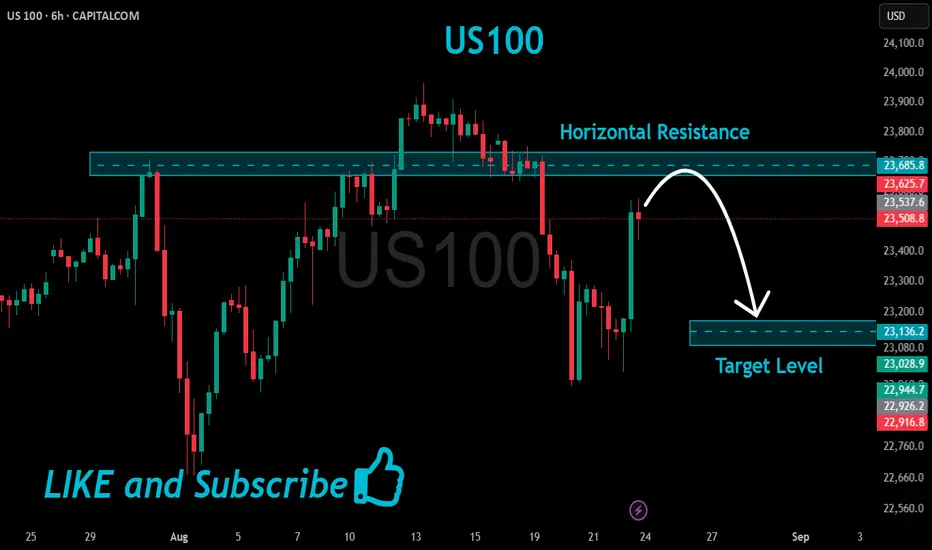
US100 Resistance Ahead!
HI,Traders !
#US100 is trading in an
Uptrend and Silver shot
Up sharply today and it
Is now locally overbought
So after the retest of the
Horizontal resistance above
At 23685.8 from where we
Will be expecting a local
Bearish move down!
Comment and subscribe to help us grow !
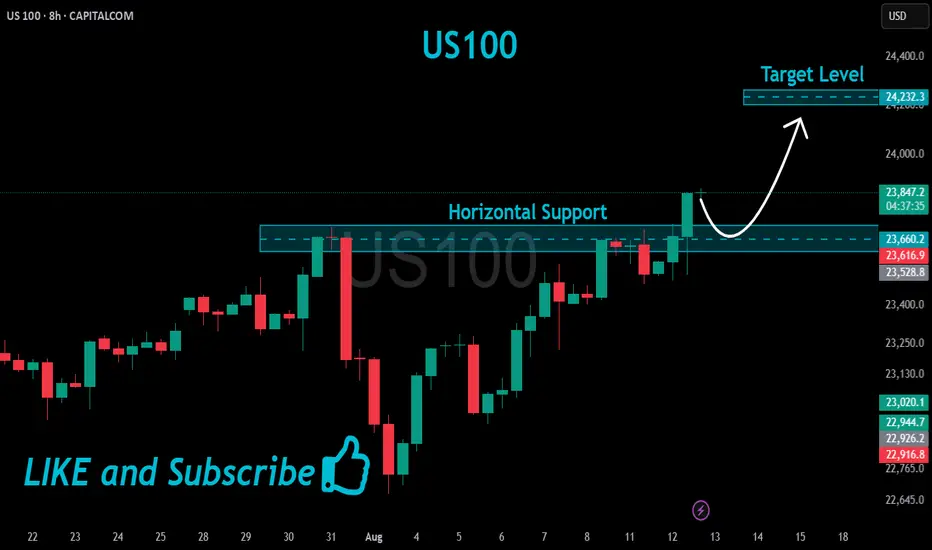
US100 Bullish Breakout!
HI,Traders !
#US100 is trading in a strong
Uptrend and the price made a
Bullish breakout of the key
Horizontal level of 23660.2
So we are bullish biased
And we will be expecting a
Further bullish move up !
Comment and subscribe to help us grow !
US100 Local Long!
HI,Traders !
#US100 made a retest
Of the horizontal support
Level of 23266.0 from where
We are already seeing a
Local bullish rebound so
We will be expecting a
Further bullish move up !
Comment and subscribe to help us grow !

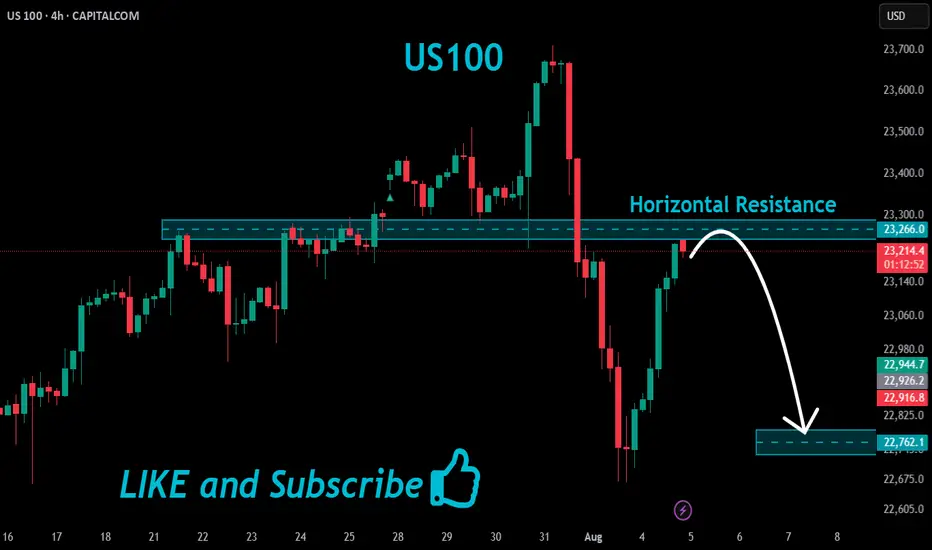
US100 Local Short!
HI,Traders !
#US100 made a retest
Of the horizontal resistance
Of 23266.0 and we are already
Seeing a bearish reaction and
We will be expecting a further
Bearish move down !
Comment and subscribe to help us grow !
US100 Bullish Breakout!
HI,Traders !
#US100 is trading in a strong
Uptrend and the price made a
Bullish breakout of the key
Horizontal level of 23261.4
So we are bullish biased
And we will be expecting a
Further bullish move up !
Comment and subscribe to help us grow !

US100 Short From Resistance!
HI,Traders !
US100 is weaker than we
Expected and failed to break
The key horizontal level
Around 22868.6 and we are
Now seeing a bearish rejection
So we are locally bearish biased
And we will be expecting a
Further bearish move down !
Comment and subscribe to help us grow !

US100 Resistance Cluster Above!
HI,Traders !
#US100 made a bearish
Breakout of the support
Cluster of the rising and
Horizontal support levels
Which is now a resistance
Cluster round 22703.9 then
Went down and made a local
Pullback on Monday but we are bearish
Biased mid-term so we
Will be expecting a further
Bearish move down this week !
Comment and subscribe to help us grow !
