US 100NASDAQ - US 100
- Completed " 13245 " Impulsive Waves and " ABCD " Corrective Waves
- Break of Structure
- RSI - Divergence
- Symmetrical Triangle as an corrective pattern in Short Time Frame
- Order Block
Us100idea

NASDAQ100 Market Structure & Pullback Strategy📈 NAS100 / US100 — NASDAQ100
Index Market Trade Opportunity Guide (Day / Swing Trade)
🔵 Market Bias
Bullish Plan Active 🟢
Momentum structure remains positive with buyers defending higher demand zones on pullbacks.
🎯 Entry Strategy (Pullback-Based Execution)
Pullback-1: Buy above 25200 🔁
Pullback-2: Buy above 24900 🔁
📌 This plan focuses on buying controlled retracements within a bullish structure rather than chasing highs.
🛑 Risk Management (Stop Loss)
SL for Pullback-1: 25000
SL for Pullback-2: 24700
⚠️ Risk Disclaimer:
Dear Ladies & Gentlemen (Thief OG’s), adjust your Stop Loss based on your own strategy and risk tolerance.
I am not recommending using only my SL — risk management is fully your responsibility.
🏁 Take Profit / Exit Zone
Target: 26000 🎯
🚨 Police Force zone ahead:
Strong resistance + overbought conditions + potential bull trap + corrective risk detected.
➡️ Kindly escape with profits once price reacts in this zone.
⚠️ TP Disclaimer:
Dear Ladies & Gentlemen (Thief OG’s), I am not recommending using only my TP. Protect profits based on your own execution rules.
👀 Related Pairs & Assets to Watch ($ Correlation)
CAPITALCOM:US30 (Dow Jones) 🏭
Confirms broader US equity strength; divergence may warn of NAS100 slowdown.
FOREXCOM:SPX500 (S&P 500) 📊
Healthy correlation — continuation supports bullish NAS100 bias.
TVC:DXY (US Dollar Index) 💵
Sharp USD strength can pressure tech valuations.
TVC:US10Y / US Treasury Yields 📉
Rising yields = headwind for growth & tech stocks.
🧠 Fundamental & Economic Factors to Consider
🔹 Federal Reserve Outlook:
Rate-cut expectations or dovish commentary tend to support NASDAQ upside.
Hawkish tone or delayed cuts may trigger volatility or pullbacks.
🔹 Inflation Data (CPI / PCE):
Cooling inflation = bullish for growth stocks
Sticky inflation = risk of corrective moves
🔹 US Labor Market (NFP / Jobless Claims):
Weakening data supports rate-cut narrative → bullish NAS100
Overheating labor data may pressure equities
🔹 Big Tech Earnings & Guidance:
NAS100 is highly sensitive to mega-cap tech outlooks (AI, cloud, semiconductors).
Positive guidance fuels continuation; cautious outlooks invite corrections.
🔹 Upcoming High-Impact Events:
FOMC statements
US CPI / PCE releases
Major US tech earnings weeks
📌 Always reduce risk or lock profits ahead of high-impact economic releases.
🧩 Final Trading Insight
📈 Trend favors buy-the-dip, not emotional breakouts.
🎯 Respect resistance zones, secure profits early, and let structure — not emotions — guide execution.
👍 If this setup adds value, support with a LIKE, BOOST, or FOLLOW for more professional index trade plans.
Trade smart. Protect capital. Let the market pay you. 💼📊

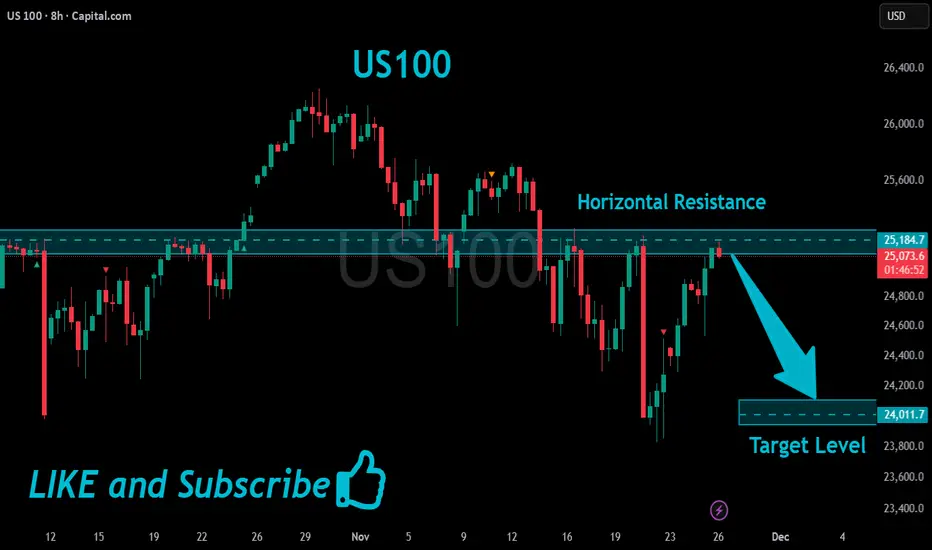
US100 Will Go Down!
HI,Traders !
#US100 already made a retest
Of the horizontal resistance
Of 25184.7 from where we
Are seeing a bearish reaction
And we will be expecting a
Further bearish move down !
Comment and subscribe to help us grow !
US100 Potential Short!
HI,Traders !
#US100 is making a rebound
But we are bearish biased
And after hits the
Horizontal resistance of 24431.8
We will be expecting a
Local bearish correction !
Comment and subscribe to help us grow !
US100 Resistance Ahead!
HI,Traders !
US100 is making a
Nice bullish correction
After a sharp local flash-crash
But a local horizontal resistance
Level is ahead at 25185.8
So after the retest we will
Be expecting a local
Bearish correction !
Comment and subscribe to help us grow !

Are Institutional Buyers Returning to NASDAQ100 Again?🎯 NASDAQ100 Blueprint: The Thief's Ultimate Heist Setup 💰
📊 Asset Overview
NASDAQ:NDX | US100 Index
Market Capital Flow Analysis - Swing Trade Setup
🔍 Technical Foundation
Bias: 🐂 BULLISH CONFIRMED
The LSMA (Least Squares Moving Average) breakout has painted the perfect picture. When institutional money flows align with technical breakouts, you know the smart money is positioning for the next leg up.
Current Market Structure:
We're witnessing a textbook bullish continuation pattern with strong momentum building above key moving averages. The index is showing resilience at support zones while eyeing psychological resistance levels ahead.
💎 The Thief's Layered Entry Strategy
Entry Philosophy: "Why catch one knife when you can catch four?" 😏
This is classic Thief-style layering - multiple limit orders spread across strategic price zones to build a position with optimal average entry:
Entry Layers (Limit Orders):
🎯 Layer 1: 24,800
🎯 Layer 2: 25,000 (Psychological level)
🎯 Layer 3: 25,200
🎯 Layer 4: 25,400
Pro tip: You can add more layers based on your risk appetite and capital allocation. Scale in gradually, not aggressively.
Alternative: If you prefer simplicity, you can enter at current market price - but layering gives you the edge when volatility strikes.
🛡️ Risk Management
Stop Loss Zone: 24,600
⚠️ Important Notice: Dear Ladies & Gentlemen (Thief OG's), this SL is MY reference point based on market structure. You are the captain of your own ship - set your stop loss according to YOUR risk tolerance and account size. Trade at your own risk!
🎯 Profit Target
Primary Target: 26,000
Why this level?
Strong historical resistance zone
Overbought territory on multiple timeframes
Potential bull trap formation area
Confluence with Fibonacci extension levels
⚠️ Exit Strategy Note: Dear Ladies & Gentlemen (Thief OG's), this TP is MY analysis. When YOU see green, YOU decide when to bank it. Take profits incrementally if you prefer safety over maximum gains. Remember: Pigs get fat, hogs get slaughtered! 🐷
🔗 Correlated Assets to Watch
These pairs move in tandem with NASDAQ100 - keep them on your radar:
📈 SP:SPX (S&P 500): The big brother index - when SPX moves, NQ100 often follows
📈 NASDAQ:QQQ (Nasdaq ETF): Direct tracking vehicle for tech-heavy momentum
📈 NASDAQ:AAPL (Apple Inc.): Largest NASDAQ component - heavy influence on index direction
📈 NASDAQ:MSFT (Microsoft): Tech titan with significant index weighting
📈 NASDAQ:NVDA (NVIDIA): Semiconductor leader driving AI narrative
📈 NASDAQ:TSLA (Tesla): High-beta play that amplifies NASDAQ moves
📈 TVC:DXY (US Dollar Index): Inverse correlation - strong dollar often pressures tech stocks
📈 TVC:TNX (10-Year Treasury Yield): Rising yields = tech pressure; falling yields = tech rally
Key Correlation Insight: Tech stocks (and thus NASDAQ) typically benefit from falling yields and weakening dollar conditions. Monitor these macro factors!
⚡ Key Technical Points
✅ LSMA breakout confirms bullish momentum shift
✅ Volume profile suggests accumulation at current levels
✅ Multiple timeframe alignment (swing trader's dream)
✅ Risk-reward ratio favors long positioning
✅ Institutional money flow indicators turning positive
⚠️ Watch for: Volatility spikes near resistance, macro news events, and Federal Reserve commentary that could impact tech valuations.
🎭 The Thief's Final Words
"In the market, you're either the heist mastermind or the one getting robbed. Choose wisely." 😎
This setup is designed for swing traders who understand that patience and proper position sizing beat FOMO every single time. Layer in, manage risk, and let the market come to you.
Remember: This isn't financial advice - it's a roadmap drawn by someone who respects the market's ability to humble even the best of us.
📢 Community Support
✨ If you find value in my analysis, a 👍 and 🚀 boost is much appreciated — it helps me share more setups with the community!
#NASDAQ100 #US100 #NQ100 #SwingTrading #TechnicalAnalysis #LSMA #LayeredEntry #ThiefStyle #IndexTrading #BullishSetup #RiskManagement #TradingStrategy #MarketAnalysis #PriceAction #SupportAndResistance #TradingIdeas #StockMarket #ForexTrading #DayTrading #TradingCommunity

US100 Will Keep Growing!
HI,Traders !
#US100 made a bullish
Breakout of the key horizontal
Level of 177.327 and the
Breakout is confirmed so
We are bullish biased
And we will be expecting
A further bullish continuation !
Comment and subscribe to help us grow !

NASDAQ100 HIGH PROBABILITY SETUPS SOON!!!🚨 NAS100 HIGH PROBABILITY BUY SETUP 🚨
* Here We Can See Clearly The Next Potential Moves For US100 Coming Hours/Days.
* Keep Your Eyes Close On Your Trading Positions.
* Happy PIP Hunting Traders.
FXKILLA.

US100 Will Go Down!
HI,Traders !
#US100 has made a retest
Of the horizontal resistance
Of 25169.1 and we are already
Seeing a bearish reaction so
We are bearish biased and
Therefore a local bearish
Pullback is to be expected !
Comment and subscribe to help us grow !

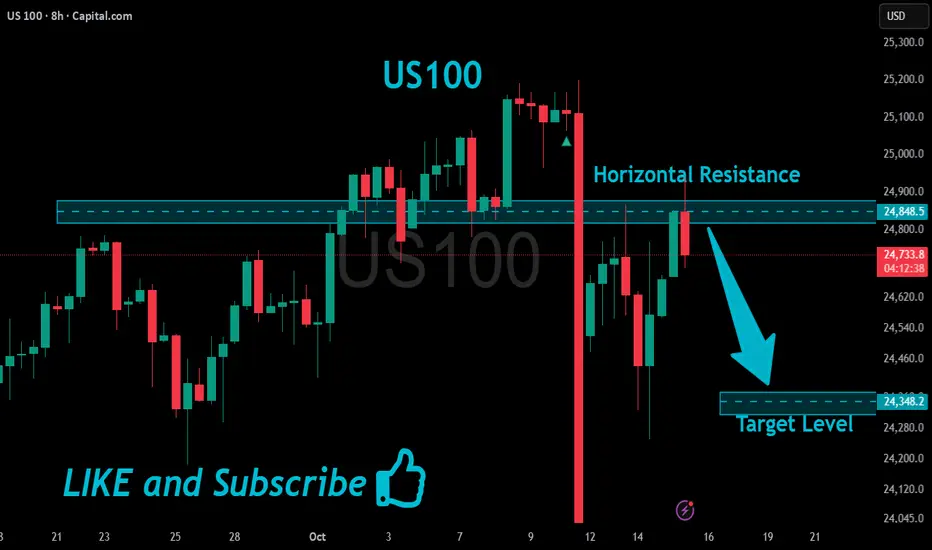
US100 Local Bearish Pullback Expected!
HI,Traders !
#US100 is hit A strong horizontal resistance
Level of 24848.5 after a sharp
Push upwards by the bulls
So a local correction is needed
From the resistance with the
Expected target being the
Local level below at 24348.2 !
Comment and subscribe to help us grow !
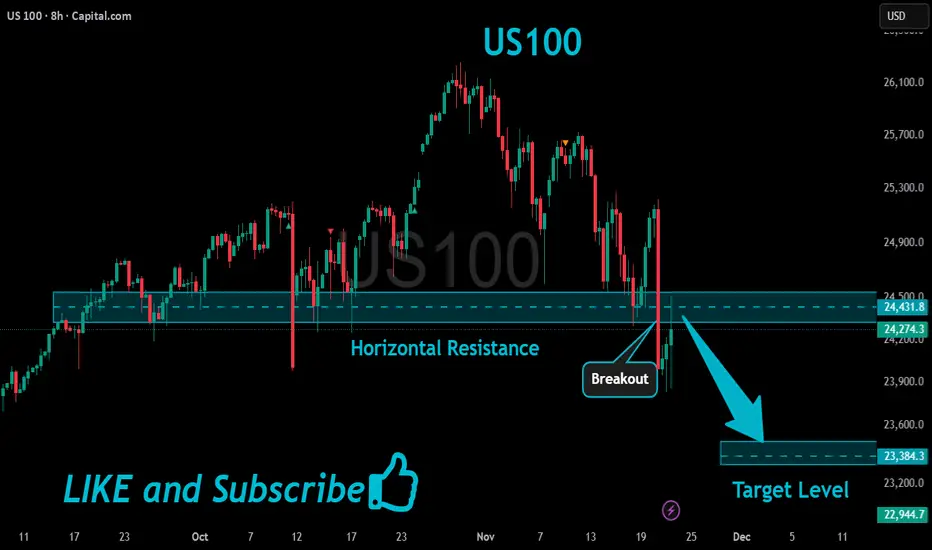
US100 Bearish Breakout!
HI,Traders !
#US100 made a bearish
Breakout of the key
Horizontal level of 24795.7
Which is now a resistance
And the breakout is confirmed
So after the potential pullback
And retest we will be expecting
A further bearish move down !
Comment and subscribe to help us grow !

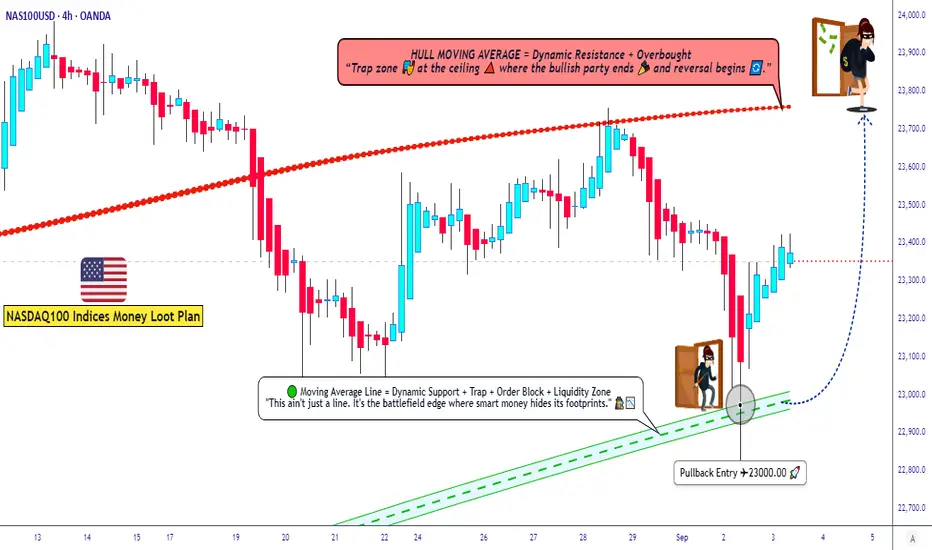
US100 Trading Plan ¦ Layering Strategy + Macro Sentiment Drivers🚀 NASDAQ100 / US100 Index – Thief Money Heist Plan 🎭
📌 Plan: Bullish Swing / Scalping Setup
Dear Ladies & Gentlemen (Thief OG’s), here’s the heist-style breakdown for US100 🔑:
🏴☠️ Entry Style (Thief Layering Strategy)
Using layered limit orders for flexibility & precision:
• 23200.0
• 23250.0
• 23300.0
• 23350.0
(You may increase limit layers based on your strategy & risk appetite)
📉 Moving Average Pullback Entry Plan
• Buy entries on pullbacks to the Fibo level 382 Triangular Moving average zone.
• Look for bullish candles confirming the bounce from these MAs.
• This offers better risk-to-reward by catching momentum on retracements instead of chasing highs.
❓ Why This Works?
• Moving averages often act as dynamic support/resistance in trending markets.
• Institutional traders & algos track them heavily, making them high-probability zones.
• Combining with layering entries = higher flexibility + reduced risk of mistimed single entry.
🛡️ Stop Loss (Protect the Vault)
• Thief SL: @23000.0
• Reminder: Adjust your SL based on your own strategy & risk tolerance.
🎯 Target (Escape Zone)
• Overbought + Trap Zone ahead!
• Escape target: @23750.0
• Note: Don’t rely only on my TP — secure profits at your own pace and risk.
📊 US100 Index CFD Real-Time Data Sep 03
📈 Daily Change: +133.47 (+0.57%)
📅 Monthly Performance: +0.76%
📆 Yearly Performance: +23.48%
😰😊 Fear & Greed Index
📊 Current Reading: 53/100 (Neutral)
🧐 Interpretation: Market sentiment is balanced, showing neither extreme fear nor greed. Investors are cautious but not panicked.
🧠 Retail vs. Institutional Sentiment
👥 Retail Traders: Moderately bullish (55% Long, 45% Short)
🏦 Institutional Traders: Slightly cautious (50% Long, 50% Short)
🔑 Key Drivers: Mixed signals from manufacturing data and upcoming labor market reports.
📉📈 Fundamental & Macro Score
📊 Macro Score: 6/10
Manufacturing PMI (48.7) still in contraction but improving.
Labor market data (JOLTS) awaited for clarity.
⚡ Volatility Score: 5/10 (Moderate)
VIX near average levels, indicating stable expectations.
💧 Liquidity Score: 7/10
Strong volume and breadth in large-cap tech stocks.
🐂🐻 Overall Market Outlook
✅ Bullish (Long): 60%
Supported by strong yearly gains and resilience in big tech.
⚠️ Bearish (Short): 40%
Concerns over manufacturing contraction and inflation pressures.
💡 Key Takeaways
📈 US100 is trending mildly positive today (+0.57%).
😐 Sentiment is neutral—no extreme fear or greed.
📊 Macro data hints at cautious optimism but watch for upcoming labor reports.
🐂 Overall bias leans slightly bullish for long-term holders.
📊 Related Pairs to Watch
FOREXCOM:SPX500
TVC:DJI
TVC:VIX
NASDAQ:NDX
FX:USDOLLAR
✨ “If you find value in my analysis, a 👍 and 🚀 boost is much appreciated — it helps me share more setups with the community!”
#NASDAQ100 #US100 #NDX #SPX500 #DJI #TradingView #SwingTrade #ScalpTrading #LayeringStrategy #MarketAnalysis
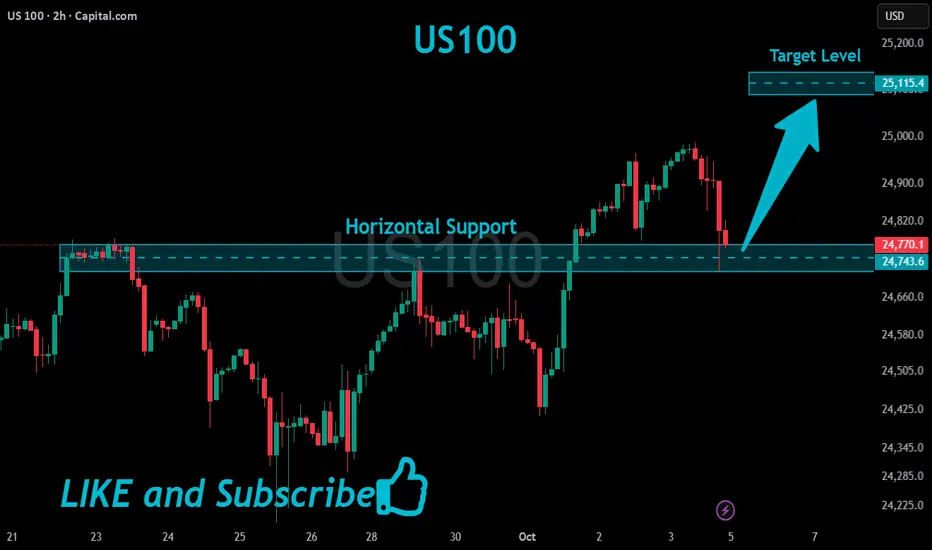
US100 Will Grow!
HI,Traders !
#US100 is trading in an
Uptrend and is
Going down to retest
The horizontal support
Around 24743.6 so after
The retest we will be
Expecting a further
Bullish move up !
Comment and subscribe to help us grow !
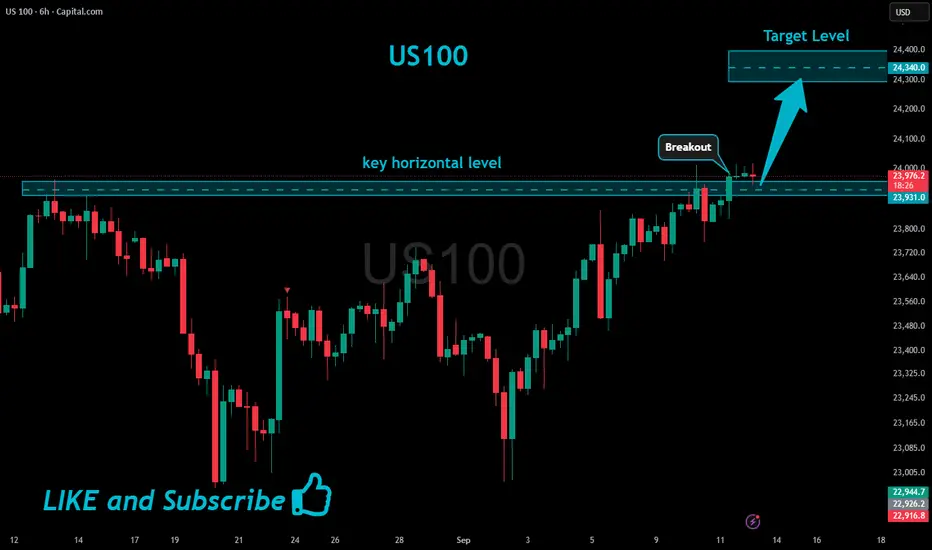
US100 Will Keep Growing!
HI,Traders !
#US100 is trading in an
Uptrend and the index broke
The key horizontal level
Around 23931.0 and the
Breakout is confirmed so
We are bullish biased
And we will be expecting a
Further bullish move up !
Comment and subscribe to help us grow !
NASDAQ NAS100 at a Crossroads: Riding Nvidias Surge with CautionThe immediate reaction to Nvidia's stellar earnings has been decidedly bullish, propelling the NASDAQ higher. We saw a classic "buy the rumor, sell the news" event where the "news" was so powerful it triggered a "fear of missing out" (FOMO) rally with a healthy correction on Friday.
In the next one to two weeks, the near-term bias is bullish, but with extreme caution. The market has received the fundamental "all-clear" it was waiting for from its most important company. However, the index is now technically overextended and sentiment is euphoric, making it vulnerable to a short-term pullback or consolidation. The primary trend, however, remains bullish IMO.
1. The Catalyst: Nvidia Earnings
Nvidia didn't just beat expectations; it shattered them and raised future guidance, validating the entire AI investment thesis.
Revenue & EPS: Significant beats on both the top and bottom lines.
Guidance: Q2 revenue guidance of ~$28B was vastly higher than analyst estimates of ~$26.6B, demonstrating unprecedented demand for its Blackwell and Hopper architecture chips.
Data Center: Revenue of $22.6B, up 427% year-over-year, is the core of the story. This shows that AI infrastructure spending is not slowing; it's accelerating.
Stock Split: The announcement of a 10-for-1 stock split adds a psychological boost for retail investors, improving accessibility and reinforcing bullish sentiment.
Analyst Interpretation: This wasn't just a quarterly report; it was a fundamental confirmation that the AI revolution has tangible, massive earnings power. It alleviated fears that the AI trade was a bubble. For the NASDAQ, which is market-cap weighted and heavily influenced by NVDA, this was rocket fuel.
2. Technical Analysis (One-Day Timeframe Post-Earnings)
Price Action: The NASDAQ gapped up powerfully at the open, breaking cleanly above its previous consolidation range. This was a strong bullish signal.
Volume: The rally was accompanied by massive volume, confirming broad institutional participation. This wasn't a low-volume grind; it was a conviction move.
3. Macro & Fundamental Backdrop
Interest Rates: The market is currently pricing in a higher-for-longer stance from the Fed. However, recent economic data (PMIs, jobless claims) has shown slight signs of softening, which keeps hopes alive for a potential rate cut later in the year. A stable, non-accelerating rate environment is acceptable for tech stocks, especially those like Nvidia with explosive earnings growth that outweighs rate concerns.
Geopolitics: While always a risk (U.S.-China tensions, elections), the market has largely shrugged off these concerns for now, choosing to focus on the stellar corporate fundamentals.
Market Breadth: A key watch-out. The rally has been narrow, led primarily by the "Magnificent 7" (now perhaps the "Fab 1" - Nvidia). For the rally to be sustainable, we need to see broader participation from other sectors and smaller-cap stocks within the NASDAQ.
4. Likely Outcome for the Next 1-2 Weeks: Bullish with a Caveat
Bullish Scenario (60% Probability):
The momentum from Nvidia is likely to carry the NASDAQ higher in the very near term. We could see a continued "melt-up" towards 17,400-17,500 as underinvested funds are forced to chase performance and add equity exposure. Any dip will likely be shallow and bought aggressively, with the 17,000 level holding firm.
Consolidation/Pullback Scenario (35% Probability):
This is the most likely healthy outcome. After such a massive, emotion-driven surge, the market is likely to need a period of digestion. We could see the NASDAQ chop sideways for a week or two to work off the overbought conditions. This would reset the momentum indicators and allow the market to build a new base for the next leg higher. This is not a bearish signal; it is a strengthening signal.
Bearish Reversal Scenario (5% Probability):
A sharp reversal below the 17,000 support level and a fill of the earnings gap (~16,900) would be a significant warning. This would likely require a new, negative macro catalyst (e.g., unexpectedly hot inflation data, a major geopolitical escalation) that forcefully changes the interest rate narrative.
Trading & Investment Implication
For Bulls / Existing Longs: Hold positions. Consider taking partial profits on extreme strength, but avoid selling your entire position. The trend is your friend. Use any pullback to the 17,000 support as a potential buying opportunity.
For New Entrants: Chasing the green spike is high-risk. Be patient. Wait for the inevitable pullback or period of consolidation to establish a position. The risk/reward is poor on the day after a massive gap up.
For Bears: Fighting this tape is exceptionally dangerous. The fundamental news from NVDA is a game-changer for the index. Shorting based solely on overbought conditions is a quick path to losses.
Final Analyst Call: The next week is likely bullish with high volatility, potentially extending gains. However, the following week is highly susceptible to a consolidation or pullback as the initial euphoria settles. The overall trajectory for the next two weeks is cautiously bullish, with the understanding that a 2-4% pullback is a normal and healthy part of a strong uptrend.
The burden of proof is now on the bears to prove they can wrestle control back from a market that just received the best possible news from its most important constituent.
Not financial advice, this is just my opinion.

NAS100 Overextended: Support or Further Downside Ahead?The NAS100 is currently overextended following Friday’s strong rally. From a technical perspective, I’m anticipating a potential retracement toward equilibrium, aligning with the 50% Fibonacci level of the prior price swing. This zone will be key in determining whether price establishes support and resumes its bullish continuation, or if a breakdown occurs that could signal further downside risk. (Not financial advice.)

NASDAQ After the Fireworks: Bearish Setup LoadedAfter the classic 4th of July rally, I stepped in on the short side of Nasdaq, targeting 22,000 and 21,400 zones. The market structure shows exhaustion, and with the cloud retest failing to hold new highs, I positioned accordingly.
Technical:
• Price stalled at prior expansion highs with tight compression near 23,000.
• Daily FibCloud offered resistance confirmation.
• Bearish risk-reward skew forms after extended rally and thin retraces.
• Volume divergence spotted.
Fundamentals:
Multiple overlapping uncertainties:
• Trump confirmed tariffs will take effect on August 1, threatening a 10% surcharge on BRICS-aligned nations.
• Treasury Secretary Bessent anticipates several trade deal announcements within 48h—but stresses quality over quantity.
• Bank of America maintains its base case of 0 rate cuts in 2025, citing strong economic data and sticky inflation risks.
The combination of tariff escalation, hawkish monetary expectations, and global trade friction creates a perfect backdrop for volatility and correction—especially in overextended tech indices like the Nasdaq.
Note: Please remember to adjust this trade idea according to your individual trading conditions, including position size, broker-specific price variations, and any relevant external factors. Every trader’s situation is unique, so it’s crucial to tailor your approach to your own risk tolerance and market environment.

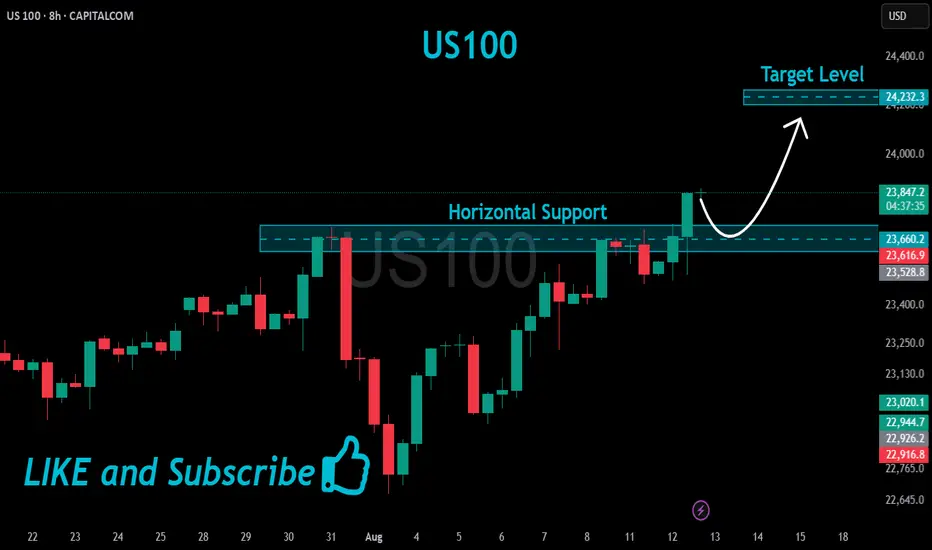
US100 Bullish Breakout!
HI,Traders !
#US100 is trading in a strong
Uptrend and the price made a
Bullish breakout of the key
Horizontal level of 23660.2
So we are bullish biased
And we will be expecting a
Further bullish move up !
Comment and subscribe to help us grow !
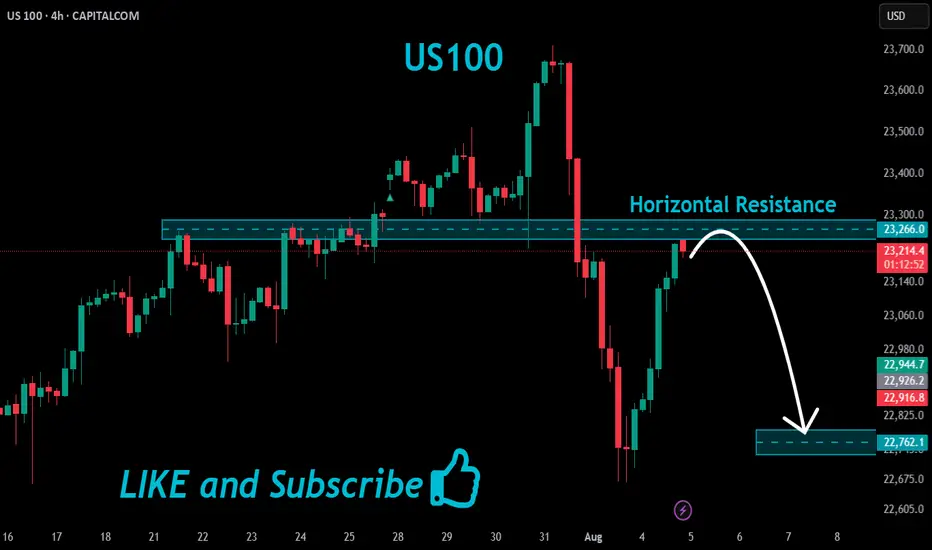
US100 Local Short!
HI,Traders !
#US100 made a retest
Of the horizontal resistance
Of 23266.0 and we are already
Seeing a bearish reaction and
We will be expecting a further
Bearish move down !
Comment and subscribe to help us grow !
NAS100 Nasdaq Range-Bound: What Traders Should Watch Next US100I'm currently keeping a close eye on the Nasdaq 🧠📊, which is trading within a range-bound structure 📉📈. While we’re seeing some bullish momentum on the NAS100 4-hour chart today ⏱️📈, it’s nothing particularly strong or decisive just yet. I’m waiting for a clear break 🔓 either above or below this current range before considering any trading opportunities 🎯.
In this US100 chart 🖼️, I’ve highlighted key components such as price action, market structure, the prevailing trend, and other important elements of technical analysis 🧩📐.
⚠️ Please remember: this is a market analysis and reflects my personal opinion — not a trade recommendation. Always do your own due diligence 🕵️♂️ before making any trading decisions. This is not financial advice.

US100 Short From Resistance!
HI,Traders !
US100 is weaker than we
Expected and failed to break
The key horizontal level
Around 22868.6 and we are
Now seeing a bearish rejection
So we are locally bearish biased
And we will be expecting a
Further bearish move down !
Comment and subscribe to help us grow !

NAS100 Reading Market Structure: When to Trade and When to WaitI'm currently keeping a close eye on the NASDAQ 📉. Price has remained largely range-bound over the past few sessions and continues to show signs of pressure 🔻. While we've seen a short-term rally 🚀, it lacks the conviction and momentum typically seen in stronger trending environments 📊.
When comparing the current conditions to previous trend phases, the difference is clear. Structure is unclear, and there's no confirmation of sustained direction yet. As shown on the chart 📈, we previously saw strong bullish momentum followed by a sharp shift, suggesting indecision in the market 🤔.
In these situations, patience is key ⏳. It's just as important to know when not to trade as it is to know when to act 🎯. For now, I’m choosing to stay on the sidelines until a clearer trend develops.
Not financial advice ⚠️

US100 Resistance Cluster Above!
HI,Traders !
#US100 made a bearish
Breakout of the support
Cluster of the rising and
Horizontal support levels
Which is now a resistance
Cluster round 22703.9 then
Went down and made a local
Pullback on Monday but we are bearish
Biased mid-term so we
Will be expecting a further
Bearish move down this week !
Comment and subscribe to help us grow !
