US100 Short From Resistance!
HI,Traders !
#US100 made a retest
Of the horizontal resistance
Of 25725.0 from where we
Are already seeing a local
Bearish reaction so a further
Move down is to be expected !
Comment and subscribe to help us grow !
Us100long

NASDAQ100 Breakout Watch — Is a New Upside Leg Starting Now?📈 NASDAQ100 Swing Trade Opportunity — Bullish Breakout Play
🟩 Asset: NASDAQ100 (Index CFD)
⚡ Trade Type: Swing Trade — Bullish Plan Confirmed
🧭 Trade Thesis
The index has confirmed a bullish setup following a Triangle + Moving Average breakout, strengthening upward momentum and favoring dip-buying behavior.
To reflect the Thief layering method, this plan uses multiple staggered limit orders to accumulate positions efficiently across volatility pockets.
📌 Entry Plan (Thief Layering Method)
💰 Entry Style: “Any price level allowed — Thief uses layers”
Buy Limit Layers:
24,900
25,000
25,100
25,200
(Feel free to increase or customize layers to fit your personal risk and liquidity preference.)
🛑 Stop-Loss (SL)
🔻 Thief SL: 24,500
Dear Ladies & Gentlemen (Thief OG’s), adjust SL based on your personal risk and strategy.
This is not a fixed recommendation, only a reference zone.
🎯 Target (TP)
⚡ The High-Voltage Electric Gate Zone around 26,200 acts as major resistance because of:
Overbought readings
High-liquidity trap behavior
Historical reversal probability
Exit with profits before heavy sellers activate.
Again — you decide your own TP based on your risk tolerance, not mine.
📊 Market Logic Behind the Move
Breakout structure confirmed
Trend continuation supported by triangle compression
Index ETF flows show short-covering + rotation back into tech
Momentum accelerates above 25,200 zones
Cleaner upside path until liquidity wall at 26,200
🔎 Related Pairs to Watch (Correlation Insight)
1️⃣ NASDAQ:NDX / NASDAQ:QQQ
Direct ETF mirror of NASDAQ100
Useful for checking volume, market depth, and real-time breakout confirmation
2️⃣ SP:SPX / NYSE:ES (S&P 500)
High correlation (approx. 0.85+)
A strong SPX supports tech continuation; weakness warns of index-wide pullback
3️⃣ TVC:VIX (Volatility Index)
Inverse correlation
If VIX stays below key volatility thresholds, bullish NASDAQ continuation is more reliable
4️⃣ FX:USDOLLAR / DXY
Tech usually performs better when the Dollar weakens
A rising Dollar can slow or cap NASDAQ bullish momentum
5️⃣ TVC:US10Y / Yields
NASDAQ moves inversely with yields
If yields drop, NASDAQ accelerates
If yields spike, prepare for turbulence or failed breakouts
📘 Summary
Bullish plan confirmed via Triangle + MA Breakout
Thief layering entries positioned smartly into volatility
SL/TP guidance flexible for trader customization
Strong correlation checks available across SP:SPX , TVC:VIX , TVC:DXY & yields
US 100NASDAQ - US 100
- Completed " 13245 " Impulsive Waves and " ABCD " Corrective Waves
- Break of Structure
- RSI - Divergence
- Symmetrical Triangle as an corrective pattern in Short Time Frame
- Order Block

NASDAQ100 Market Structure & Pullback Strategy📈 NAS100 / US100 — NASDAQ100
Index Market Trade Opportunity Guide (Day / Swing Trade)
🔵 Market Bias
Bullish Plan Active 🟢
Momentum structure remains positive with buyers defending higher demand zones on pullbacks.
🎯 Entry Strategy (Pullback-Based Execution)
Pullback-1: Buy above 25200 🔁
Pullback-2: Buy above 24900 🔁
📌 This plan focuses on buying controlled retracements within a bullish structure rather than chasing highs.
🛑 Risk Management (Stop Loss)
SL for Pullback-1: 25000
SL for Pullback-2: 24700
⚠️ Risk Disclaimer:
Dear Ladies & Gentlemen (Thief OG’s), adjust your Stop Loss based on your own strategy and risk tolerance.
I am not recommending using only my SL — risk management is fully your responsibility.
🏁 Take Profit / Exit Zone
Target: 26000 🎯
🚨 Police Force zone ahead:
Strong resistance + overbought conditions + potential bull trap + corrective risk detected.
➡️ Kindly escape with profits once price reacts in this zone.
⚠️ TP Disclaimer:
Dear Ladies & Gentlemen (Thief OG’s), I am not recommending using only my TP. Protect profits based on your own execution rules.
👀 Related Pairs & Assets to Watch ($ Correlation)
CAPITALCOM:US30 (Dow Jones) 🏭
Confirms broader US equity strength; divergence may warn of NAS100 slowdown.
FOREXCOM:SPX500 (S&P 500) 📊
Healthy correlation — continuation supports bullish NAS100 bias.
TVC:DXY (US Dollar Index) 💵
Sharp USD strength can pressure tech valuations.
TVC:US10Y / US Treasury Yields 📉
Rising yields = headwind for growth & tech stocks.
🧠 Fundamental & Economic Factors to Consider
🔹 Federal Reserve Outlook:
Rate-cut expectations or dovish commentary tend to support NASDAQ upside.
Hawkish tone or delayed cuts may trigger volatility or pullbacks.
🔹 Inflation Data (CPI / PCE):
Cooling inflation = bullish for growth stocks
Sticky inflation = risk of corrective moves
🔹 US Labor Market (NFP / Jobless Claims):
Weakening data supports rate-cut narrative → bullish NAS100
Overheating labor data may pressure equities
🔹 Big Tech Earnings & Guidance:
NAS100 is highly sensitive to mega-cap tech outlooks (AI, cloud, semiconductors).
Positive guidance fuels continuation; cautious outlooks invite corrections.
🔹 Upcoming High-Impact Events:
FOMC statements
US CPI / PCE releases
Major US tech earnings weeks
📌 Always reduce risk or lock profits ahead of high-impact economic releases.
🧩 Final Trading Insight
📈 Trend favors buy-the-dip, not emotional breakouts.
🎯 Respect resistance zones, secure profits early, and let structure — not emotions — guide execution.
👍 If this setup adds value, support with a LIKE, BOOST, or FOLLOW for more professional index trade plans.
Trade smart. Protect capital. Let the market pay you. 💼📊

NAS100 Shows Strong Bullish Structure After Pullback📈 NASDAQ100 (NAS100) | Bullish Swing Trade Opportunity 🎯
Market Trade Opportunity Guide — SMA Pullback Strategy
🔥 TRADE SETUP SUMMARY
Asset: NAS100/US100 (NASDAQ-100 Index)
Timeframe: Swing Trade
Strategy: Bullish Simple Moving Average (SMA) Pullback
Bias: 🟢 BULLISH CONFIRMED
📍 ENTRY POINTS
Flexible Entry Strategy:
✅ Any price level entry acceptable (DCA approach recommended)
✅ Optimal entry zones: SMA support pullback levels
✅ Consider scaling into positions on dips
✅ Volume confirmation at entry crucial for momentum
🛑 STOP LOSS MANAGEMENT
Primary SL Level: 25,200
⚠️ DISCLAIMER: This is a reference level only. Adjust your stop loss based on:
✓ Your personal risk management strategy
✓ Individual account risk tolerance
✓ Position sizing preferences
✓ Your trading experience & capital allocation
Your responsibility: Set SL that fits YOUR risk profile. Don't rely solely on suggested levels.
🎯 PROFIT TARGETS
Primary Target: 26,100
Key Resistance Factors:
📊 High voltage resistance zone
📈 Overbought conditions detected
⚡ Trap risk at elevated levels
💡 Recommend: Take partial profits, don't go all-in
⚠️ DISCLAIMER: TP level is reference only. Manage profits based on:
✓ Your personal trading objectives
✓ Risk/reward ratio preferences
✓ Market momentum confirmation
✓ Your own technical analysis
Exit Strategy: Capture gains systematically. Don't be greedy—take money when available.
📊 RELATED PAIRS TO MONITOR (Correlation Analysis)
Major USD Pairs to Monitor:
EUR/USD 💶 — Current: 1.1713 | Bias: 🔵 Bearish $ | Correlation: INVERSE (Risk sentiment driver)
GBP/USD 🇬🇧 — Current: 1.3381 | Bias: 🔵 Bearish $ | Correlation: INVERSE (Tech growth proxy)
USD/JPY 🇯🇵 — Current: 155.00 | Bias: 🟢 Bullish $ | Correlation: INVERSE (Carry trade impact)
USD/CAD 🇨🇦 — Current: 1.38 | Bias: 🔵 Bearish $ | Correlation: INVERSE (Risk-off correlation)
Correlation Insights:
Weaker USD = Better for tech stocks (positive NAS100). Stronger JPY carry = Risk-off mood (negative NAS100). Watch EUR/USD & GBP/USD for broader sentiment shifts—these are your early warning indicators for tech sector rotation.
🌍 FUNDAMENTAL & ECONOMIC FACTORS (December 2025)
Fed Monetary Policy 🏦
✅ Latest Decision (December 10, 2025):
Rate cut: 25 basis points (0.25%)
New target range: 3.50%-3.75%
3rd consecutive rate cut in 2025
Divided vote: 9 for cuts, 3 dissenting
Market Implication: Powell signals "patience" on further cuts—limited cuts expected in 2026 (only 1-2 projected). This is a headwind for aggressive tech rallies but supports intermediate tech strength.
Inflation Status 📊
PCE Inflation (September 2025): 2.8% (above 2% target)
Trend: Inflation moved UP since earlier 2025, remains "somewhat elevated"
Outlook: Expected to remain above 2% through 2026
Tariff Risk: Trump tariffs expected to push inflation higher in 2026
Market Implication: Persistent inflation limits Fed's ability to cut rates aggressively. Tech valuations face pressure from higher rates. Expect volatility from tariff-related inflation surprises.
Employment & Labor Market 👥
Job gains: Slowed significantly in 2025
Unemployment rate: Edged up through September (at 4.4%)
Fed assessment: "Downside risks to employment rose in recent months"
Tone: Labor market showing weakness, supporting rate cuts
Market Implication: Weaker jobs data = positive for equities (lower rates). But lack of October/November data due to govt shutdown creates uncertainty going into 2026.
Economic Growth 📈
GDP Growth (Fed projection 2026): 2.3% (raised from 2.0%)
Current pace: "Moderate expansion" of economic activity
Outlook: Modest growth expected, not recessionary
Market Implication: No recession expected. Growth supports equity rallies like NAS100, but tariffs could dampen 2026 growth trajectory.
Key Macro Risks for 2026 ⚠️
Tariff Impact: Trump tariffs likely to increase inflation and reduce growth
Rate Uncertainty: Fed Chairman succession unclear; policy direction murky
Government Data Gaps: October/November data delayed; information asymmetry high
Market Expectations Divergence: Fed members divided on future rate path
Bond Yields: Higher yields = headwind for high-multiple tech stocks
📅 KEY UPCOMING EVENTS TO WATCH
January 2026: Fed Chair decision; delayed employment/inflation data releases
Q1 2026: Tariff implementation timeline clarity
2026 FOMC Meetings: Only 1-2 rate cuts priced vs. 3+ in 2025
🎯 TRADE BIAS CONCLUSION
Technical: 🟢 Bullish (SMA support confirmed)
Macro: 🟡 Cautious (Fed pause, tariff uncertainty)
Composite: 🟢 BUY dips toward 25,200 | Target 26,100 | Manage risk aggressively
📌 RISK DISCLAIMER
✅ All trading involves risk. No guarantees on outcomes.
✅ Past performance ≠ future results
✅ Use proper position sizing & risk management
✅ Trade with only capital you can afford to lose
✅ This is analysis, not financial advice

NASDAQ100 Technical Roadmap for Swing Traders📈 NASDAQ100 Bullish Swing Setup — Pullback to Power Move?
Asset:
NAS100 / US100 — NASDAQ 100 Index 💻📊
Market Type: Index
Trade Style: Swing Trade
📌 Market Plan (Bias):
🟢 Bullish structure confirmed
Price is respecting the Triangular Moving Average (TMA) pullback, signaling continuation strength within the broader uptrend.
🎯 Entry Strategy:
✅ Any Price Level Entry (Layered Approach Allowed)
Layering / Scaling-In Method:
This plan uses a multiple limit order (layering) strategy to optimize average entry during pullbacks.
Buy Limit Layers:
24900
25000
25100
📌 (You may increase or adjust layers based on your own risk and capital allocation)
🛑 Stop Loss (Risk Control):
🔴 Thief SL: 24700
📢 Adjust your stop loss according to your personal risk management and strategy.
This level invalidates the bullish pullback structure if broken.
🎯 Target / Exit Plan:
🟠 Primary Target: 25800
📌 Rationale:
Strong resistance zone
Overbought conditions may appear
Trap potential near highs
Possible corrective move from resistance
💡 Action: Secure profits near resistance — don’t overstay.
⚠️ Risk Disclaimer:
📢 Stop loss and target levels are for educational purposes only.
📢 Always manage risk independently and trade responsibly.
🔗 Related Markets to Watch (Correlation & Confirmation):
📊 US Indices (Direct Correlation):
US30 (Dow Jones) 🏭
→ Strength confirms broad US equity participation
SPX500 (S&P 500) 📈
→ Institutional flow confirmation for NASDAQ strength
💵 USD Index & Rates (Inverse / Indirect Impact):
DXY (US Dollar Index) 💲
→ Strong USD can slow tech upside; weakness supports NAS100
US10Y Treasury Yield 📉
→ Falling yields = bullish for growth & tech stocks
🧠 Risk Sentiment Assets:
BTC/USD ₿
→ Risk-on flows often align with NASDAQ momentum
VIX (Volatility Index) ⚡
→ Rising VIX = caution; falling VIX = trend continuation
💬 Final Note:
📈 Follow structure, respect risk, scale wisely.
🧠 Let price confirm — don’t chase.
👍 If this plan helps your analysis, boost with a like and share your view.

NAS100 | Bullish Bounce Off Pullback SupportMomentum: Bullish
Price is currently above the ichimoku cloud.
Buy entry: 25,308.70
- Pullback support
- 23.6% Fib retracement
Stop Loss: 25,092.80
- Multi-swing low support
Take Profit: 25,553.90
- Swing high resistance
- 127.2% Fib extension
High Risk Investment Warning
Stratos Markets Limited (tradu.com/uk ), Stratos Europe Ltd (tradu.com/eu ):
CFDs are complex instruments and come with a high risk of losing money rapidly due to leverage. 70% of retail investor accounts lose money when trading CFDs with this provider. You should consider whether you understand how CFDs work and whether you can afford to take the high risk of losing your money.
Stratos Global LLC (tradu.com/en ): Losses can exceed deposits.
Please be advised that the information presented on TradingView is provided to Tradu (‘Company’, ‘we’) by a third-party provider (‘TFA Global Pte Ltd’). Please be reminded that you are solely responsible for the trading decisions on your account. Any information and/or content is intended entirely for research, educational and informational purposes only and does not constitute investment or consultation advice or investment strategy. The information is not tailored to the investment needs of any specific person and therefore does not involve a consideration of any of the investment objectives, financial situation or needs of any viewer that may receive it. Past performance is not a reliable indicator of future results. Actual results may differ materially from those anticipated in forward-looking or past performance statements. We assume no liability as to the accuracy or completeness of any of the information and/or content provided herein and the Company cannot be held responsible for any omission, mistake nor for any loss or damage including without limitation to any loss of profit which may arise from reliance on any information supplied by TFA Global Pte Ltd.

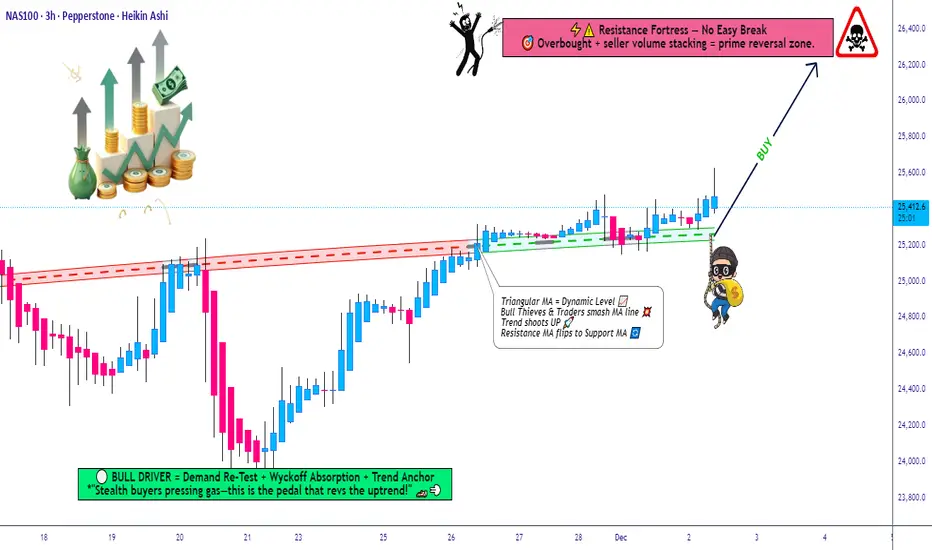
US100 Reversal Map – Hull MA + Heikin Ashi Confirmation🧠 US100 / NASDAQ100 Profit Pathway Setup — The Thief’s Bullish Escape Plan! 💰🚀
📊 Market Bias: Bullish (Day Trade Setup)
The Thief Trader has spotted a golden pathway in the NASDAQ100 (US100)!
Here’s the breakdown of the plan — straight from the thief’s vault 🕵️♂️📈
🎯 Plan Overview
Bias: Bullish continuation confirmed
Technical Confirmation:
✅ Double Pullback on Hull Moving Average
✅ Retest Zone successfully defended
✅ Heikin Ashi Bullish Doji signaled a trend reversal confirmation
💡 Momentum is shifting upward — the trend has officially changed!
💎 Entry Strategy (Layered Thief Style)
The Thief Strategy applies a layered entry method — multiple buy limits to average into strength.
📥 Buy Limit Layers:
25,300
25,400
25,500
25,600
(Traders can adjust or add more layers based on risk appetite and confirmation zones.)
🛡️ Stop-Loss Setup
This is the Thief SL @ 25,100
⚠️ Note to Thief OG’s:
I’m not recommending my SL as your SL — always customize risk and secure your own bag. Manage your position with discipline and independence! 💼
🎯 Take-Profit Zone
Target: 26,200
🚨 The Police Barricade Zone acts as a strong resistance — overbought levels spotted and potential bull trap alert!
Kindly exit with profit before the officers arrive. 😎
⚠️ Note: Profit-taking is at your discretion. Book and Run!
📈 Related Pairs to Watch (Correlation Insight)
NASDAQ:NDX / CAPITALCOM:US100 / NASDAQ:QQQ : All mirror NASDAQ movement.
SP:SPX / AMEX:SPY : Often correlate with NASDAQ’s momentum (watch divergence for clues).
TVC:VIX : If volatility spikes, expect pullbacks on tech-heavy indices.
TVC:DXY : A weak dollar often fuels US100 bullish legs — keep an eye on it.
NASDAQ:AAPL / NASDAQ:MSFT / NASDAQ:NVDA : Leading drivers of NASDAQ — if they pump, the index follows. 💪
🧩 Key Insights
Hull MA alignment confirms momentum shift.
Retest + bullish Heikin Ashi Doji = market reversal confirmation.
Layered entries give flexibility in volatile intraday conditions.
Dynamic risk management is key — never marry a position.
✨ “If you find value in my analysis, a 👍 and 🚀 boost is much appreciated — it helps me share more setups with the community!”
#US100 #NASDAQ100 #ThiefTrader #DayTrading #IndexTrading #HullMA #HeikinAshi #LayeredEntries #TechnicalAnalysis #TradingSetup #PriceAction #MarketReversal #TradingCommunity #BullishPlan #SmartMoneyFlow #TradeIdeas #ThiefStrategy

US100 Will Keep Growing!
HI,Traders !
#US100 made a bullish
Breakout of the key horizontal
Level of 177.327 and the
Breakout is confirmed so
We are bullish biased
And we will be expecting
A further bullish continuation !
Comment and subscribe to help us grow !

NASDAQ100 HIGH PROBABILITY SETUPS SOON!!!🚨 NAS100 HIGH PROBABILITY BUY SETUP 🚨
* Here We Can See Clearly The Next Potential Moves For US100 Coming Hours/Days.
* Keep Your Eyes Close On Your Trading Positions.
* Happy PIP Hunting Traders.
FXKILLA.

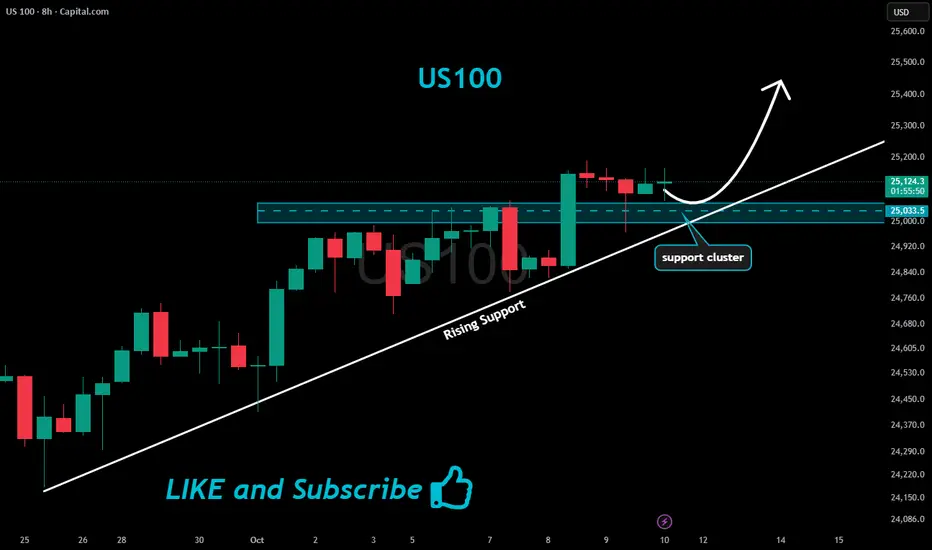
US100 Will Keep Growing!
HI,Traders !
#US100 is trading in an
Uptrend and broke
The key horizontal level
Of 25033.5 and the breakout
Is confirmed so after a potential
Retest of the support cluster
Of the rising and horizontal
Support lines below we will
Be expecting a bullish continuation !
Comment and subscribe to help us grow !
NASDAQ100 HIGH PROBABILITY SETUP SOON!!!🚨 NAS100 HIGH PROBABILITY BUY SETUP 🚨
* Here We Can See Clearly The Next Potential Move For US100 Coming Hours/Days.
* Keep Your Eyes Close On Your Trading Positions.
* Happy PIP Hunting Traders.
FXKILLA.

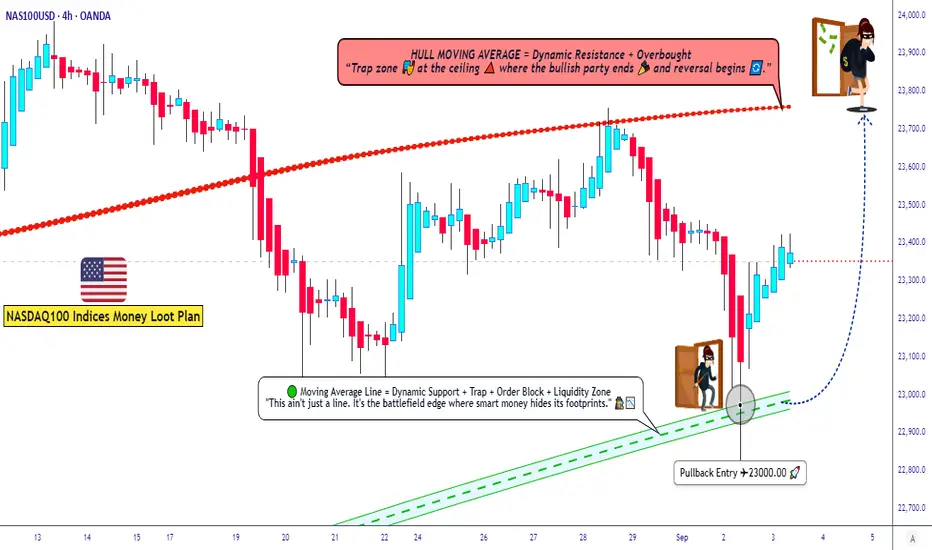
US100 Trading Plan ¦ Layering Strategy + Macro Sentiment Drivers🚀 NASDAQ100 / US100 Index – Thief Money Heist Plan 🎭
📌 Plan: Bullish Swing / Scalping Setup
Dear Ladies & Gentlemen (Thief OG’s), here’s the heist-style breakdown for US100 🔑:
🏴☠️ Entry Style (Thief Layering Strategy)
Using layered limit orders for flexibility & precision:
• 23200.0
• 23250.0
• 23300.0
• 23350.0
(You may increase limit layers based on your strategy & risk appetite)
📉 Moving Average Pullback Entry Plan
• Buy entries on pullbacks to the Fibo level 382 Triangular Moving average zone.
• Look for bullish candles confirming the bounce from these MAs.
• This offers better risk-to-reward by catching momentum on retracements instead of chasing highs.
❓ Why This Works?
• Moving averages often act as dynamic support/resistance in trending markets.
• Institutional traders & algos track them heavily, making them high-probability zones.
• Combining with layering entries = higher flexibility + reduced risk of mistimed single entry.
🛡️ Stop Loss (Protect the Vault)
• Thief SL: @23000.0
• Reminder: Adjust your SL based on your own strategy & risk tolerance.
🎯 Target (Escape Zone)
• Overbought + Trap Zone ahead!
• Escape target: @23750.0
• Note: Don’t rely only on my TP — secure profits at your own pace and risk.
📊 US100 Index CFD Real-Time Data Sep 03
📈 Daily Change: +133.47 (+0.57%)
📅 Monthly Performance: +0.76%
📆 Yearly Performance: +23.48%
😰😊 Fear & Greed Index
📊 Current Reading: 53/100 (Neutral)
🧐 Interpretation: Market sentiment is balanced, showing neither extreme fear nor greed. Investors are cautious but not panicked.
🧠 Retail vs. Institutional Sentiment
👥 Retail Traders: Moderately bullish (55% Long, 45% Short)
🏦 Institutional Traders: Slightly cautious (50% Long, 50% Short)
🔑 Key Drivers: Mixed signals from manufacturing data and upcoming labor market reports.
📉📈 Fundamental & Macro Score
📊 Macro Score: 6/10
Manufacturing PMI (48.7) still in contraction but improving.
Labor market data (JOLTS) awaited for clarity.
⚡ Volatility Score: 5/10 (Moderate)
VIX near average levels, indicating stable expectations.
💧 Liquidity Score: 7/10
Strong volume and breadth in large-cap tech stocks.
🐂🐻 Overall Market Outlook
✅ Bullish (Long): 60%
Supported by strong yearly gains and resilience in big tech.
⚠️ Bearish (Short): 40%
Concerns over manufacturing contraction and inflation pressures.
💡 Key Takeaways
📈 US100 is trending mildly positive today (+0.57%).
😐 Sentiment is neutral—no extreme fear or greed.
📊 Macro data hints at cautious optimism but watch for upcoming labor reports.
🐂 Overall bias leans slightly bullish for long-term holders.
📊 Related Pairs to Watch
FOREXCOM:SPX500
TVC:DJI
TVC:VIX
NASDAQ:NDX
FX:USDOLLAR
✨ “If you find value in my analysis, a 👍 and 🚀 boost is much appreciated — it helps me share more setups with the community!”
#NASDAQ100 #US100 #NDX #SPX500 #DJI #TradingView #SwingTrade #ScalpTrading #LayeringStrategy #MarketAnalysis
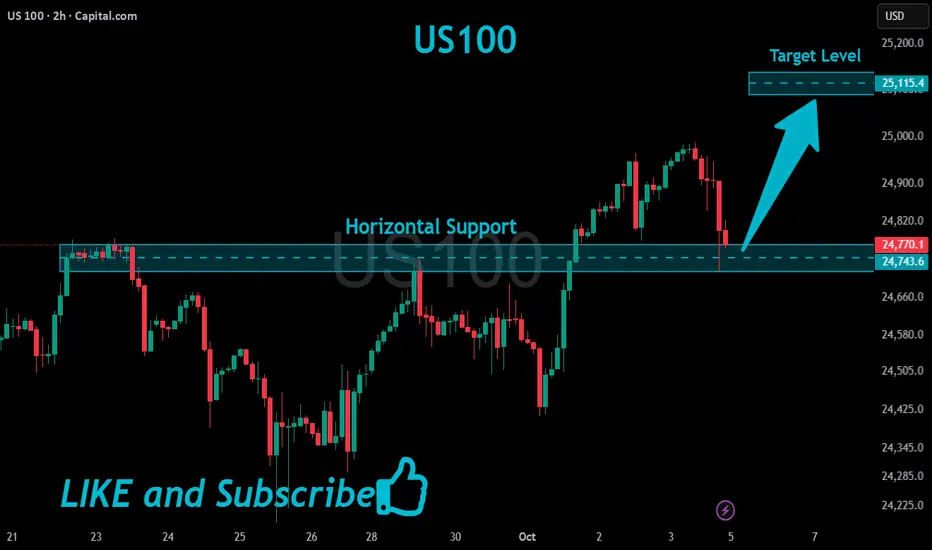
US100 Will Grow!
HI,Traders !
#US100 is trading in an
Uptrend and is
Going down to retest
The horizontal support
Around 24743.6 so after
The retest we will be
Expecting a further
Bullish move up !
Comment and subscribe to help us grow !
NASDAQ100 HIGH PROBABILITY SETUP SOON!!!🚨 NAS100 HIGH PROBABILITY BUY SETUP 🚨
* Here We Can See Clearly The Next Potential Moves For US100 Coming Hours/Days.
* Keep Your Eyes Close On Your Trading Positions.
* Happy PIP Hunting Traders.
FXKILLA.

NASDAQ100 HIGH PROBABILITY SETUP SOON!!!🚨 US100 HIGH PROBABILITY BUY SETUP 🚨
* Here We Can See Clearly The Next Potential Move For NAS100 Coming Hours/Days.
* Keep Your Eyes Close On Your Trading Positions.
* Happy PIP Hunting Traders.
£ FXKILLA £

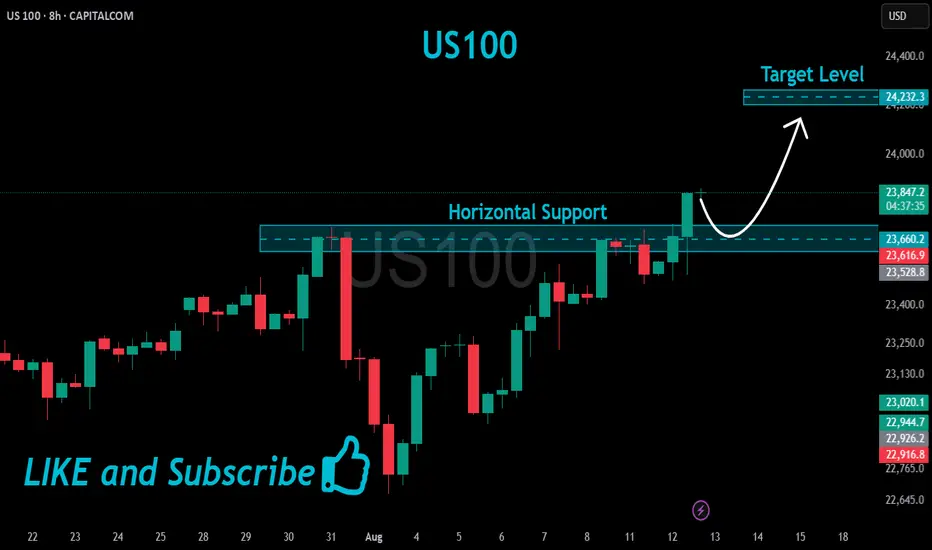
US100 Bullish Breakout!
HI,Traders !
#US100 is trading in a strong
Uptrend and the price made a
Bullish breakout of the key
Horizontal level of 23660.2
So we are bullish biased
And we will be expecting a
Further bullish move up !
Comment and subscribe to help us grow !
US100 Bullish Momentum Targets AheadThe US100 shows strong bullish structure after completing an ABCD correction, with price eyeing a potential move towards the 1st target at 23,791 and possibly the 2nd target at 24,053. A brief pullback may precede the continuation towards these key resistance levels.
1. Current Structure
The chart follows an ABCD pattern after a strong bullish impulse from the early August lows.
Points A–B–C–D suggest a completed correction phase, with momentum now shifting upward.
Price is currently around 23,629, approaching the first resistance zone.
2. Key Levels
Immediate Support: ~23,500 (recent swing low, short-term demand zone)
1st Target: 23,791 (minor resistance, potential profit-taking zone)
2nd Target: 24,053 (major resistance, psychological round area)
Major Support: 23,200 (break below here could invalidate bullish momentum)
3. Price Action Expectation
Short term:
A small pullback toward 23,500–23,550 is possible before continuing upward (healthy retracement to build buying pressure).

US100 Local Long!
HI,Traders !
#US100 made a retest
Of the horizontal support
Level of 23266.0 from where
We are already seeing a
Local bullish rebound so
We will be expecting a
Further bullish move up !
Comment and subscribe to help us grow !

Fibonacci Retrace Strategy NAS100 Trade Idea📈 NASDAQ 100 (NAS100) is holding a strong bullish trend 🚀. After a weekend gap-up 🕳️➡️📈, price retraced back into the gap zone—exactly what you'd expect in a healthy trending market.
🔍 I'm applying my Fibonacci Expansion + Retrace Strategy 🔢, watching closely for a pullback into equilibrium ⚖️ within the previous price swing. That’s where I’ll be waiting for a bullish market structure break 🔓📊 to confirm my long bias.
🧠 Patience is key here—let the setup come to you.
📌 As always, this is not financial advice!

US100 Bullish Breakout!
HI,Traders !
#US100 is trading in a strong
Uptrend and the price made a
Bullish breakout of the key
Horizontal level of 23261.4
So we are bullish biased
And we will be expecting a
Further bullish move up !
Comment and subscribe to help us grow !

US100 Strong Bullish Breakout!
HI,Traders !
#US100 is trading in a
Strong uptrend and the
made a bullish breakout
Of the key horizontal level
Of 22879.1 so we are
Bullish biased and we will
Be expecting a further
Bullish move up !
Comment and subscribe to help us grow !
