US 100NASDAQ - US 100
- Completed " 13245 " Impulsive Waves and " ABCD " Corrective Waves
- Break of Structure
- RSI - Divergence
- Symmetrical Triangle as an corrective pattern in Short Time Frame
- Order Block
Us100short

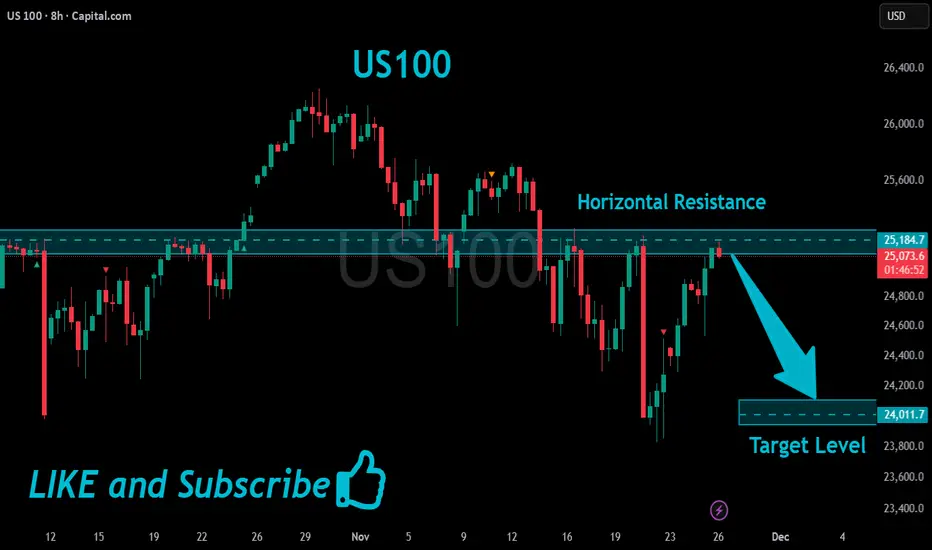
US100 Will Go Down!
HI,Traders !
#US100 already made a retest
Of the horizontal resistance
Of 25184.7 from where we
Are seeing a bearish reaction
And we will be expecting a
Further bearish move down !
Comment and subscribe to help us grow !
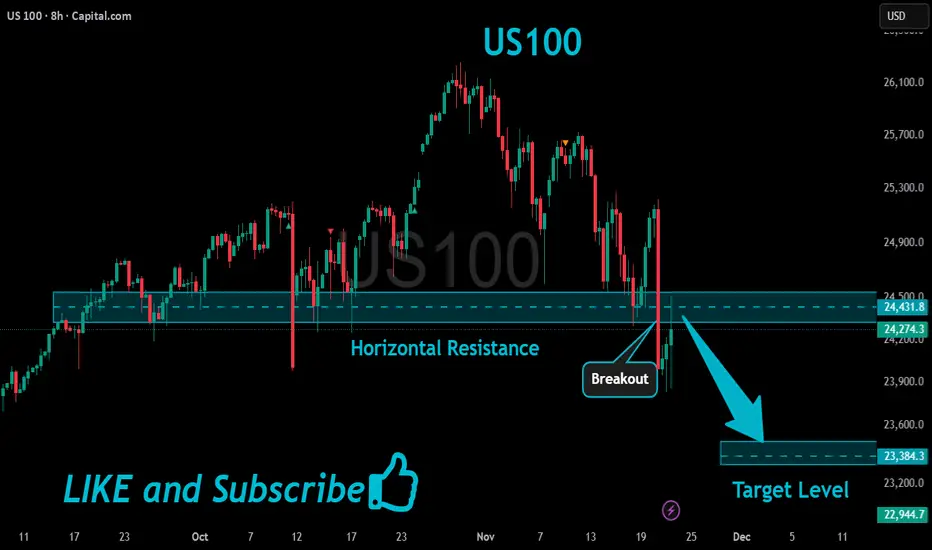
US100 Potential Short!
HI,Traders !
#US100 is making a rebound
But we are bearish biased
And after hits the
Horizontal resistance of 24431.8
We will be expecting a
Local bearish correction !
Comment and subscribe to help us grow !
US100 Resistance Ahead!
HI,Traders !
US100 is making a
Nice bullish correction
After a sharp local flash-crash
But a local horizontal resistance
Level is ahead at 25185.8
So after the retest we will
Be expecting a local
Bearish correction !
Comment and subscribe to help us grow !

US100 Will Hit Resistance Soon!
HI,Traders !
#US100 keeps growing
And the price will soon
Hit a horizontal resistance
Of 25817.8 from where
A local bearish correction
Is to be expected !
Comment and subscribe to help us grow !

NAS100US100 created a NH as price is changing direction creating a bearish peanant, price to retrace back to resistance before it dumps..Trade safe and be Blessed..

US100 Will Go Down!
HI,Traders !
#US100 has made a retest
Of the horizontal resistance
Of 25169.1 and we are already
Seeing a bearish reaction so
We are bearish biased and
Therefore a local bearish
Pullback is to be expected !
Comment and subscribe to help us grow !

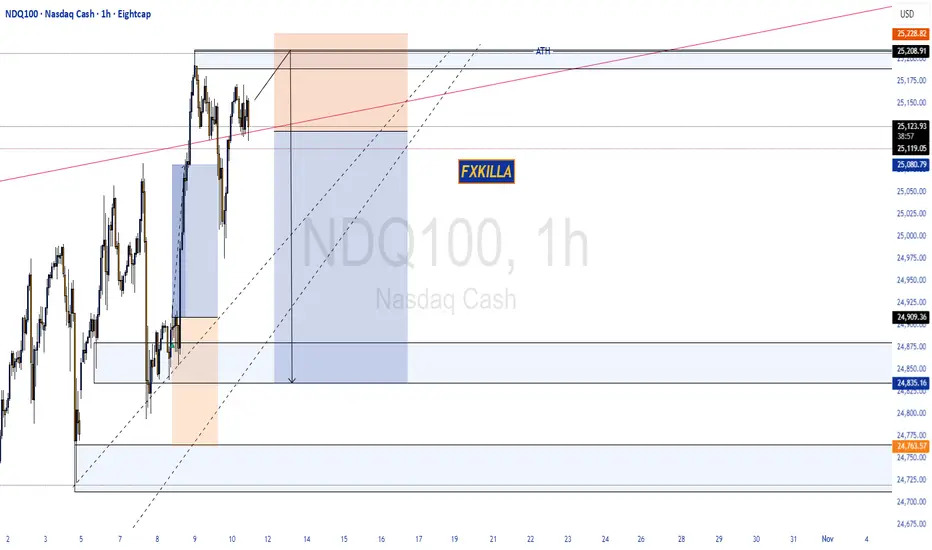
NASDAQ100. HIGH PROBABILITY SETUP SOON!!!🚨 NAS100 HIGH PROBABILITY SELL SETUP 🚨
* Here We Can See Clearly The Next Potential Moves For US100 Coming Hours/Days.
* Keep Your Eyes Close On Your Trading Positions.
* Happy PIP Hunting Traders.
FXKILLA.

US100 Bearish Bias!
HI,Traders !
#US100 keeps growing
But a horizontal resistance
Level of 25039.3 is nearby
So after the retest of the
Level we will be expecting
A local bearish correction
On Monday !
Comment and subscribe to help us grow !

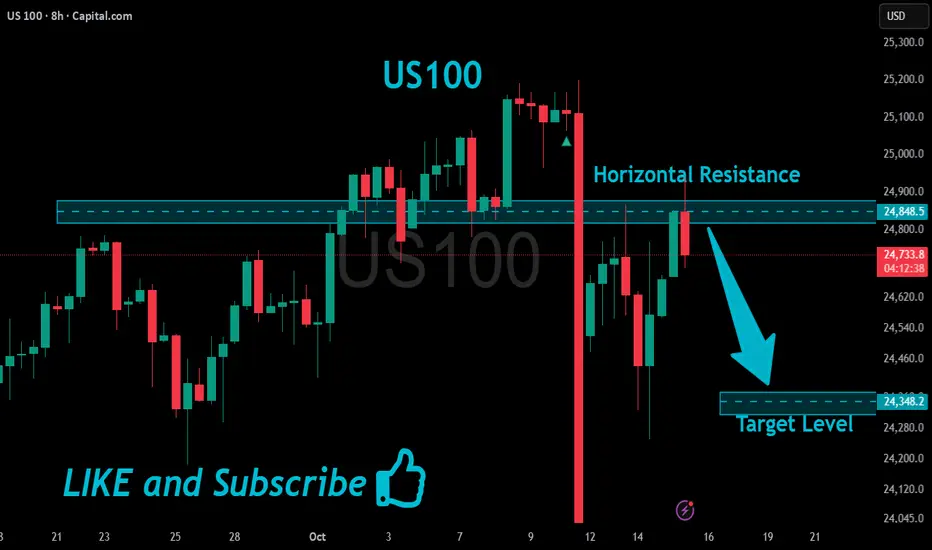
US100 Local Bearish Pullback Expected!
HI,Traders !
#US100 is hit A strong horizontal resistance
Level of 24848.5 after a sharp
Push upwards by the bulls
So a local correction is needed
From the resistance with the
Expected target being the
Local level below at 24348.2 !
Comment and subscribe to help us grow !
US100 Bearish Breakout!
HI,Traders !
#US100 made a bearish
Breakout of the key
Horizontal level of 24795.7
Which is now a resistance
And the breakout is confirmed
So after the potential pullback
And retest we will be expecting
A further bearish move down !
Comment and subscribe to help us grow !

NASDAQ100 HIGH PROBABILITY SETUP SOON!!!🚨 NAS100 HIGH PROBABILITY SELL SETUP 🚨
* Here We Can See Clearly The Next Potential Move For US100 Coming Hours/Days.
* Keep Your Eyes Close On Your Trading Positions.
* Happy PIP Hunting Traders.
FXKILLA.
NASDAQ100 HIGH PROBABILITY SETUP SOON!!!🚨 NAS100 HIGH PROBABILITY SELL SETUP 🚨
* Here We Can See Clearly The Next Potential Move For US100 Coming Hours/Days.
* Keep Your Eyes Close On Your Trading Positions.
* Happy PIP Hunting Traders.
FXKILLA.

NASDAQ100 HIGH PROBABILITY SETUP SOON!!!🚨 NAS100 HIGH PROBABILITY SELL SETUP 🚨
* Here We Can See Clearly The Next Potential Move For US100 Coming Hours/Days.
* Keep Your Eyes Close On Your Trading Positions.
* Happy PIP Hunting Traders.
FXKILLA.

NASDAQ After the Fireworks: Bearish Setup LoadedAfter the classic 4th of July rally, I stepped in on the short side of Nasdaq, targeting 22,000 and 21,400 zones. The market structure shows exhaustion, and with the cloud retest failing to hold new highs, I positioned accordingly.
Technical:
• Price stalled at prior expansion highs with tight compression near 23,000.
• Daily FibCloud offered resistance confirmation.
• Bearish risk-reward skew forms after extended rally and thin retraces.
• Volume divergence spotted.
Fundamentals:
Multiple overlapping uncertainties:
• Trump confirmed tariffs will take effect on August 1, threatening a 10% surcharge on BRICS-aligned nations.
• Treasury Secretary Bessent anticipates several trade deal announcements within 48h—but stresses quality over quantity.
• Bank of America maintains its base case of 0 rate cuts in 2025, citing strong economic data and sticky inflation risks.
The combination of tariff escalation, hawkish monetary expectations, and global trade friction creates a perfect backdrop for volatility and correction—especially in overextended tech indices like the Nasdaq.
Note: Please remember to adjust this trade idea according to your individual trading conditions, including position size, broker-specific price variations, and any relevant external factors. Every trader’s situation is unique, so it’s crucial to tailor your approach to your own risk tolerance and market environment.

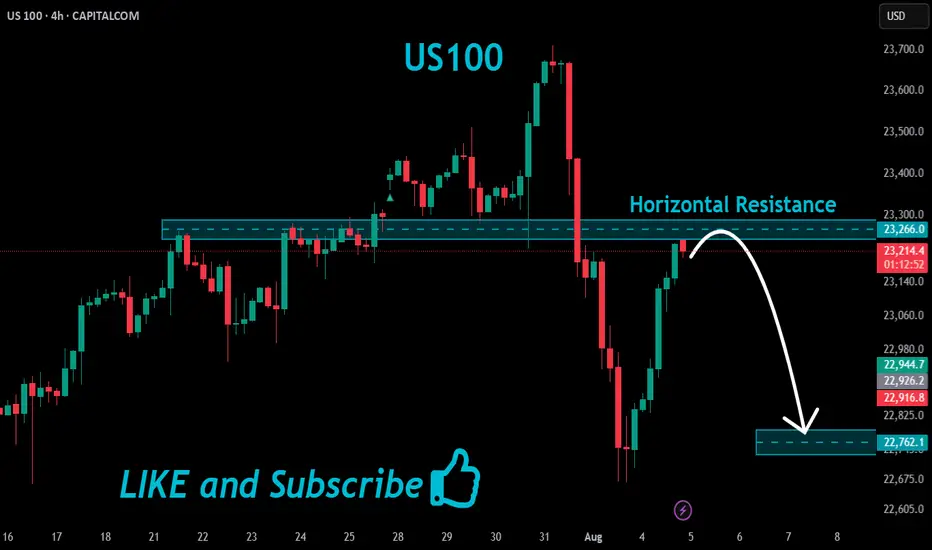
US100 Local Short!
HI,Traders !
#US100 made a retest
Of the horizontal resistance
Of 23266.0 and we are already
Seeing a bearish reaction and
We will be expecting a further
Bearish move down !
Comment and subscribe to help us grow !
US100 Resistance Cluster Above!
HI,Traders !
#US100 made a bearish
Breakout of the support
Cluster of the rising and
Horizontal support levels
Which is now a resistance
Cluster round 22703.9 then
Went down and made a local
Pullback on Monday but we are bearish
Biased mid-term so we
Will be expecting a further
Bearish move down this week !
Comment and subscribe to help us grow !

US100 Will Go Down!
HI,Traders !
#US100 made a retest
Of the wide horizontal
Resistance around 22688.6
And we are already seeing a
Local bearish reaction so
We will be expecting a
Further bearish move down !
Comment and subscribe to help us grow !


US1OO SHORT TRADE IDEA Chart Breakdown:
1. Trendline Break:
A clear uptrend was in place, supported by the ascending blue trendline.
The price broke below this trendline, suggesting a potential reversal or correction.
After the break, price attempted to retest the trendline (a common behavior before continuation in the new direction).
2. Bearish Rejection:
Price got rejected around the trendline retest zone, which aligns with a resistance area marked in red.
This confluence zone suggests supply dominance, pushing the price lower.
3. Imbalance Zone (Fair Value Gap):
A pink rectangular zone marks an imbalance, often called a fair value gap (FVG)—where price moved too quickly, leaving inefficient trading volume.
These zones are typically revisited to "fill the imbalance."
4. Heikin Ashi Candles:
Recent candles show strong bearish momentum with little to no upper wicks, confirming a downward trend.
Multiple consecutive red candles support trend continuation.
📉 Bearish Setup Analysis:
Entry Zone: Around the trendline retest, near 21,000–21,100.
Target Zone: Imbalance/fair value gap around 20,100–20,200.
Stop-Loss Zone: Above the resistance area, around 21,150–21,200.
Risk-Reward Ratio: Favorable (visualized with the green zone risk and extended red arrow for reward).
✅ Bearish Case Justification:
Trendline break and retest failure.
Rejection at key resistance/supply.
Imbalance acting as a price magnet.
Momentum strongly favors bears (based on Heikin Ashi structure).
⚠️ Risk Factors / Invalidations:
If price reclaims and holds above the trendline or breaks above 21,200, the bearish setup could be invalidated.
Major macro news or earnings could reverse the move rapidly.
Watch for divergences or weakening bearish momentum on smaller timeframes as price approaches the target zone.
🧭 Strategy Tip:
This could suit a swing short setup, especially for traders looking to capitalize on trendline break retests and imbalance fills. A tighter entry around the top of the rejection zone provides a better risk/reward.

US100 Local Short!
HI,Traders !
US100 keeps growing
But the will soon
Retest a horizontal
Resistance level of 21668.9
From where a local bearish
Correction is likely to follow !
Comment and subscribe to help us grow !

US100US-100 - NASDAQ Index
Rising Wedge as an Corrective Pattern in Short Time Frame
Break of Structure
Order Block
Completed " 12345 " Impulsive Waves
Resistance Level

US100 IdeaNasdaq has formed a valid ascending trendline with multiple touches and broke it
retested and get rejected so now we can enter a short (sell) trade with a stop loss above the highest number it reached
Follow us or more ideas and analysis
