NAS100 Weekly Outlook: Watch This Liquidity Sweep Before SellingNAS100 🌍
The macro narrative heading into this week is dominated by a sudden reassessment of the AI investment cycle following a string of high-stakes earnings reports 🏦. While Big Tech giants like Meta and Microsoft have delivered "on-paper" beats, the underlying sentiment is shifting toward exhaustion as investors start demanding immediate monetization from massive AI capital expenditures. Interestingly, general online sentiment is showing a "buy-the-dip" mentality reaching near-extreme levels, suggesting a potential liquidity hunt before the real move lower can materialize. This retail eagerness to catch the falling knife often provides the perfect fuel for a deeper sweep of the lows 🧹.
We are seeing a Bearish Market Structure on the H4 after a significant rejection at the 26,000 psychological level 📉. While the long-term trend remains structurally bullish, the prevailing community chatter is heavily leaning toward a bounce, which tells me retail is likely positioned poorly and trapped in early long positions. The recent break of the 25,200 support zone has shifted the immediate momentum to the downside, and I am watching for the market to exploit this "crowded long" positioning before settling into a more sustainable range.
Key Zone: The confluence of the bearish Parallel Channel and the Fibonacci 50% retracement level (near 25,293) is the primary area of interest 📉.
We are currently trading just below the mid-point of the recent sell-off, and the price action is carving out a corrective flag within a descending channel. I am watching for a 'run on liquidity' to sweep the late buyers I'm seeing across various social forums who are aggressively longing this minor pullback 🧹. If we see a failure to reclaim the 50% Fibonacci level accompanied by a bearish "Break of Structure" (BoS) on the lower timeframes, it will confirm that the sellers are still firmly in control of the weekly range.
Us100signal

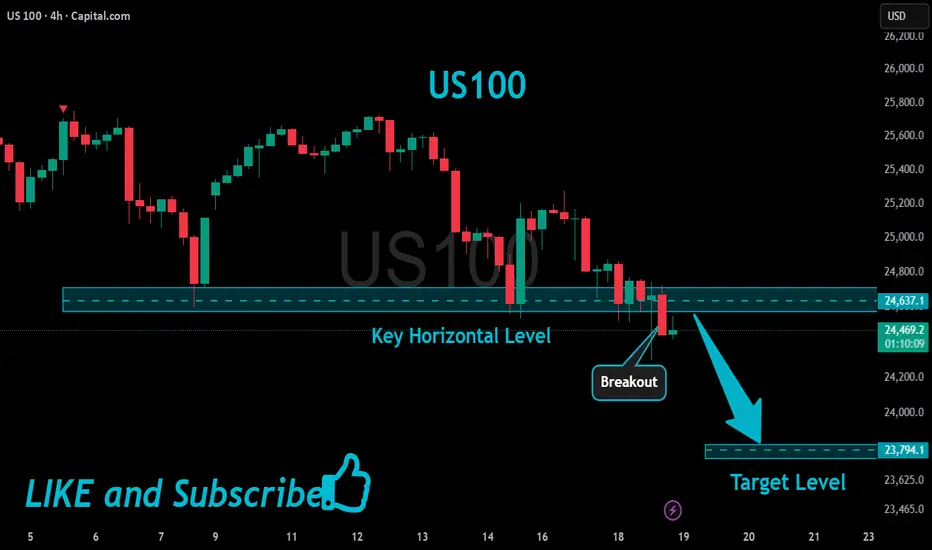
US100 Bearish Breakout!
HI,Traders !
#US100 made a bearish
Breakout of the key horizontal
Level around 25725.0 and the
Breakout is confirmed so we
Will be expecting a further
Bearish move down !
Comment and subscribe to help us grow !

US100 Risky Short!
HI,Traders !
#US100 made a nice bullish
Move up and has almost reached
A horizontal resistance level
Of 25725.0 and is locally
Overbought so after the retest
A local bearish correction
Is to be expected !
Comment and subscribe to help us grow !

US100 Short From Resistance!
HI,Traders !
#US100 made a retest
Of the horizontal resistance
Of 25725.0 from where we
Are already seeing a local
Bearish reaction so a further
Move down is to be expected !
Comment and subscribe to help us grow !

NASDAQ NAS100 Technical Analysis and Trade IdeaMy bias remains bullish on the NAS100 🐂, but patience is the name of the game today. Fundamentally, the index is struggling for oxygen as the market digests the "no rate cut" reality for January, causing a temporary decoupling from the broader risk-on flows 📉. Technically, we are trapped in a corrective flag, and the rejection at 25,600 confirms that the bears are still defending the highs.
If the setup triggers, aim for a 5R return to start 🎯. If the price action reclaims 25k within our optimal entry zone. Look to close partial profits (50%) at 25,400 (1R) 💰, then let the rest run and use a trailing SL. Patience pays on this one, let the setup come to us. ⏳ This trade is invalidated if we lose the 24,550 structural pivot 🛑.

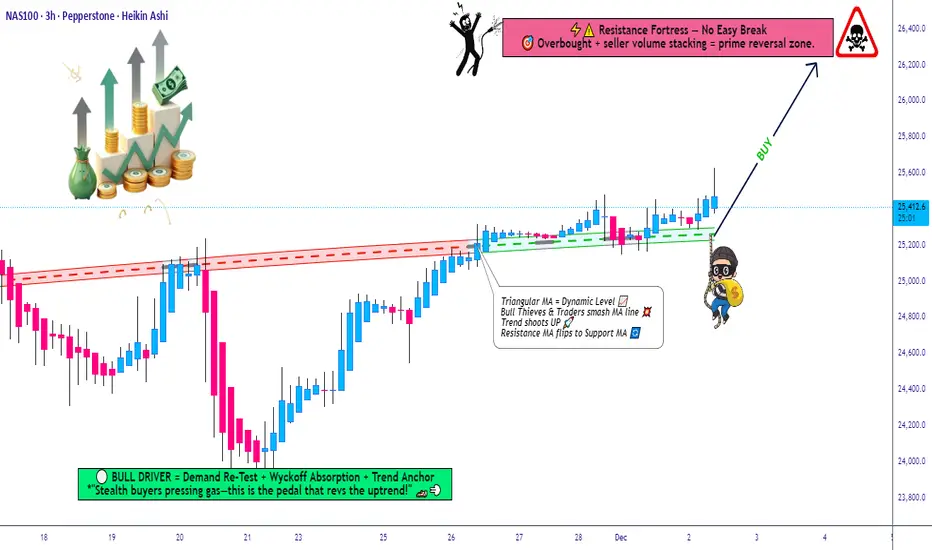
NASDAQ100 Breakout Watch — Is a New Upside Leg Starting Now?📈 NASDAQ100 Swing Trade Opportunity — Bullish Breakout Play
🟩 Asset: NASDAQ100 (Index CFD)
⚡ Trade Type: Swing Trade — Bullish Plan Confirmed
🧭 Trade Thesis
The index has confirmed a bullish setup following a Triangle + Moving Average breakout, strengthening upward momentum and favoring dip-buying behavior.
To reflect the Thief layering method, this plan uses multiple staggered limit orders to accumulate positions efficiently across volatility pockets.
📌 Entry Plan (Thief Layering Method)
💰 Entry Style: “Any price level allowed — Thief uses layers”
Buy Limit Layers:
24,900
25,000
25,100
25,200
(Feel free to increase or customize layers to fit your personal risk and liquidity preference.)
🛑 Stop-Loss (SL)
🔻 Thief SL: 24,500
Dear Ladies & Gentlemen (Thief OG’s), adjust SL based on your personal risk and strategy.
This is not a fixed recommendation, only a reference zone.
🎯 Target (TP)
⚡ The High-Voltage Electric Gate Zone around 26,200 acts as major resistance because of:
Overbought readings
High-liquidity trap behavior
Historical reversal probability
Exit with profits before heavy sellers activate.
Again — you decide your own TP based on your risk tolerance, not mine.
📊 Market Logic Behind the Move
Breakout structure confirmed
Trend continuation supported by triangle compression
Index ETF flows show short-covering + rotation back into tech
Momentum accelerates above 25,200 zones
Cleaner upside path until liquidity wall at 26,200
🔎 Related Pairs to Watch (Correlation Insight)
1️⃣ NASDAQ:NDX / NASDAQ:QQQ
Direct ETF mirror of NASDAQ100
Useful for checking volume, market depth, and real-time breakout confirmation
2️⃣ SP:SPX / NYSE:ES (S&P 500)
High correlation (approx. 0.85+)
A strong SPX supports tech continuation; weakness warns of index-wide pullback
3️⃣ TVC:VIX (Volatility Index)
Inverse correlation
If VIX stays below key volatility thresholds, bullish NASDAQ continuation is more reliable
4️⃣ FX:USDOLLAR / DXY
Tech usually performs better when the Dollar weakens
A rising Dollar can slow or cap NASDAQ bullish momentum
5️⃣ TVC:US10Y / Yields
NASDAQ moves inversely with yields
If yields drop, NASDAQ accelerates
If yields spike, prepare for turbulence or failed breakouts
📘 Summary
Bullish plan confirmed via Triangle + MA Breakout
Thief layering entries positioned smartly into volatility
SL/TP guidance flexible for trader customization
Strong correlation checks available across SP:SPX , TVC:VIX , TVC:DXY & yields

US 100NASDAQ - US 100
- Completed " 13245 " Impulsive Waves and " ABCD " Corrective Waves
- Break of Structure
- RSI - Divergence
- Symmetrical Triangle as an corrective pattern in Short Time Frame
- Order Block

NASDAQ100 Market Structure & Pullback Strategy📈 NAS100 / US100 — NASDAQ100
Index Market Trade Opportunity Guide (Day / Swing Trade)
🔵 Market Bias
Bullish Plan Active 🟢
Momentum structure remains positive with buyers defending higher demand zones on pullbacks.
🎯 Entry Strategy (Pullback-Based Execution)
Pullback-1: Buy above 25200 🔁
Pullback-2: Buy above 24900 🔁
📌 This plan focuses on buying controlled retracements within a bullish structure rather than chasing highs.
🛑 Risk Management (Stop Loss)
SL for Pullback-1: 25000
SL for Pullback-2: 24700
⚠️ Risk Disclaimer:
Dear Ladies & Gentlemen (Thief OG’s), adjust your Stop Loss based on your own strategy and risk tolerance.
I am not recommending using only my SL — risk management is fully your responsibility.
🏁 Take Profit / Exit Zone
Target: 26000 🎯
🚨 Police Force zone ahead:
Strong resistance + overbought conditions + potential bull trap + corrective risk detected.
➡️ Kindly escape with profits once price reacts in this zone.
⚠️ TP Disclaimer:
Dear Ladies & Gentlemen (Thief OG’s), I am not recommending using only my TP. Protect profits based on your own execution rules.
👀 Related Pairs & Assets to Watch ($ Correlation)
CAPITALCOM:US30 (Dow Jones) 🏭
Confirms broader US equity strength; divergence may warn of NAS100 slowdown.
FOREXCOM:SPX500 (S&P 500) 📊
Healthy correlation — continuation supports bullish NAS100 bias.
TVC:DXY (US Dollar Index) 💵
Sharp USD strength can pressure tech valuations.
TVC:US10Y / US Treasury Yields 📉
Rising yields = headwind for growth & tech stocks.
🧠 Fundamental & Economic Factors to Consider
🔹 Federal Reserve Outlook:
Rate-cut expectations or dovish commentary tend to support NASDAQ upside.
Hawkish tone or delayed cuts may trigger volatility or pullbacks.
🔹 Inflation Data (CPI / PCE):
Cooling inflation = bullish for growth stocks
Sticky inflation = risk of corrective moves
🔹 US Labor Market (NFP / Jobless Claims):
Weakening data supports rate-cut narrative → bullish NAS100
Overheating labor data may pressure equities
🔹 Big Tech Earnings & Guidance:
NAS100 is highly sensitive to mega-cap tech outlooks (AI, cloud, semiconductors).
Positive guidance fuels continuation; cautious outlooks invite corrections.
🔹 Upcoming High-Impact Events:
FOMC statements
US CPI / PCE releases
Major US tech earnings weeks
📌 Always reduce risk or lock profits ahead of high-impact economic releases.
🧩 Final Trading Insight
📈 Trend favors buy-the-dip, not emotional breakouts.
🎯 Respect resistance zones, secure profits early, and let structure — not emotions — guide execution.
👍 If this setup adds value, support with a LIKE, BOOST, or FOLLOW for more professional index trade plans.
Trade smart. Protect capital. Let the market pay you. 💼📊

NASDAQ100 Technical Roadmap for Swing Traders📈 NASDAQ100 Bullish Swing Setup — Pullback to Power Move?
Asset:
NAS100 / US100 — NASDAQ 100 Index 💻📊
Market Type: Index
Trade Style: Swing Trade
📌 Market Plan (Bias):
🟢 Bullish structure confirmed
Price is respecting the Triangular Moving Average (TMA) pullback, signaling continuation strength within the broader uptrend.
🎯 Entry Strategy:
✅ Any Price Level Entry (Layered Approach Allowed)
Layering / Scaling-In Method:
This plan uses a multiple limit order (layering) strategy to optimize average entry during pullbacks.
Buy Limit Layers:
24900
25000
25100
📌 (You may increase or adjust layers based on your own risk and capital allocation)
🛑 Stop Loss (Risk Control):
🔴 Thief SL: 24700
📢 Adjust your stop loss according to your personal risk management and strategy.
This level invalidates the bullish pullback structure if broken.
🎯 Target / Exit Plan:
🟠 Primary Target: 25800
📌 Rationale:
Strong resistance zone
Overbought conditions may appear
Trap potential near highs
Possible corrective move from resistance
💡 Action: Secure profits near resistance — don’t overstay.
⚠️ Risk Disclaimer:
📢 Stop loss and target levels are for educational purposes only.
📢 Always manage risk independently and trade responsibly.
🔗 Related Markets to Watch (Correlation & Confirmation):
📊 US Indices (Direct Correlation):
US30 (Dow Jones) 🏭
→ Strength confirms broad US equity participation
SPX500 (S&P 500) 📈
→ Institutional flow confirmation for NASDAQ strength
💵 USD Index & Rates (Inverse / Indirect Impact):
DXY (US Dollar Index) 💲
→ Strong USD can slow tech upside; weakness supports NAS100
US10Y Treasury Yield 📉
→ Falling yields = bullish for growth & tech stocks
🧠 Risk Sentiment Assets:
BTC/USD ₿
→ Risk-on flows often align with NASDAQ momentum
VIX (Volatility Index) ⚡
→ Rising VIX = caution; falling VIX = trend continuation
💬 Final Note:
📈 Follow structure, respect risk, scale wisely.
🧠 Let price confirm — don’t chase.
👍 If this plan helps your analysis, boost with a like and share your view.

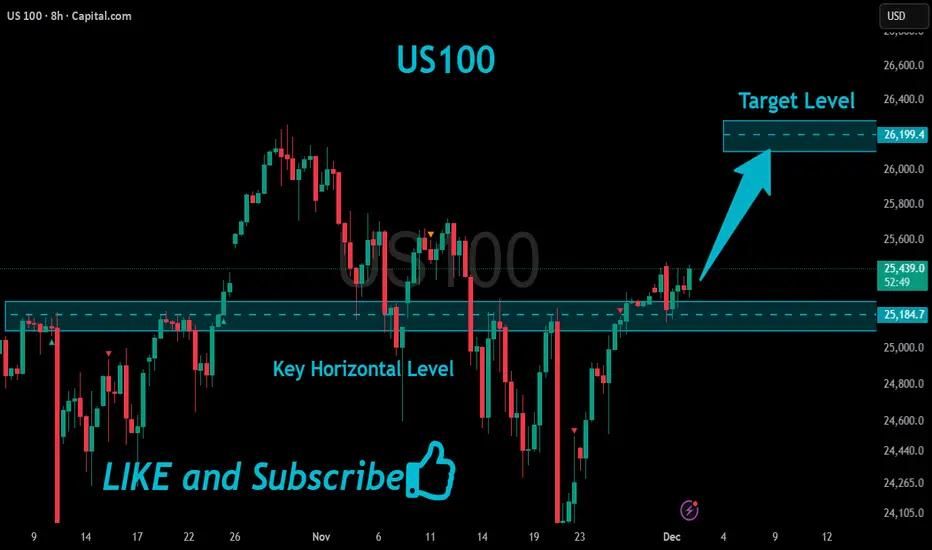
US100 Bullish Breakout!
HI,Traders !
#US100 is going up now
And made a bullish
Breakout of the key horizontal
Level of 25184.7 and the breakout
Is confirmed so we are bullish
Biased and we will be
Expecting a further
Bullish move up !
Comment and subscribe to help us grow !
NASDAQ NAS100 Analysis and My Trade Plan📊 Currently analysing NAS100 (NASDAQ), we can see that price has broken structure to the upside, confirming bullish intent. Right now, NAS100 is retesting the value area and the Point of Control (POC) on the volume profile — a critical zone to watch 👀📈
⚠️ Price action is a bit precarious. After a strong impulsive move, we’ve now seen a deep and aggressive retracement, which opens the door for potential bearish movement this week.
📆 However, my higher-timeframe bias remains bullish, with the weekly chart still supporting upward continuation.
📌 My plan:
If price holds above the current POC, then breaks and retests cleanly, I’ll be looking for long opportunities. If it breaks below the POC, I will step aside and abandon the long bias 🚫
This is not financial advice — just my personal market outlook. 💬📉📈


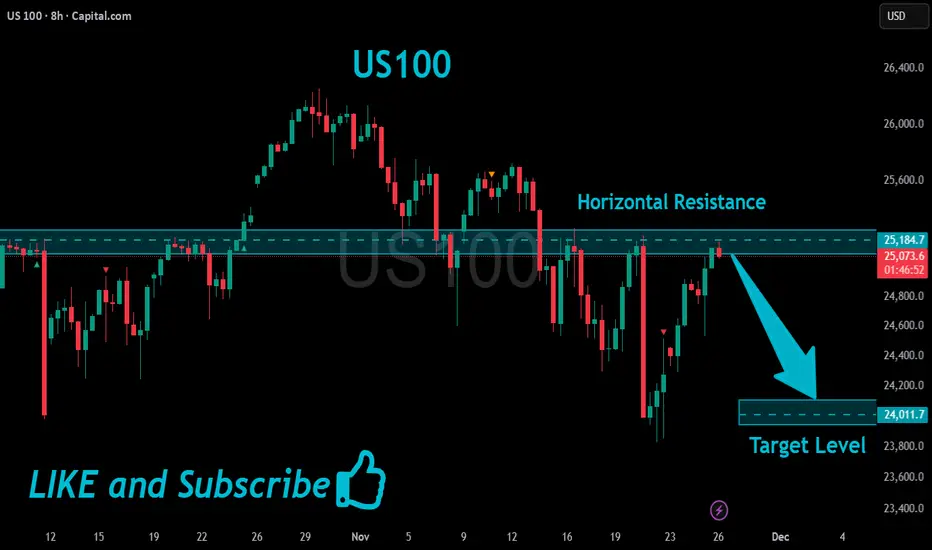
US100 Will Go Down!
HI,Traders !
#US100 already made a retest
Of the horizontal resistance
Of 25184.7 from where we
Are seeing a bearish reaction
And we will be expecting a
Further bearish move down !
Comment and subscribe to help us grow !
US100 Reversal Map – Hull MA + Heikin Ashi Confirmation🧠 US100 / NASDAQ100 Profit Pathway Setup — The Thief’s Bullish Escape Plan! 💰🚀
📊 Market Bias: Bullish (Day Trade Setup)
The Thief Trader has spotted a golden pathway in the NASDAQ100 (US100)!
Here’s the breakdown of the plan — straight from the thief’s vault 🕵️♂️📈
🎯 Plan Overview
Bias: Bullish continuation confirmed
Technical Confirmation:
✅ Double Pullback on Hull Moving Average
✅ Retest Zone successfully defended
✅ Heikin Ashi Bullish Doji signaled a trend reversal confirmation
💡 Momentum is shifting upward — the trend has officially changed!
💎 Entry Strategy (Layered Thief Style)
The Thief Strategy applies a layered entry method — multiple buy limits to average into strength.
📥 Buy Limit Layers:
25,300
25,400
25,500
25,600
(Traders can adjust or add more layers based on risk appetite and confirmation zones.)
🛡️ Stop-Loss Setup
This is the Thief SL @ 25,100
⚠️ Note to Thief OG’s:
I’m not recommending my SL as your SL — always customize risk and secure your own bag. Manage your position with discipline and independence! 💼
🎯 Take-Profit Zone
Target: 26,200
🚨 The Police Barricade Zone acts as a strong resistance — overbought levels spotted and potential bull trap alert!
Kindly exit with profit before the officers arrive. 😎
⚠️ Note: Profit-taking is at your discretion. Book and Run!
📈 Related Pairs to Watch (Correlation Insight)
NASDAQ:NDX / CAPITALCOM:US100 / NASDAQ:QQQ : All mirror NASDAQ movement.
SP:SPX / AMEX:SPY : Often correlate with NASDAQ’s momentum (watch divergence for clues).
TVC:VIX : If volatility spikes, expect pullbacks on tech-heavy indices.
TVC:DXY : A weak dollar often fuels US100 bullish legs — keep an eye on it.
NASDAQ:AAPL / NASDAQ:MSFT / NASDAQ:NVDA : Leading drivers of NASDAQ — if they pump, the index follows. 💪
🧩 Key Insights
Hull MA alignment confirms momentum shift.
Retest + bullish Heikin Ashi Doji = market reversal confirmation.
Layered entries give flexibility in volatile intraday conditions.
Dynamic risk management is key — never marry a position.
✨ “If you find value in my analysis, a 👍 and 🚀 boost is much appreciated — it helps me share more setups with the community!”
#US100 #NASDAQ100 #ThiefTrader #DayTrading #IndexTrading #HullMA #HeikinAshi #LayeredEntries #TechnicalAnalysis #TradingSetup #PriceAction #MarketReversal #TradingCommunity #BullishPlan #SmartMoneyFlow #TradeIdeas #ThiefStrategy

US100 Potential Short!
HI,Traders !
#US100 is making a rebound
But we are bearish biased
And after hits the
Horizontal resistance of 24431.8
We will be expecting a
Local bearish correction !
Comment and subscribe to help us grow !
NASDAQ Signal : US 100 H1 / H4 : long !!!Hello Traders! 👋
What are your thoughts on NASDAQ ?
This correction could offer a buy-the-dip opportunity, with potential for a move back toward the recent highs.
NASDAQ ( US100 ) :
Market price : 24400
Buy limit 1 : 24200
buy limit 2 : 24000
Tp1 : 24600
Tp2 : 25000
Tp 3: 25700
Tp 4 : 26300
SL : 23700
Traders, Don’t forget to like and share your thoughts in the comments! ❤️
Remember this is a position that was found by me and it is a personal idea not a financial advice, you are responsible for your loss and gain.

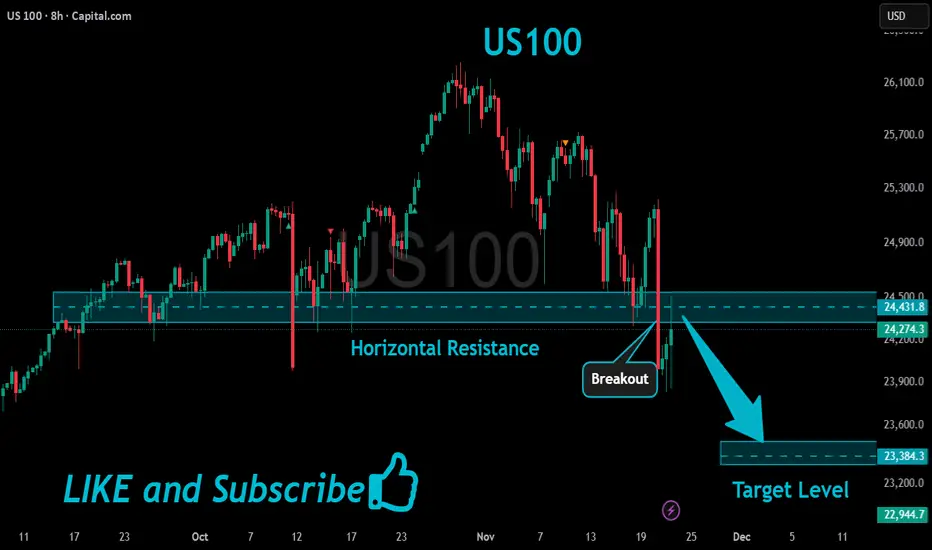
US100 Will Keep Falling!
HI,Traders !
#US100 keeps falling down
And made a strong
Bearish breakout of the key
Horizontal key level of 24637.1
And the breakout is confirmed
So we are bearish biased and
We will be expecting a further
Bearish move down !
Comment and subscribe to help us grow !
US100 Resistance Cluster!
HI,Traders !
#US100 made a bullish
Rebound But has now Near hit a resistance
Cluster of the horizontal and
Falling resistance lines
Around 25395.4 area From where we will be
Expecting a bearish move down !
Comment and subscribe to help us grow !

NASDAQ100 WATCH FOR HIGH PROBABILITY BUY SETUP SOON!!!🚨 NAS100 HIGH PROBABILITY BUY SETUP 🚨
* Here We Can See Clearly The Next Potential Moves For US100 Coming Hours/Days.
* Keep Your Eyes Close On Your Trading Positions.
* Happy PIP Hunting Traders.
FXKILLA.

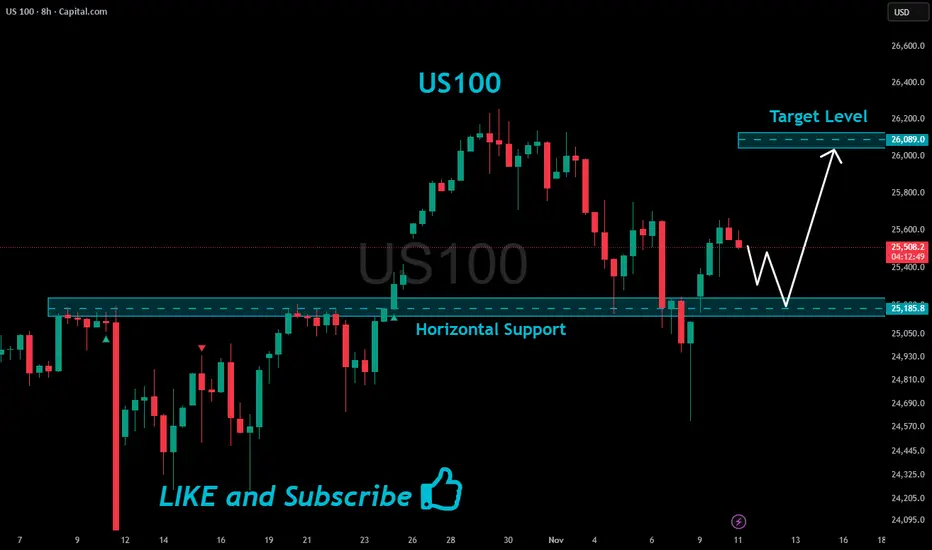
US100 Support Ahead!
HI,Traders !
#US100 is making a local
Bearish correction but
We are bullish biased mid-term
So after the pair hits the horizontal
Support of 25185.8 we will be
Expecting a local bullish rebound !
Comment and subscribe to help us grow !
US100 Resistance Ahead!
HI,Traders !
US100 is making a
Nice bullish correction
After a sharp local flash-crash
But a local horizontal resistance
Level is ahead at 25185.8
So after the retest we will
Be expecting a local
Bearish correction !
Comment and subscribe to help us grow !

US100 Will Hit Resistance Soon!
HI,Traders !
#US100 keeps growing
And the price will soon
Hit a horizontal resistance
Of 25817.8 from where
A local bearish correction
Is to be expected !
Comment and subscribe to help us grow !
