NASDAQ100 Technical Roadmap for Swing Traders📈 NASDAQ100 Bullish Swing Setup — Pullback to Power Move?
Asset:
NAS100 / US100 — NASDAQ 100 Index 💻📊
Market Type: Index
Trade Style: Swing Trade
📌 Market Plan (Bias):
🟢 Bullish structure confirmed
Price is respecting the Triangular Moving Average (TMA) pullback, signaling continuation strength within the broader uptrend.
🎯 Entry Strategy:
✅ Any Price Level Entry (Layered Approach Allowed)
Layering / Scaling-In Method:
This plan uses a multiple limit order (layering) strategy to optimize average entry during pullbacks.
Buy Limit Layers:
24900
25000
25100
📌 (You may increase or adjust layers based on your own risk and capital allocation)
🛑 Stop Loss (Risk Control):
🔴 Thief SL: 24700
📢 Adjust your stop loss according to your personal risk management and strategy.
This level invalidates the bullish pullback structure if broken.
🎯 Target / Exit Plan:
🟠 Primary Target: 25800
📌 Rationale:
Strong resistance zone
Overbought conditions may appear
Trap potential near highs
Possible corrective move from resistance
💡 Action: Secure profits near resistance — don’t overstay.
⚠️ Risk Disclaimer:
📢 Stop loss and target levels are for educational purposes only.
📢 Always manage risk independently and trade responsibly.
🔗 Related Markets to Watch (Correlation & Confirmation):
📊 US Indices (Direct Correlation):
US30 (Dow Jones) 🏭
→ Strength confirms broad US equity participation
SPX500 (S&P 500) 📈
→ Institutional flow confirmation for NASDAQ strength
💵 USD Index & Rates (Inverse / Indirect Impact):
DXY (US Dollar Index) 💲
→ Strong USD can slow tech upside; weakness supports NAS100
US10Y Treasury Yield 📉
→ Falling yields = bullish for growth & tech stocks
🧠 Risk Sentiment Assets:
BTC/USD ₿
→ Risk-on flows often align with NASDAQ momentum
VIX (Volatility Index) ⚡
→ Rising VIX = caution; falling VIX = trend continuation
💬 Final Note:
📈 Follow structure, respect risk, scale wisely.
🧠 Let price confirm — don’t chase.
👍 If this plan helps your analysis, boost with a like and share your view.
Us100trade

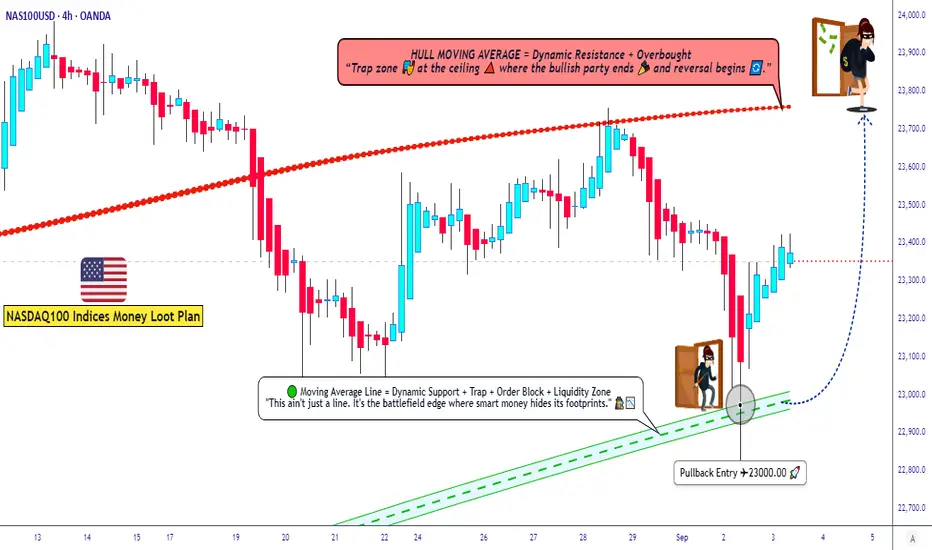
US100 Trading Plan ¦ Layering Strategy + Macro Sentiment Drivers🚀 NASDAQ100 / US100 Index – Thief Money Heist Plan 🎭
📌 Plan: Bullish Swing / Scalping Setup
Dear Ladies & Gentlemen (Thief OG’s), here’s the heist-style breakdown for US100 🔑:
🏴☠️ Entry Style (Thief Layering Strategy)
Using layered limit orders for flexibility & precision:
• 23200.0
• 23250.0
• 23300.0
• 23350.0
(You may increase limit layers based on your strategy & risk appetite)
📉 Moving Average Pullback Entry Plan
• Buy entries on pullbacks to the Fibo level 382 Triangular Moving average zone.
• Look for bullish candles confirming the bounce from these MAs.
• This offers better risk-to-reward by catching momentum on retracements instead of chasing highs.
❓ Why This Works?
• Moving averages often act as dynamic support/resistance in trending markets.
• Institutional traders & algos track them heavily, making them high-probability zones.
• Combining with layering entries = higher flexibility + reduced risk of mistimed single entry.
🛡️ Stop Loss (Protect the Vault)
• Thief SL: @23000.0
• Reminder: Adjust your SL based on your own strategy & risk tolerance.
🎯 Target (Escape Zone)
• Overbought + Trap Zone ahead!
• Escape target: @23750.0
• Note: Don’t rely only on my TP — secure profits at your own pace and risk.
📊 US100 Index CFD Real-Time Data Sep 03
📈 Daily Change: +133.47 (+0.57%)
📅 Monthly Performance: +0.76%
📆 Yearly Performance: +23.48%
😰😊 Fear & Greed Index
📊 Current Reading: 53/100 (Neutral)
🧐 Interpretation: Market sentiment is balanced, showing neither extreme fear nor greed. Investors are cautious but not panicked.
🧠 Retail vs. Institutional Sentiment
👥 Retail Traders: Moderately bullish (55% Long, 45% Short)
🏦 Institutional Traders: Slightly cautious (50% Long, 50% Short)
🔑 Key Drivers: Mixed signals from manufacturing data and upcoming labor market reports.
📉📈 Fundamental & Macro Score
📊 Macro Score: 6/10
Manufacturing PMI (48.7) still in contraction but improving.
Labor market data (JOLTS) awaited for clarity.
⚡ Volatility Score: 5/10 (Moderate)
VIX near average levels, indicating stable expectations.
💧 Liquidity Score: 7/10
Strong volume and breadth in large-cap tech stocks.
🐂🐻 Overall Market Outlook
✅ Bullish (Long): 60%
Supported by strong yearly gains and resilience in big tech.
⚠️ Bearish (Short): 40%
Concerns over manufacturing contraction and inflation pressures.
💡 Key Takeaways
📈 US100 is trending mildly positive today (+0.57%).
😐 Sentiment is neutral—no extreme fear or greed.
📊 Macro data hints at cautious optimism but watch for upcoming labor reports.
🐂 Overall bias leans slightly bullish for long-term holders.
📊 Related Pairs to Watch
FOREXCOM:SPX500
TVC:DJI
TVC:VIX
NASDAQ:NDX
FX:USDOLLAR
✨ “If you find value in my analysis, a 👍 and 🚀 boost is much appreciated — it helps me share more setups with the community!”
#NASDAQ100 #US100 #NDX #SPX500 #DJI #TradingView #SwingTrade #ScalpTrading #LayeringStrategy #MarketAnalysis
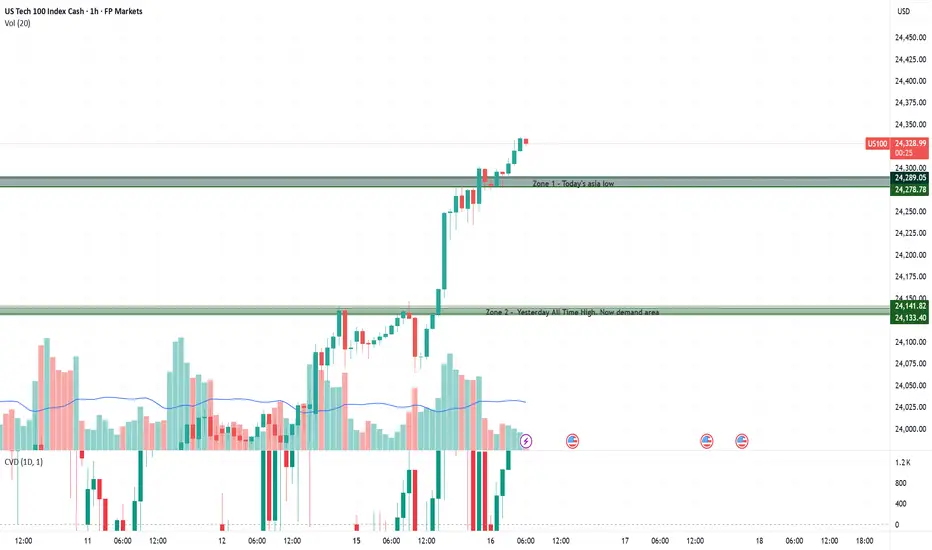
NAS100 Trading Zones – Navigating All-Time HighsThe Nasdaq is trading at all-time highs, which means there are no established sell zones above. In this environment, price is in full discovery mode. Every new tick higher sets fresh records, and volatility often picks up as traders probe for tops. That makes it difficult to fade strength, shifting the focus toward demand zones below as key areas for potential pullbacks.
🔹 Zone 1 – Today’s Asia Low (24,278–24,289)
This zone marks the intraday low from the Asian session and serves as the nearest short-term demand. A revisit here could attract buyers for a bounce, while a decisive break lower would signal loss of momentum and invite deeper retracement.
🔹 Zone 2 – Yesterday’s All-Time High, Now Demand (24,133–24,141)
Yesterday’s record high has flipped into a demand zone. As long as price holds above this level, the bullish structure stays intact. A strong rejection here favors continuation higher, but failure to hold could open the door to sharper downside.
Sentiment in the US100 remains cautiously optimistic. Softer labor data and easing producer prices have strengthened expectations of Fed rate cuts, while strong momentum in select tech names, including Oracle’s upbeat cloud outlook, continues to drive the index higher. Still, with price trading near all-time highs, volatility is elevated and the backdrop fragile, leaving traders mindful that optimism rests heavily on the Fed delivering on dovish expectations.
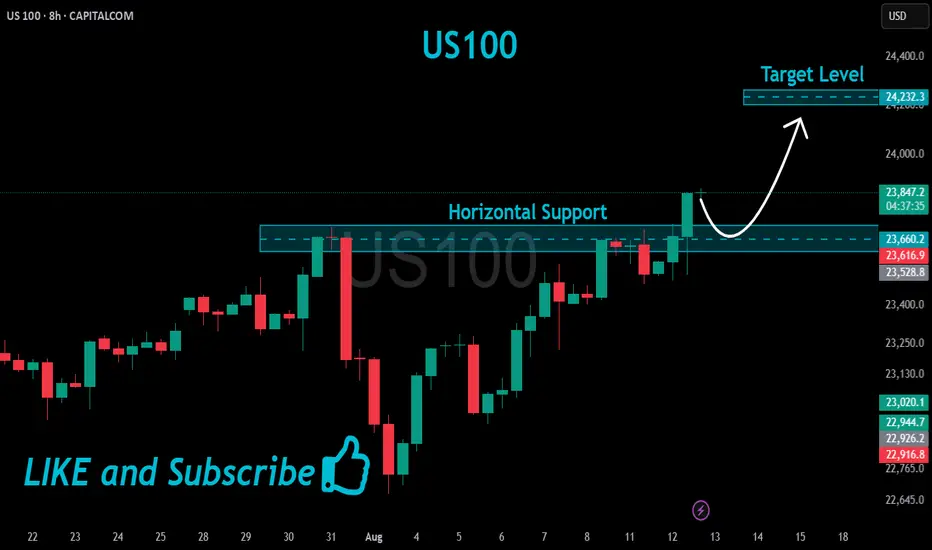
US100 Bullish Breakout!
HI,Traders !
#US100 is trading in a strong
Uptrend and the price made a
Bullish breakout of the key
Horizontal level of 23660.2
So we are bullish biased
And we will be expecting a
Further bullish move up !
Comment and subscribe to help us grow !
US100 Resistance Cluster Above!
HI,Traders !
#US100 made a bearish
Breakout of the support
Cluster of the rising and
Horizontal support levels
Which is now a resistance
Cluster round 22703.9 then
Went down and made a local
Pullback on Monday but we are bearish
Biased mid-term so we
Will be expecting a further
Bearish move down this week !
Comment and subscribe to help us grow !

"NAS100/US100" Index Market Money Heist Plan (Day / Scalping)🌟Hi! Hola! Ola! Bonjour! Hallo! Marhaba!🌟
Dear Money Makers & Robbers, 🤑💰✈️
Based on 🔥Thief Trading style technical and fundamental analysis🔥, here is our master plan to heist the "NAS100/US100" Index CFD Market. Please adhere to the strategy I've outlined in the chart, which emphasizes short entry. Our aim is the high-risk Green MA Zone. Risky level, oversold market, consolidation, trend reversal, trap at the level where traders and bullish robbers are stronger. 🏆💸"Take profit and treat yourself, traders. You deserve it!💪🏆🎉
Entry 📈 : "The heist is on! Wait for the MA breakout then make your move at (16400) - Bearish profits await!"
however I advise to Place sell stop orders above the Moving average (or) after the Support level Place sell limit orders within a 15 or 30 minute timeframe most NEAREST (or) SWING low or high level.
📌I strongly advise you to set an "alert (Alarm)" on your chart so you can see when the breakout entry occurs.
Stop Loss 🛑: "🔊 Yo, listen up! 🗣️ If you're lookin' to get in on a sell stop order, don't even think about settin' that stop loss till after the breakout 🚀. You feel me? Now, if you're smart, you'll place that stop loss where I told you to 📍, but if you're a rebel, you can put it wherever you like 🤪 - just don't say I didn't warn you ⚠️. You're playin' with fire 🔥, and it's your risk, not mine 👊."
📌Thief SL placed at the nearest/swing High or Low level Using the 4H timeframe (17300) Day/Scalping trade basis.
📌SL is based on your risk of the trade, lot size and how many multiple orders you have to take.
Target 🎯: 15300 (or) Escape Before the Target
"NAS100/US100" Index CFD Market Heist Plan (Scalping / Day Trade) is currently experiencing a Bearish trend.., driven by several key factors.👇👇👇
📰🗞️Get & Read the Fundamental, Macro, COT Report, Geopolitical and News Analysis, Sentimental Outlook, Intermarket Analysis, Index-Specific Analysis, Positioning and future trend targets... go ahead to check 👉👉👉🔗🔗
Detailed Explanation 📝
Fundamentals: Growth stalls 📉, valuations adjust—bearish shift 🐻.
Macro: Cooling economy 🌍, sticky inflation 🔥—downward pressure.
COT: Speculators flee 📉, hedgers dig in—bearish signal 🐻.
Index: Correction deepens 📉, support tests near—technical bear 🐻.
Intermarket: Yields/USD crush risk assets 💪—bearish tide.
Geopolitical: Trade wars ⚔️, regulation 🔍—negative catalysts pile up.
Sentiment: Fear takes hold 😟—bearish consensus builds.
Trends: Near/medium-term declines 📉, long-term hinges on recovery ⚖️.
Outlook: Moderately bearish 🌩️—tough sledding ahead.
⚠️Trading Alert : News Releases and Position Management 📰 🗞️ 🚫🚏
As a reminder, news releases can have a significant impact on market prices and volatility. To minimize potential losses and protect your running positions,
we recommend the following:
Avoid taking new trades during news releases
Use trailing stop-loss orders to protect your running positions and lock in profits
💖Supporting our robbery plan 💥Hit the Boost Button💥 will enable us to effortlessly make and steal money 💰💵. Boost the strength of our robbery team. Every day in this market make money with ease by using the Thief Trading Style.🏆💪🤝❤️🎉🚀
I'll see you soon with another heist plan, so stay tuned 🤑🐱👤🤗🤩

"US500/SPX500" Indices Market Heist Plan (Scalping / Day Trade)🌟Hi! Hola! Ola! Bonjour! Hallo! Marhaba!🌟
Dear Money Makers & Robbers, 🤑 💰💸✈️
Based on 🔥Thief Trading style technical and fundamental analysis🔥, here is our master plan to heist the "US500/SPX500" Indices Market. Please adhere to the strategy I've outlined in the chart, which emphasizes long entry. Our aim is the high-risk Red Zone. Risky level, overbought market, consolidation, trend reversal, trap at the level where traders and bearish robbers are stronger. 🏆💸"Take profit and treat yourself, traders. You deserve it!💪🏆🎉
Entry 📈 : "The heist is on! Wait for the MA breakout (5780) then make your move - Bullish profits await!"
however I advise to Place Buy stop orders above the Moving average (or) Place buy limit orders within a 15 or 30 minute timeframe most recent or swing, low or high level.
📌I strongly advise you to set an alert on your chart so you can see when the breakout entry occurs.
Stop Loss 🛑:
Thief SL placed at the recent/swing low level Using the 30m timeframe (5700) Day trade basis.
SL is based on your risk of the trade, lot size and how many multiple orders you have to take.
🏴☠️Target 🎯: 5860 (or) Escape Before the Target
🧲Scalpers, take note 👀 : only scalp on the Long side. If you have a lot of money, you can go straight away; if not, you can join swing traders and carry out the robbery plan. Use trailing SL to safeguard your money 💰.
"US500/SPX500" Indices Market Heist Plan (Scalping / Day Trade) is currently experiencing a bullishness,., driven by several key factors.
📰🗞️Get & Read the Fundamental, Macro, COT Report, Geopolitical and News Analysis, Sentimental Outlook, Intermarket Analysis, Index-Specific Analysis, Positioning and future trend targets.. go ahead to check 👉👉👉
⚠️Trading Alert : News Releases and Position Management 📰 🗞️ 🚫🚏
As a reminder, news releases can have a significant impact on market prices and volatility. To minimize potential losses and protect your running positions,
we recommend the following:
Avoid taking new trades during news releases
Use trailing stop-loss orders to protect your running positions and lock in profits
💖Supporting our robbery plan 💥Hit the Boost Button💥 will enable us to effortlessly make and steal money 💰💵. Boost the strength of our robbery team. Every day in this market make money with ease by using the Thief Trading Style.🏆💪🤝❤️🎉🚀
I'll see you soon with another heist plan, so stay tuned 🤑🐱👤🤗🤩

"NAS100/US100" Indices Market Heist Plan (Scalping / Day Trade)🌟Hi! Hola! Ola! Bonjour! Hallo! Marhaba!🌟
Dear Money Makers & Robbers, 🤑 💰💸✈️
Based on 🔥Thief Trading style technical and fundamental analysis🔥, here is our master plan to heist the "NAS100/US100" Indices Market. Please adhere to the strategy I've outlined in the chart, which emphasizes long entry. Our aim is the high-risk Red Zone. Risky level, overbought market, consolidation, trend reversal, trap at the level where traders and bearish robbers are stronger. 🏆💸"Take profit and treat yourself, traders. You deserve it!💪🏆🎉
Entry 📈 : "The vault is wide open! Swipe the Bullish loot at any price - the heist is on!
however I advise to Place buy limit orders within a 15 or 30 minute timeframe most recent or swing, low or high level. I Highly recommended you to put alert in your chart.
Stop Loss 🛑:
Thief SL placed at the recent/swing low level Using the 30m timeframe (19700) swing trade basis.
SL is based on your risk of the trade, lot size and how many multiple orders you have to take.
🏴☠️Target 🎯: 20350 (or) Escape Before the Target
🧲Scalpers, take note 👀 : only scalp on the Long side. If you have a lot of money, you can go straight away; if not, you can join swing traders and carry out the robbery plan. Use trailing SL to safeguard your money 💰.
"NAS100/US100" Indices Market Heist Plan (Scalping / Day Trade) is currently experiencing a bullishness,., driven by several key factors.
📰🗞️Get & Read the Fundamental, Macro, COT Report, Geopolitical and News Analysis, Sentimental Outlook, Intermarket Analysis, Index-Specific Analysis, Positioning and future trend targets.. go ahead to check 👉👉👉
📌Keep in mind that these factors can change rapidly, and it's essential to stay up-to-date with market developments and adjust your analysis accordingly.
⚠️Trading Alert : News Releases and Position Management 📰 🗞️ 🚫🚏
As a reminder, news releases can have a significant impact on market prices and volatility. To minimize potential losses and protect your running positions,
we recommend the following:
Avoid taking new trades during news releases
Use trailing stop-loss orders to protect your running positions and lock in profits
💖Supporting our robbery plan 💥Hit the Boost Button💥 will enable us to effortlessly make and steal money 💰💵. Boost the strength of our robbery team. Every day in this market make money with ease by using the Thief Trading Style.🏆💪🤝❤️🎉🚀
I'll see you soon with another heist plan, so stay tuned 🤑🐱👤🤗🤩

"US100 / US Tech / NASDAQ" Index Market Heist Plan🌟Hi! Hola! Ola! Bonjour! Hallo!🌟
Dear Money Makers & Robbers, 🤑 💰
Based on 🔥Thief Trading style technical and fundamental analysis🔥, here is our master plan to heist the "US100 / US Tech / NASDAQ" Index Metal market. Please adhere to the strategy I've outlined in the chart, which emphasizes long entry. Our aim is the high-risk Red Zone. Risky level, overbought market, consolidation, trend reversal, trap at the level where traders and bearish robbers are stronger. Be wealthy and safe trade.💪🏆🎉
Entry 📈 :Traders & Thieves with New Entry A bull trade can be initiated on the MA level breakout of 21,300.00
Stop Loss 🛑: Using the 3H period, the recent / nearest low or high level.
Goal 🎯: 22,400.00 (or) Escape Before the Target
Scalpers, take note 👀 : only scalp on the Long side. If you have a lot of money, you can go straight away; if not, you can join swing traders and carry out the robbery plan. Use trailing SL to safeguard your money 💰.
📰🗞️Fundamental, Macro, Sentimental Outlook:
The (US100 / US Tech / NASDAQ) market is expected to move in a bullish direction, driven by several key factors.
🟡Macroeconomic Factors:
Interest Rates: The Federal Reserve's dovish stance on interest rates is expected to support the US stock market.
Economic Growth: The US economy is expected to continue growing, albeit at a slower pace, supporting the stock market.
Inflation: Low inflation levels are expected to support the stock market, as they allow for accommodative monetary policy.
🟢Fundamental Factors:
Earnings Growth: Strong earnings growth from major tech companies, such as Apple and Microsoft, is expected to support the NASDAQ100.
Valuations: The NASDAQ100 is trading at a relatively high valuation, but strong earnings growth and low interest rates are expected to support the index.
Sector Rotation: The rotation into growth sectors, such as tech and healthcare, is expected to support the NASDAQ100.
🔵Trader/Market Sentimental Analysis:
Trader Sentiment: The CoT report shows that speculative traders are net long the NASDAQ100, indicating a bullish sentiment.
Market Sentiment: The market sentiment is bullish, with many analysts expecting the NASDAQ100 to continue its uptrend.
Technical Analysis: The technical analysis shows that the NASDAQ100 is in an uptrend, with a bullish breakout above the 13,000 level.
🟣Sentimental Outlook:
Bullish Sentiment: 65%
Bearish Sentiment: 20%
Neutral Sentiment: 15%
🟤Trader and Market Sentiment:
- 55% of institutional traders are long on the NASDAQ 100 index, indicating a bullish sentiment.
- Retail traders are also optimistic, with 60% of traders holding a long position on the index.
⚠️Trading Alert : News Releases and Position Management 📰 🗞️ 🚫🚏
As a reminder, news releases can have a significant impact on market prices and volatility. To minimize potential losses and protect your running positions,
we recommend the following:
Avoid taking new trades during news releases
Use trailing stop-loss orders to protect your running positions and lock in profits
📌Please note that this is a general analysis and not personalized investment advice. It's essential to consider your own risk tolerance and market analysis before making any investment decisions.
📌Keep in mind that these factors can change rapidly, and it's essential to stay up-to-date with market developments and adjust your analysis accordingly.
💖Supporting our robbery plan will enable us to effortlessly make and steal money 💰💵 Tell your friends, Colleagues and family to follow, like, and share. Boost the strength of our robbery team. Every day in this market make money with ease by using the Thief Trading Style.🏆💪🤝❤️🎉🚀
I'll see you soon with another heist plan, so stay tuned 🫂

US100 Local Short! CAPITALCOM:US100 went up to retest
The broke rising support
Which is now a resistance
And we will be expecting
A local bearish correction !

US100 Bearish Breakout! US100 was trading along
The rising support line
But now we are seeing
A bearish breakout so
We are now bearish biased
And we will be expecting
A further move down !

NASDAQ Pair : US100 - Nasdaq
Description :
Completed " 12345 " Impulsive Waves
Break of Structure
RSI - Divergence
Exp FIAT as an Corrective Pattern in Short Time Frame
Fibonacci Level - 261.8%

NAS100 Technical Analysis and Trade Idea - Full ExplanationMarket Observations: The #NAS100 has maintained a bullish trajectory. However, price action on the monthly timeframe suggest the #US100 is overextended. Additionally, the weekly chart reveals a double top pattern, hinting at a potential retracement down to the 50-61.8% Fibonacci levels. This area could provide the liquidity needed for major market players to fill long orders.
Trade Strategy: Consider an intraday/swing trade short entry following a potential stop run above the current range. Target an initial profit level around the previous lows near 17250, with a secondary target at 17000 (slightly above the 61.8% Fibonacci level on a 1W chart). Implement a well-placed stop-loss order to manage risk effectively.
Disclaimer: This analysis is based on my observations and does not constitute financial advice. Conduct your own independent research and carefully assess your risk tolerance before making investment decisions.

US100 Strong Resistance Ahead!US100 made nice bullish
Move up but a strong
Horizontal resistance is ahead
At 17638.5 from where I think
We will see a bearish reaction !

NAS100 Trade IdeaThe NAS100 experienced a substantial rally towards the end of last week, displaying signs of being significantly overextended. A retracement may be in store, particularly if the Dollar Index (DXY) maintains and strengthens its position, considering the general inverse correlation between DXY and US100. It is essential to emphasize that this analysis is provided exclusively for educational purposes and should not be construed as financial advice.

US100 NASDAQ Technical Analysis and Trade Idea NAS100Sharp Retracement in NAS100: Opportunity on the Horizon?
Eyes are laser-focused on the NAS100 after it slammed into a key resistance level. The current aggressive pullback sets the stage for an intriguing dynamic ahead of the NFP data drop later today. A strong dollar boost (or unexpected weakness) could significantly impact the index, making this data release a potential swing point.
With such a sharp retracement already underway, I'm eyeing a potential long entry as the price plunges towards a crucial support zone. In the video, we dissected the trend, price action, market structure, and other technical essentials to build a comprehensive picture.
Remember: This analysis is purely for educational purposes and should not be interpreted as financial advice. Do your own due diligence before making any trading decisions.

NSDQ Possible BUYPrice just reject optimal trading zone and close above the mention range .You initiate buy positions

US100 Analysis 19July2023This analysis is still in accordance with the analysis some time ago. The price touches Fibo Extension 1 and still continues the bullish rally. currently forming a bullish channel with a target of 0.786

US100 tradeafter liquidity taken of sell side we will see back of the price to fill FVG '' Fare value gap'' and mitigation for odrer block after we will see a drop of the price

US100 Analysis 13July2023after a few days of correction, today US100 managed to break the resistance. if we draw fibo extension, we can estimate fibo 1 as the minimum target.

US100 TRADEAfter change of character and retracement to fill fvg we will see a down trend towards kill zones for Asia and London Session

us100 next moveThe NASDAQ is trading outside Monday's range in a negative way, which indicates the continuation of the bearish trend during the day on Tuesday. Wait for the price to return to fvg shown in front of you in the chart to search for selling opportunities during the day

Nasdaq Next MovePair : Nasdaq - US100
Description :
Rising Wedge as an Corrective Pattern in Long Time Frame
Break of Structure
Completed " 1234 " Impulsive Wave
Fibonacci - 100.0%
Divergence
S / R Level
